Thread Concurrency Visualization | PyCharm (original) (raw)
Overview
This feature helps gain full control over the multi-threaded applications. The concurrency visualization session runs with the current run/debug configuration in the Concurrency Diagram mode.
Starting the concurrency visualization session
- Do one of the following:
- Go to .
- Click
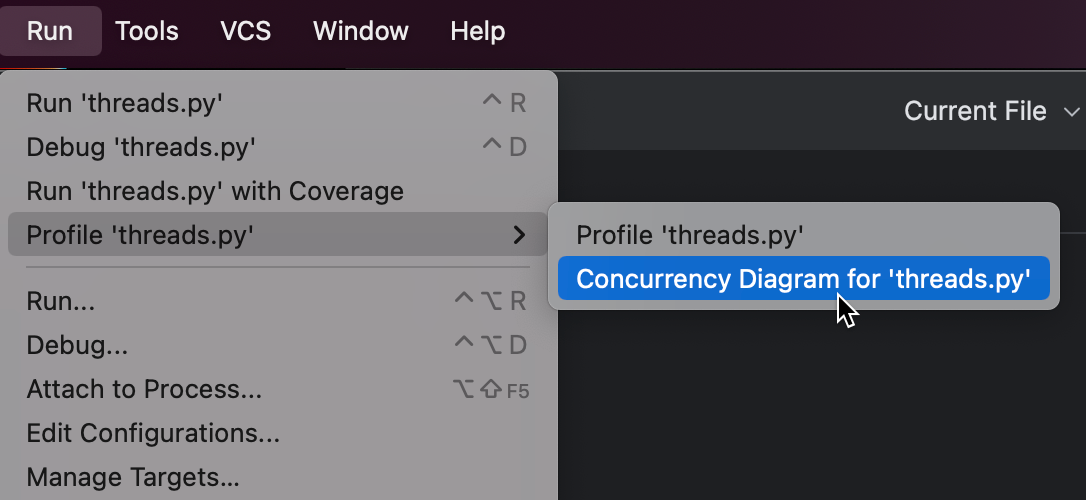
 More Actions in the Run widget at the top of the PyCharm window and select Concurrency Diagram for < script_name>.
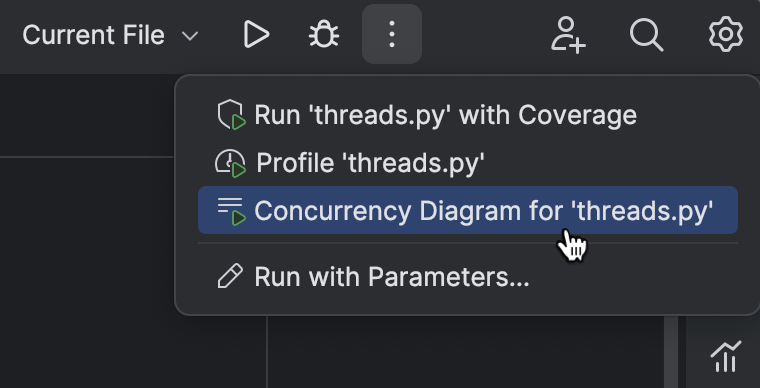
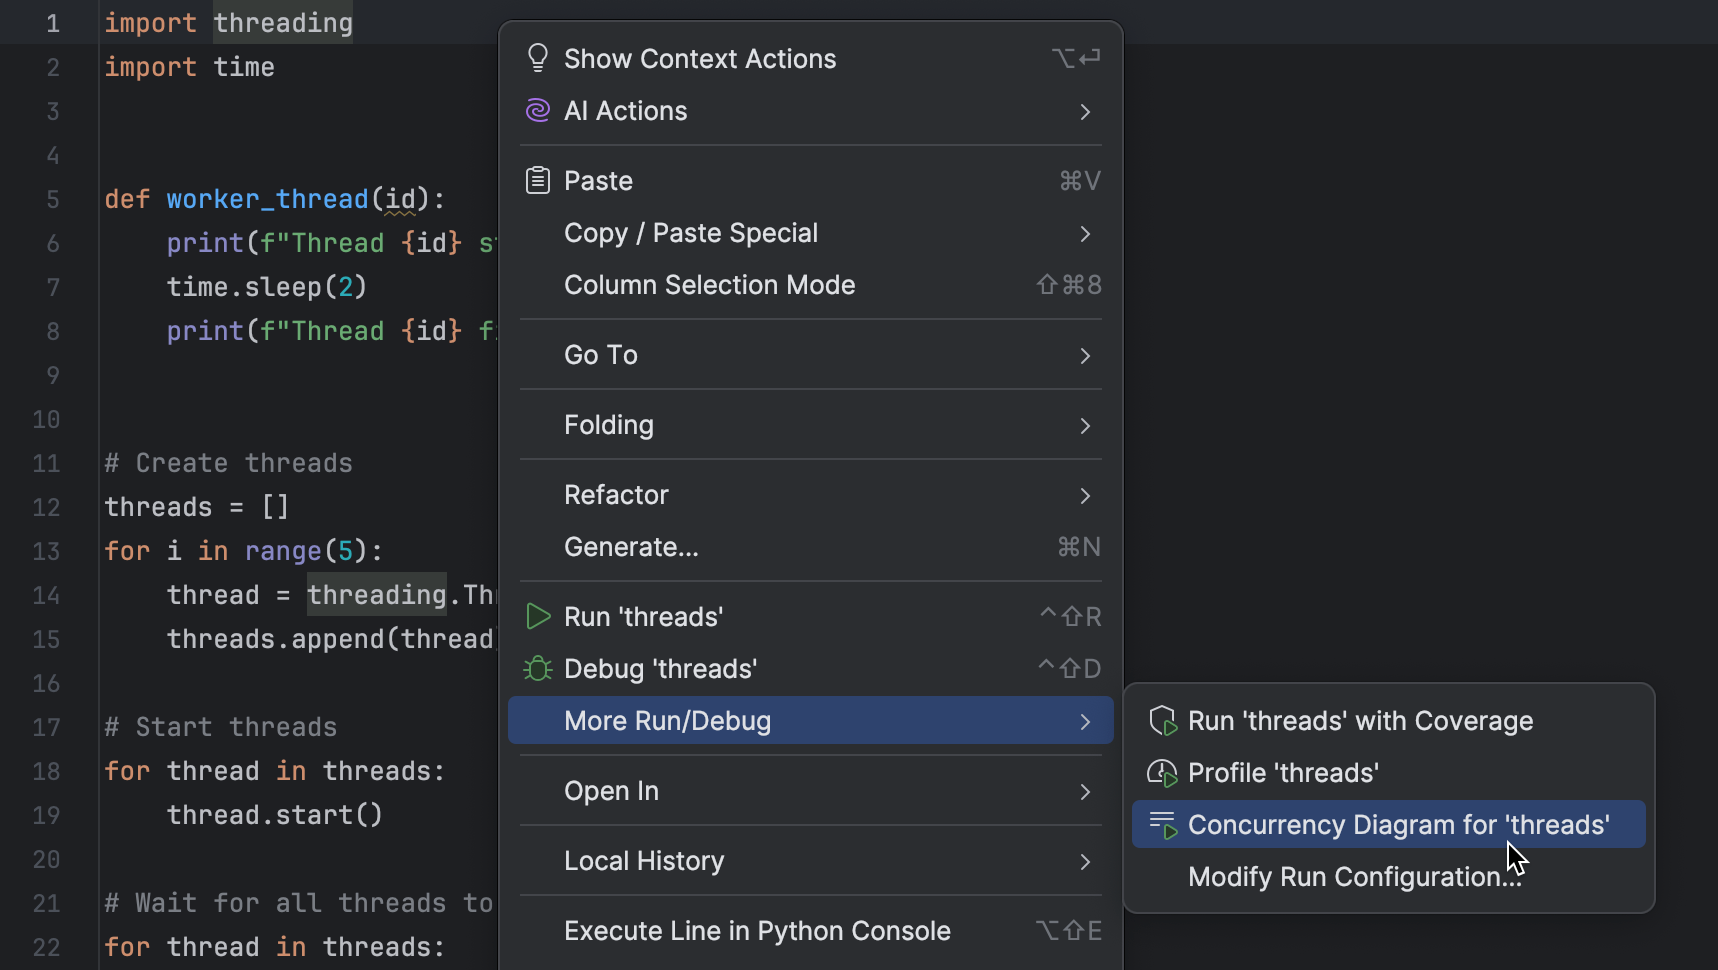
- Right-click a target file in the editor and select .
- Provided that the main toolbar or the navigation bar is visible, click
 and select .
The concurrency visualization diagram shows the real time states of threads inside the running process in the Threading graph tab of the Concurrent Activities Diagram tool window.
Concurrency visualization for the applications that use asyncio
Concurrency visualization also works well with the asyncio module available in Python 3.5 and later.
To make use of the concurrency visualization, run the application that uses asyncio same way as described above, and then switch to Asyncio graph tab.
- The left-hand side of the tool window contains the toolbar with the following icons:
 - click this button to terminate the running process.
  /
/ - click these buttons to increase or decrease scale of the diagram.
  - when the diagram is drawn for a long time and output is too long, then a scrollbar appears. When this button is pressed, this scrollbar is automatically scrolled to the end.
- Next to the toolbar, there is the list of thread names; the right-hand side shows the waiting time for each thread, a period of time prior to thread execution:
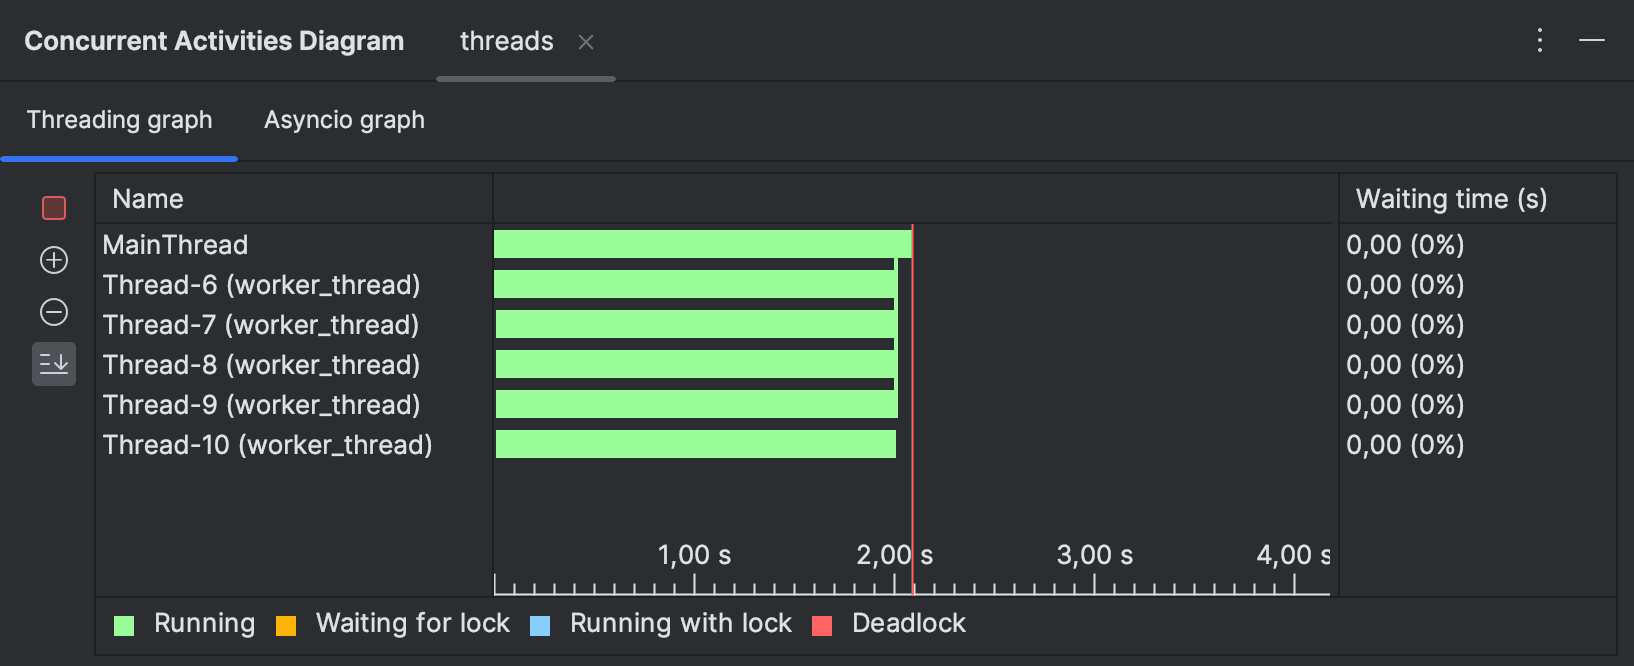
- Different states are marked with different colors. The legend is shown in the window.
- To zoom in and out, use the magnifier glass icons in the toolbar, or Ctrl+mouse wheel.
- To navigate to a particular stack frame, click the diagram.
Right-clicking on a graph invokes a context menu with the following commands:
| Item | Description |
|---|---|
| Show related locks | This command highlights on a graph all the thread expectations, which work with the same lock where a context menu has been invoked. |
| Hide related locks | This command hides the highlighting described above. |
17 June 2024