El Niño and a record CO2 rise (original) (raw)
- Commentary
- Published: 13 June 2016
Nature Climate Change volume 6, pages 806–810 (2016) Cite this article
- 8281 Accesses
- 243 Citations
- 898 Altmetric
- Metrics details
Subjects
The recent El Niño event has elevated the rise in CO2 concentration this year. Here, using emissions, sea surface temperature data and a climate model, we forecast that the CO2 concentration at Mauna Loa will for the first time remain above 400 ppm all year, and hence for our lifetimes.
This is a preview of subscription content, access via your institution
Relevant articles
Open Access articles citing this article.
Surprising stability of recent global carbon cycling enables improved fossil fuel emission verification
- Benjamin Birner
- , Christian Rödenbeck
- … Ralph F. Keeling
Nature Climate Change Open Access 17 August 2023
Access options
Subscribe to this journal
Receive 12 print issues and online access
$259.00 per year
only $21.58 per issue
Buy this article
- Purchase on SpringerLink
- Instant access to the full article PDF.
USD 39.95
Prices may be subject to local taxes which are calculated during checkout
Additional access options:
Figure 1: Identifying, testing and forecasting the relationship between Niño 3.4 SST anomalies and Mauna Loa CO2 growth rates.
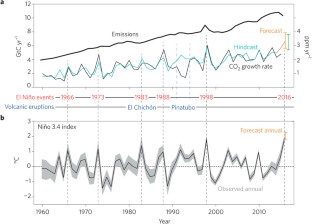
The alternative text for this image may have been generated using AI.
Figure 2: CO2 growth rate (minus anthropogenic emissions component) versus Niño 3.4 anomaly9.

The alternative text for this image may have been generated using AI.
Figure 3: Observed and forecast CO2 concentrations at Mauna Loa.

The alternative text for this image may have been generated using AI.
References
- Ciais, P. et al. in Climate Change 2013: The Physical Science Basis (eds Stocker, T. F. et al.) Ch. 6 (IPCC, Cambridge Univ. Press, 2013).
Google Scholar - Le Quéré, C. et al. Earth Syst. Sci. Data 7, 349–396 (2015).
Article Google Scholar - Keeling, C. D. et al. in A History of Atmospheric CO2 and its Effects on Animals, Plants, and Ecosystems (eds Ehleringer, J. R., Cerling, T. E. & Dearing, M. D.) Ch. 5 (Scripps Institution of Oceanography, 2001).
- Thoning, K. W., Tans, P. P. & Komhyr, W. D. J. Geophys. Res. 94, 8549–8565 (1989).
Article CAS Google Scholar - Bacastow, R. B. Nature 261, 116–118 (1976).
Article CAS Google Scholar - Bacastow, R. B. et al. Science 210, 66–68 (1980).
Article CAS Google Scholar - Keeling, C. D., Whorf, T. P., Whalen, M. & van der Plicht, J. Nature 375, 666–670 (1995).
Article CAS Google Scholar - Jones, C. D., Collins, M., Cox, P. M. & Spall, S. A. J. Clim. 14, 4113–4129 (2001).
Article Google Scholar - Jones, C. D. & Cox, P. M. Geophys. Res. Lett. 32, L14816 (2005).
Google Scholar - Kennedy, J. J., Rayner, N. A., Smith, R. O., Saunby, M. & Parker, D. E. J. Geophys. Res. 116, D14104 (2011).
Article Google Scholar - Page, S. E. et al. Nature 420, 61–65 (2002).
Article CAS Google Scholar - Langmann, B. & Heil, A. Atmos. Chem. Phys. 4, 2145–2160 (2004).
Article CAS Google Scholar - Global Fire Emissions Database (Global Fire Data, accessed 27 May 2016); http://globalfiredata.org,
- MacLachlan, C. et al. Q. J. R. Meteorol. Soc. 141, 1072–1084 (2014).
Article Google Scholar - Howard, B. C. Northern hemisphere cracks 400 ppm CO2 for whole month for first time. National Geographic (May 27 2014); http://go.nature.com/1spge8j
- Jackson, R. B. et al. Nature Clim. Change 6, 7–10 (2015).
Article Google Scholar - Field, R. D., van der Werf, G. R. & Shen, S. S. P. Nature Geosci. 2, 185–188 (2009).
Article CAS Google Scholar - Cox, P. M., Betts, R. A., Jones, C. D., Spall, S. A. & Totterdell, I. J. Nature 408, 184–187 (2000).
Article CAS Google Scholar - Collins, M. et al. in Climate Change 2013: The Physical Science Basis (eds Stocker, T. F. et al.) Ch. 12 (IPCC, Cambridge Univ. Press, 2013).
Google Scholar - Cox, P. M. et al. Nature 494, 341–345 (2013).
Article CAS Google Scholar - van Vuuren, D. et al. Climatic Change 109, 95–116 (2011).
Article Google Scholar - Smith, P. et al. Nature Clim. Change 6, 42–50 (2016).
Article CAS Google Scholar - Anderson, K. Nature Geosci. 8, 898–900 (2015).
Article CAS Google Scholar - Keeling, R. F. Is this the last year below 400? The Keeling Curve (21 October 2015); http://go.nature.com/1X2gXc1
Acknowledgements
We thank C. MacLachlan for performing the GloSea5 simulations, N. Rayner for providing the HadSST data, and S. Ineson and A. Scaife for comments. R.A.B received support from the European Commission's 7th Framework Programme (EU/FP7) under Grant Agreement 603864 (HELIX). The work of R.A.B., C.D.J., J.R.K. and J.J.K. forms part of the DECC/Defra Met Office Hadley Centre Climate Programme GA01101. R.F.K. was supported by the US Department of Energy under award DE-SC0012167 and by Schmidt Philanthropies.
Author information
Authors and Affiliations
- Met Office Hadley Centre, FitzRoy Road, Exeter, EX1 3PB, UK
Richard A. Betts, Chris D. Jones, Jeff R. Knight & John J. Kennedy - University of Exeter, College of Life and Environmental Science, Hatherly Laboratories, Prince of Wales Road, Exeter, EX4 4PS, UK
Richard A. Betts - Scripps Institution of Oceanography, UC San Diego 0244, 9500 Gilman Drive, La Jolla, 92093-0244, California, USA
Ralph F. Keeling
Authors
- Richard A. Betts
- Chris D. Jones
- Jeff R. Knight
- Ralph F. Keeling
- John J. Kennedy
Corresponding author
Correspondence toRichard A. Betts.
Supplementary information
Rights and permissions
About this article
Cite this article
Betts, R., Jones, C., Knight, J. et al. El Niño and a record CO2 rise.Nature Clim Change 6, 806–810 (2016). https://doi.org/10.1038/nclimate3063
- Published: 13 June 2016
- Issue date: September 2016
- DOI: https://doi.org/10.1038/nclimate3063