Color naming reflects optimal partitions of color space (original) (raw)
Abstract
The nature of color categories in the world's languages is contested. One major view holds that color categories are organized around universal focal colors, whereas an opposing view holds instead that categories are defined at their boundaries by linguistic convention. Both of these standardly opposed views are challenged by existing data. Here, we argue for a third view based on a proposal by Jameson and D'Andrade [Jameson KA, D'Andrade RG (1997) in Color Categories in Thought and Language, eds Hardin CL, Maffi L (Cambridge Univ Press, Cambridge, U.K.), pp 295–319]: that color naming across languages reflects optimal or near-optimal divisions of an irregularly shaped perceptual color space. We formalize this idea, test it against color-naming data from a broad range of languages and show that it accounts for universal tendencies in color naming while also accommodating some observed cross-language variation.
Keywords: cognitive modeling, color categories, color terms, semantic universals
It is often claimed that color categories in the world's languages are organized around six universal focal colors corresponding to the best examples, or prototypes, of English black, white, red, green, yellow, and blue or comparable terms in other languages (1). On this view, the boundaries of color categories are projected from these universal foci and therefore tend to lie in similar positions in color space across languages. In contrast, the opposing “relativist” view denies that foci are a universal basis for color naming and instead maintains that color categories are defined at their boundaries by local linguistic convention, which is free to vary considerably across languages (2–5).
Each of these two views is challenged by existing data. Universals of color naming exist (6), and the best examples of color terms across a wide range of languages cluster near the six proposed focal colors (7). These findings are consistent with the focal-color account and inconsistent with the linguistic-convention account. However, despite this clustering near the six foci, the best examples of many color categories do fall elsewhere, a finding less easily accommodated by the focal-color account. Moreover, languages with the same number of categories, apparently organized around the same or similar foci, sometimes differ in their placement of category boundaries (4), which suggests that category boundaries are determined by more than the six proposed universal foci.
A possible resolution of this tension is suggested by a proposal advanced by Jameson and D'Andrade (8). Their proposal can be viewed as a natural generalization of the focal-color account, one in which every color is focal (perceptually salient) to some extent, and some, such as the six listed above, are simply more focal than others:
One possible explanation [for universals in color naming] is … the irregular shape of the color space. … Hue interacts with saturation and lightness to produce several large “bumps”; one large bump is at focal yellow, and another at focal red. … We assume that the names that get assigned to the color space … are likely to be those names which are most informative about color (ref. 8, p. 312).
Thus, each point on the outer skin of color space is salient to some extent, but some colors on that skin are more salient than others; these are the “bumps” on the surface. Jameson and D'Andrade (8) suggest that, given this irregularly shaped space, general principles of categorization may account for universals of color naming (see also refs. 9–11). Although the general principle proposed was originally characterized as “informativeness,” Jameson (12, 13) has suggested that the operative principle may be that of Garner (14): that categories are constructed so as to maximize similarity within categories and minimize it across categories. Under this principle, certain categorical partitions of the lumpy perceptual color space will be optimal in the sense that they optimize this measure, and others will be less so. The hypothesis is that optimal or near-optimal partitions correspond to observed universals in color naming. This proposal also may accommodate the finding that similar languages sometimes have different boundary placements: such languages may have distinct color-naming systems that differ minimally, if at all, in optimality.
Jameson and D'Andrade's (8) proposal is intuitively appealing. However, because the idea was originally advanced without formalization and because its development has remained largely informal (e.g., refs. 12 and 13), no formal test of this proposal against detailed empirical data has been attempted. Here, we formalize this idea and test it against detailed color-naming data from a wide range of languages. Our goal in doing so is to determine whether this proposal can avoid the challenges faced by the two opposing views sketched above.
Liljencrants and Lindblom (15) suggested that a similar idea may explain universal tendencies in the structure of vowel systems in vowel space. They proposed a formal model based on a measure of overall perceptual contrast among vowel categories: The more dispersed the categories in vowel space, the better the vowel system by their measure. (This dispersion corresponds to minimizing similarity across categories; because they represented vowel categories as points, they did not also measure within-category similarity.) Liljencrants and Lindblom (15) explored the space of possible vowel systems and found that those with the greatest perceptual contrast corresponded fairly well to vowel systems found in the world's languages. If related ideas can account for universal tendencies in named color categories across languages, then that would suggest a loose parallel between the forces that create categories of sound and those that create categories of meaning (16, 17).
The World Color Survey
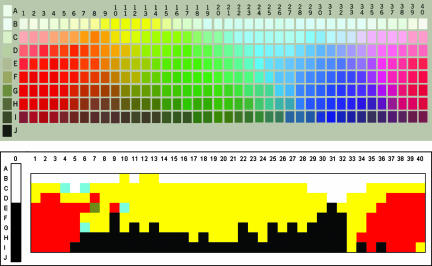
We took as our empirical base the color-naming data of the World Color Survey (WCS) (18, 19). These data were obtained by using a stimulus palette of 330 colors, as approximated in Fig. 1Upper. The palette consists of 40 equally spaced Munsell hues, which are represented by the columns; achromatics, which are represented in the left-most column; and eight levels of value (lightness; 10 for the achromatics), represented by the rows. Each hue–value pair is at maximum available chroma (saturation). Speakers of each of 110 languages of nonindustrialized societies named each of the color chips in this array.e There are clear universals of color naming in the WCS data (6, 7, 20–23) but also substantial cross-language variation. We hope to explain why color categories across languages have the shapes and locations in color space they have.
Fig. 1.
Stimuli and example of a mode map. (Upper) WCS stimulus palette. (Lower) Mode map for Lele, a language with four major categories, and several chips for which the modal response was some other category; each category is denoted by a color.
In the present study, for each WCS language, we recorded the modal color term for each chip in the array, i.e., the color term that was assigned to that chip by the largest number of speakers of that language. We refer to the resulting labeling of the entire array as the “mode map” for that language. For example, Fig. 1 Lower shows the mode map for Lele, a language spoken in Chad; here, as in mode maps throughout this paper, each color denotes a color term, or named color category.f This process produced a mode map for each of the 110 WCS languages.
Formal Specification
Color Space.
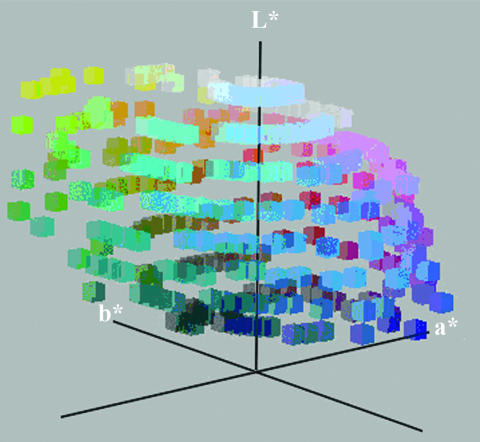
Because our tests depend on perceptual similarities between colors, which could be conveniently expressed by a distance metric, and because the Munsell system does not have a psychologically meaningful distance metric, we started by representing each of the colors in the stimulus palette in the CIEL*a*b* (or CIELAB) color space, which does have such a metric. For relatively short distances at least, the distance between two colors in CIELAB space corresponds roughly to their psychological dissimilarity (24).g When the colors in the stimulus array above are plotted in CIELAB, they form a rather distorted sphere, with the white point (A0 in Fig. 1) at the north pole, the black point (J0 in Fig. 1) at the south pole, the intermediate grays running along the L* axis between these two poles, and all colored chips forming a bumpy, vaguely spherical surface around that axis, as shown in Fig. 2. These points are an approximation to the outer surface of the color solid, the space of realizable colors. There is a large protrusion outward from the sphere's surface around yellow and other smaller irregularities elsewhere. The hypothesis is that these irregularities in the space, interacting with general principles of categorization, cause natural clusters to form that correspond to observed color-naming universals.
Fig. 2.
The chips of the WCS stimulus array as plotted in CIELAB space. The irregularity of the distribution can be seen, particularly in the outward protrusion of the yellow region.
Partitions of Color Space.
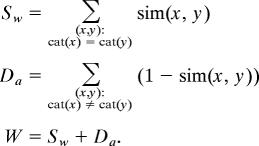
Imagine that each chip in the stimulus array of Fig. 1 has been labeled with some category; we wish to characterize how good a categorical partition of color space this arrangement represents. To that end, we defined an objective function that measures the extent to which such an assignment of category labels to chips maximizes similarity within categories and minimizes similarity across categories. We refer to this quantity as “well-formedness”: optimal partitions of color space are those that maximize this well-formedness measure. We take the similarity of two colors x and y to be a monotonically decreasing (specifically Gaussian) function of the distance between the two colors in CIELAB space:
where dist(x, y) is the CIELAB distance between colors x and y, and c is a scaling factor (set to 0.001 for all simulations reported here). This similarity function, which we adopt from the psychological literature on categorization (e.g., ref. 25), has a maximum value of 1 when chips x and y are the same [i.e., dist(x, y) = 0] and a value that falls off approaching 0 as the distance between chips x and y becomes arbitrarily large. This similarity function thus captures the qualitative observation that beyond a certain distance colors appear “completely different,” so that increasing the distance has no further effect on dissimilarity. The well-formedness function W is then defined as follows:
Here, _S_w is an overall measure of similarity within categories. Similarity is summed across unique pairs of chips (x, y) that are labeled with the same category [cat(x) = cat(y)]. _D_a is an analogous overall measure of dissimilarity across categories. Here, dissimilarity [1 − sim(x, y)] is summed across unique pairs of chips (x, y) that are labeled with different categories [cat(x) ≠ cat(y)]. The well-formedness W of a particular assignment of category labels to chips is the sum of _S_w and _D_a. The higher this quantity, the more well-formed the configuration.
If color naming across languages is shaped in part by the constraints embodied in this function, we would expect the color-naming schemes of the world's languages to correspond to relatively high well-formedness values. Concretely, we predicted the following:
- Artificially generated color-naming schemes that lie at global well-formedness maxima should resemble the natural color-naming schemes found in some of the world's languages.
- Given the pattern of color naming in any language, systematic distortions away from that pattern should tend to result in lower well-formedness values than in the observed pattern.
These two predictions differ in strength: The first predicts that at least some languages fit a certain pattern, whereas the second predicts that all languages fit another pattern. We tested both predictions against the color-naming data of the WCS.
Optimal Color-Naming Schemes
We used simulations to construct theoretically optimal color-naming schemes by maximizing well-formedness (W). Specifically, we obtained the theoretically optimal color-naming scheme with n categories for each of n = 3, 4, 5, and 6. In each case, we began by randomly assigning each chip in the stimulus array to one of the n categories. We then adjusted category extensions through steepest ascent in well-formedness. Each of the 330 chips in the array was selected in random order and assigned the category that produced the greatest overall increase in well-formedness (cf. ref. 26). This process was repeated until no further increase was possible. This optimization process as a whole was conducted 20 times with different random initializations for each n; the resulting color-naming scheme with the highest well-formedness value among these 20 was taken to be optimal for that value of n.
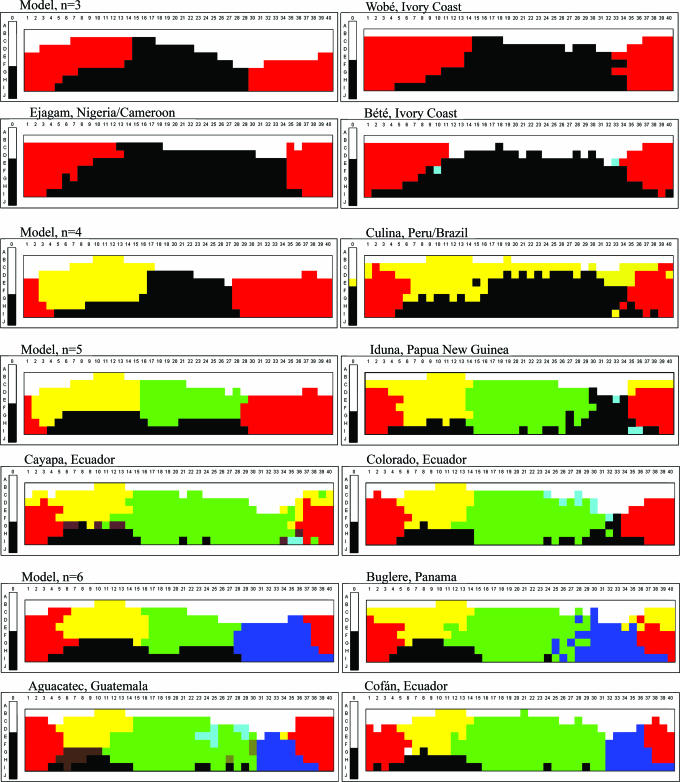
Fig. 3 shows for n = 3, 4, 5, or 6, respectively, the optimal model result obtained in the manner just described and data from languages in the WCS that are similar to the predicted optimal pattern.h
Fig. 3.
Model results for n = 3, 4, 5, and 6, each compared with color-naming schemes of selected languages from the WCS.
Well-formedness optimization tends to place categories in roughly the right places for these languages. For example, the model correctly predicts that when a system has a separate yellow category that category will tend to be lighter (nearer to white) than are categories of other hues. It also captures the rather detailed fact that in three-term systems, the composite red/yellow term does not extend as far toward white as the separate yellow term does in the four-, five-, and six-term systems. Thus, as predicted, there do exist some languages with color-naming schemes fairly similar to the theoretically optimal configurations produced by the model.
However, the model does deviate from the observed patterns, in some cases systematically. This deviation is especially pronounced in the blue region. Starting with three-term languages and continuing through six-term languages, the category that includes green in the theoretically optimal configurations usually does not extend far enough “rightward” into blue/purple (see, e.g., Fig. 3, hue columns 30–32). Thus, with regard to blue, this model makes the wrong prediction.
Moreover, there are many languages in the WCS with color-naming systems that are not very similar to the hypothetically optimal model configurations. To give a sense of this disimilarity, Fig. 4 displays the mode maps for four WCS languages with extensions that diverge, sometimes sharply, from the predicted optimal configurations.
Fig. 4.
WCS color-naming systems that are dissimilar from the predicted optimal configurations.
In summary, aside from the problem with the blue region, there exist languages for which well-formedness optimization does a fairly good job of placing categories roughly where they actually fall, as predicted. On the other hand, there are a number of languages that do not much resemble these theoretically optimal patterns. Nonetheless, we suggest that across all languages, color-naming systems will be shaped to a detectable extent by well-formedness in a universal perceptual color space. We test this prediction below.
Well-Formedness of Attested and Unattested Color-Naming Schemes
If color naming across languages is shaped in part by the universal structure of perceptual color space, we would expect to find traces of that structure in the color-naming system of any language, not just those that are similar to the optimal patterns. To probe this idea, we started with Berinmo, a Papua New Guinea language that has been claimed to counterexemplify universal tendencies of color naming (ref. 2, but see refs. 20 and 21) and that therefore could be considered a conservative test of our proposal.
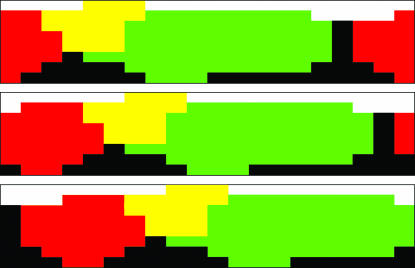
We considered the Berinmo color-naming data and 19 hypothetical variants of it, which were obtained by rotating the actual data by 2, 4, 6, etc. (and −2, −4, −6, etc.), hue columns in the stimulus array (around the “equator” of the color solid) as illustrated in Fig. 5.i
Fig. 5.
Berinmo color categories unrotated (Top) and rotated four (Middle) and eight (Bottom) hue columns. Each colored region corresponds to a named color category.
This procedure yielded a set of systematic variants of the Berinmo color-naming system in which the same configuration of categories relative to each other is maintained while the absolute position of this configuration of categories along the hue axis is varied. Critically, only one of these variants (the unrotated variant) we know to be actually attested. If color naming is shaped in part by the universal structure of perceptual color space according to the well-formedness model, we would expect the attested (unrotated) color-naming system of Berinmo to have higher well-formedness than any of the comparable rotated variants. Why? Because, by hypothesis, the boundaries of the naturally occurring Berinmo system lie where they do in large part because of the structure of perceptual color space, whereas this is not true of the artificially derived variants, in which the boundaries were deliberately shifted away from their natural positions. Moreover, we would expect well-formedness to drop off as a function of the amount of rotation away from the naturally occurring Berinmo color-naming scheme.
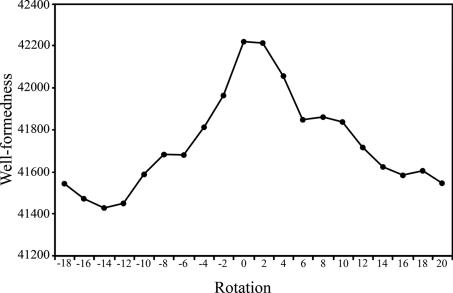
These expectations were confirmed, as shown in Fig. 6, although +2 columns rotation was a close competitor for maximum well-formedness. The fact that well-formedness is maximized for the unrotated version of Berinmo indicates that the attested Berinmo color-naming system is more consistent with the universal structure of perceptual color space, coupled with general principles of category formation, than are any of the hypothetical rotated variants. Thus, it appears that the Berinmo color-naming system is located where it is along the hue dimension not because “color categories are formed from boundary demarcation based predominantly on language” (2), but rather because the structure of perceptual color space makes its actual location the optimal location. At the same time, the near maximum at +2 columns rotation is also informative: It shows that small variations in boundary placements sometimes lead to only very modest differences in well-formedness, which may explain why similar languages can differ somewhat in their boundary placements (4).
Fig. 6.
Well-formedness for Berinmo when rotated 0, 2, 4, 6, etc., hue columns. The configuration that yields greatest well-formedness is the unrotated (attested) version.
A More General Test
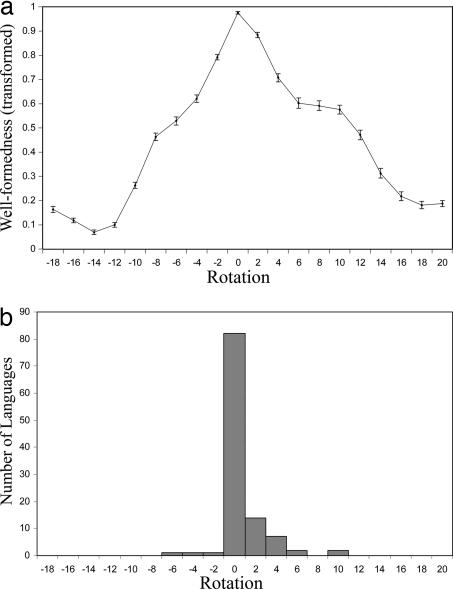
To test this idea more generally, we conducted the same rotation-based analysis on each of the 110 languages of the WCS. We predicted that well-formedness would be higher for the actually observed data for a given language than for hypothetical versions of that language, which were derived from the original by rotation, as in the preceeding section. [The well-formedness values of different languages often differ substantially, hampering easily visualizeable cross-language comparison. For this reason, we transformed all well-formedness values to the range (0–1) to make them comparable across languages: for each language L, the minimum well-formedness value that any rotation of L received was mapped to 0; the maximum value that any rotation of L received was mapped to 1; and the values for all other rotations of L were linearly transformed to lie between these two extremes.] Fig. 7a shows the transformed well-formedness value averaged across all WCS languages under each rotation.
Fig. 7.
Rotation analysis of WCS data. (a) Well-formedness averaged across all 110 WCS languages as a function of rotation. For each rotation, the dot shows the average transformed well-formedness value across languages and the bar shows the standard error. (b) Number of WCS languages exhibiting a well-formedness maximum at each rotation.
In general, well-formedness is highest when languages are unrotated, and greater rotation away from the naturally occurring system results in correspondingly less optimal values, as predicted. The fact that the mean transformed well-formedness value for unrotated languages is near one, with little variation, indicates that most languages have maximum well-formedness when unrotated. To probe this issue directly, we also determined for each language in the WCS which rotation of that language yielded the highest well-formedness value. We then tallied how many languages had their well-formedness maximum at each rotation. The results are shown in Fig. 7b. Most languages (82 of 110) have their well-formedness maximum at 0 columns rotation. There are some languages that have their maximum elsewhere, but most are fairly near 0 columns rotation.
These results show that the point that applied to Berinmo applies more generally across languages: The color-naming systems of the world's languages tend to be positioned in hue just where the structure of perceptual color space predicts they should be.
Discussion
The literature on color naming has recently been dominated by the opposition of two major views: that color categories are organized around universal foci (1, 7, 23) and that categories are determined at their boundaries by linguistic convention (2–4). For the latter view, the only major universal constraint on color naming is that a category must occupy a connected region in color space; aside from that constraint, the location of the category and its boundaries in color space are a “free parameter” (5), subject to presumably arbitrary cultural determination.
The model and data presented here do not align directly with either of these two traditionally opposed positions. Instead, they support the proposal of Jameson and D'Andrade (8): that color naming is determined in part by general principles of categorization partitioning an irregularly shaped color solid. This view has in common with the focal-color account that there are universal perceptual constraints governing the position and shape, not just the connectedness, of color categories across languages. But in contrast with the focal-color account as usually articulated, there is a potentially unlimited repertoire of foci. Every color is “focal” (perceptually salient) to some degree, although some more than others, and categories are formed by general principles of categorization operating over the resulting uneven landscape. By the same token, there are both similarities to and differences from the linguistic-convention account. By casting color naming in terms of a well-formedness measure based on similarity within and across categories, we support the claim, and help to explain the fact, that color categories tend to occupy connected regions of color space. Moreover, our findings leave open the possibility that linguistic convention may play some role in determining color category boundaries. We have seen that not all languages are “optimally” well-formed, and linguistic convention may be one force that can pull a particular language away from a perceptually optimal partitioning of color space. However, our results pose a direct challenge to the proposal that language is free to carve up color space in any conceivable manner as long as the resulting categories are connected. For the joint effect of the irregularity of color space and general principles of category formation appears to influence the placement of color categories across the world's languages. Thus, our results provide an explanation for both the connectedness of color categories and the particular positions in color space they tend to occupy while also allowing for the possibility of a certain amount of language-specific adjustment of these universal tendencies.
There is another possible reason why many languages do not match the theoretically optimal configurations. All of the optimal configurations were obtained by starting from a random assignment of category labels to chips. In contrast, the color-naming system of a given language has a history: It has evolved not from a random state, but rather from an earlier category system, usually one with exactly one fewer categories (1, 19). Thus, some languages may not approximate maxima in well-formedness as much as they do points on an evolutionary path leading from one maximum in well-formedness to another.
Acknowledgments
We thank Kimberly Jameson, Roy D'Andrade, and Susanne Gahl for comments on earlier drafts and Tony Belpaeme for discussion of some of the issues pursued here. This work was supported by National Science Foundation Grants 0418283 (to T.R.) and 0418404 (to P.K.).
Abbreviation
WCS
World Color Survey.
Note.
We have recently become aware of an independent formalization of Jameson and D'Andrade's proposal. N.L. Komarova, K.A. Jameson, and L. Narens (personal communication) explore Jameson and D'Andrade's proposal as a basis for the evolution of stable systems of color categories. Our goal of testing the idea against existing empirical data led us to a different formalization.
Footnotes
The authors declare no conflict of interest.
fIn this mode map, as in some others reported here, there are a few isolated chips for which the modal color term was one that was not widely used; these chips are therefore colored differently from most others in the array (e.g. here, the light-blue and brown chips in columns 4–10).
gCIEL*a*b* is a 3D space. The L* dimension corresponds to lightness, whereas the a* and b* dimensions define a plane orthogonal to L* such that the angle of a vector in that plane, rooted at the L* axis, corresponds to hue and the radius of such a vector corresponds to saturation. Despite this reference to polar coordinates in linking positions in the space to psychological quantities, the CIELAB distance metric is standard Euclidean distance. We converted our Munsell coordinates to CIELAB by using Wallkill Color Munsell conversion software, version 6.5.17, which assumes illuminant C, 2 degree standard observer.
hAlthough all simulations are based on distances in 3D CIELAB space, we display the results as overlays of the actual 2D stimulus palette, which is based on the Munsell system. We display our results this way because the palette is widely used as a reference frame in the literature on color naming and cognition.
iThe rotation is in Munsell coordinates, although our well-formedness calculations are in CIELAB. We chose to rotate in this manner because it is simple to convey the idea with these displays and because doing so does not affect the logic of our argument.
References
- 1.Berlin B, Kay P. Basic Color Terms: Their Universality and Evolution. Berkeley, CA: University of California Press; 1969. [Google Scholar]
- 2.Roberson D, Davies I, Davidoff J. J Exp Psychol Gen. 2000;129:369–398. doi: 10.1037//0096-3445.129.3.369. [DOI] [PubMed] [Google Scholar]
- 3.Roberson D, Davies IRL, Davidoff J. In: Theories, Technologies, Instrumentalities of Color: Anthropological and Historical Perspectives. Saunders B, van Brakel J, editors. Lanham, MD: Univ Press of Am; 2002. [Google Scholar]
- 4.Roberson D, Davidoff J, Davies IR, Shapiro LR. Cognit Psychol. 2005;50:378–411. doi: 10.1016/j.cogpsych.2004.10.001. [DOI] [PubMed] [Google Scholar]
- 5.Roberson D. Cross-Cult Res. 2005;39:56–71. [Google Scholar]
- 6.Kay P, Regier T. Proc Natl Acad Sci USA. 2003;100:9085–9089. doi: 10.1073/pnas.1532837100. [DOI] [PMC free article] [PubMed] [Google Scholar]
- 7.Regier T, Kay P, Cook R. Proc Natl Acad Sci USA. 2005;102:8386–8391. doi: 10.1073/pnas.0503281102. [DOI] [PMC free article] [PubMed] [Google Scholar]
- 8.Jameson KA, D'Andrade RG. In: Color Categories in Thought and Language. Hardin CL, Maffi L, editors. Cambridge, UK: Cambridge Univ Press; 1997. pp. 295–319. [Google Scholar]
- 9.Yendrikhovskij S. Color Res App. 2001;26:S235–S238. [Google Scholar]
- 10.Griffin LD. J R Soc Interface. 2006;3(6):71–85. doi: 10.1098/rsif.2005.0076. [DOI] [PMC free article] [PubMed] [Google Scholar]
- 11.Dowman M. Cognit Sci. 2007;31:1–34. doi: 10.1080/03640210709336986. [DOI] [PubMed] [Google Scholar]
- 12.Jameson KA. J Cognit Cult. 2005;5:293–347. [Google Scholar]
- 13.Jameson KA. Cross-Cult Res. 2005;39:159–204. [Google Scholar]
- 14.Garner WR. The Processing of Information and Structure. Potomac, MD: Erlbaum; 1974. [Google Scholar]
- 15.Liljencrants J, Lindblom B. Language. 1972;48:839–862. [Google Scholar]
- 16.Hespos S, Spelke E. Nature. 2004;430:453–456. doi: 10.1038/nature02634. [DOI] [PMC free article] [PubMed] [Google Scholar]
- 17.Regier T. Cognit Sci. 2005;29:819–865. doi: 10.1207/s15516709cog0000_31. [DOI] [PubMed] [Google Scholar]
- 18.Cook RS, Kay P, Regier T. In: Handbook of Categorization in Cognitive Science. Cohen H, Lefebvre C, editors. Amsterdam: Elsevier; 2005. pp. 223–242. [Google Scholar]
- 19.Kay P, Maffi L. Am Anthropol. 1999;101:743–760. [Google Scholar]
- 20.Kay P, Regier T. Cognition. 2007;102:289–298. doi: 10.1016/j.cognition.2005.12.008. [DOI] [PubMed] [Google Scholar]
- 21.Kay P. Cross-Cult Res. 2005;39:39–55. [Google Scholar]
- 22.Lindsey DT, Brown AM. Proc Natl Acad Sci USA. 2006;103:16608–16613. doi: 10.1073/pnas.0607708103. [DOI] [PMC free article] [PubMed] [Google Scholar]
- 23.Webster MA, Kay P. In: The Anthropology of Color. MacLaury RE, Paramei GV, Dedrick D, editors. Amsterdam: Benjamins; (in press) [Google Scholar]
- 24.Brainard DB. In: The Science of Color. Shevell SK, editor. New York: Elsevier; 2003. pp. 191–216. [Google Scholar]
- 25.Nosofsky R. J Exp Psychol Gen. 1986;115:39–57. doi: 10.1037//0096-3445.115.1.39. [DOI] [PubMed] [Google Scholar]
- 26.Hopfield JJ. Proc Natl Acad Sci USA. 1982;79:2554–2558. doi: 10.1073/pnas.79.8.2554. [DOI] [PMC free article] [PubMed] [Google Scholar]
