Type IIc Sodium–Dependent Phosphate Transporter Regulates Calcium Metabolism (original) (raw)
Abstract
Primary renal inorganic phosphate (Pi) wasting leads to hypophosphatemia, which is associated with skeletal mineralization defects. In humans, mutations in the gene encoding the type IIc sodium–dependent phosphate transporter lead to hereditary hypophophatemic rickets with hypercalciuria, but whether Pi wasting directly causes the bone disorder is unknown. Here, we generated Npt2c-null mice to define the contribution of Npt2c to Pi homeostasis and to bone abnormalities. Homozygous mutants (Npt2c−/−) exhibited hypercalcemia, hypercalciuria, and elevated plasma 1,25-dihydroxyvitamin D3 levels, but they did not develop hypophosphatemia, hyperphosphaturia, renal calcification, rickets, or osteomalacia. The increased levels of 1,25-dihydroxyvitamin D3 in Npt2c−/− mice compared with age-matched Npt2c+/+ mice may be the result of reduced catabolism, because we observed significantly reduced expression of renal 25-hydroxyvitamin D–24-hydroxylase mRNA but no change in 1α-hydroxylase mRNA levels. Enhanced intestinal absorption of calcium (Ca) contributed to the hypercalcemia and increased urinary Ca excretion. Furthermore, plasma levels of the phosphaturic protein fibroblast growth factor 23 were significantly decreased in Npt2c−/− mice. Sodium-dependent Pi co-transport at the renal brush border membrane, however, was not different among Npt2c+/+, Npt2c+/−, and Npt2c−/− mice. In summary, these data suggest that Npt2c maintains normal Ca metabolism, in part by modulating the vitamin D/fibroblast growth factor 23 axis.
Inorganic phosphate (Pi) is an essential nutrient in terms of both cellular metabolism and skeletal mineralization. The kidney is a major regulator of Pi homeostasis and can increase or decrease its Pi reabsorptive capacity to accommodate Pi needs. Up to 70% of filtered Pi is reabsorbed in the proximal tubule in which sodium (Na)-dependent Pi transport systems in the brush border membrane (BBM) mediated the rate-limiting step in the overall Pi reabsorptive process.1, 2 The type II Na/Pi co-transporter (Npt2a and Npt2c) is expressed in the BBM of the renal proximal tubular cells.2, 3 The type IIa Na/Pi co-transporters (Npt2a) play a major role in reabsorption (70 to 80%) in the kidney. Npt2a-knockout (KO) mice exhibit renal Pi wasting, loss of BBM Na/Pi co-transport, hypophosphatemia, and an appropriate adaptive increase in the serum concentration of 1,25-dihydroxyvitamin D3 [1,25(OH)2D3] with attendant hypercalcemia, hypercalciuria, and hypoparathyroidism but do not develop rickets.2, 4
Hereditary hypophosphatemic rickets with hypercalciuria (HHRH) is a rare autosomal recessive disorder characterized by hypophosphatemia, short stature, rickets and/or osteomalacia, and secondary absorptive hypercalciuria.5 Npt2a-KO mice display biochemical features similar to patients with HHRH; the bone phenotype is markedly different in the human and mouse disorders.2, 4 Jones et al.6 excluded mutations of the renal Na/Pi transporter NPT2 (human Npt2a) gene in affected members of the family that was originally described by Tieder and colleagues.7 More recently, linkage analyses have suggested that HHRH may arise from mutations in the NPT2c/SLC34A3 gene.8 That HHRH is caused by a loss-of-function mutation is compatible with HHRH phenotype and the prevailing view of renal phosphate regulation. These observations suggest that the Npt2c has an important role in renal Pi reabsorption and bone mineralization and that it may be a key determinant of plasma Pi concentrations in humans; however, it is not clear why loss of function of the less abundant and energetically less favorable electroneutral NaPi-IIc transporter causes rickets and osteomalacia in humans, whereas mutations in the more abundant electrogenic Npt2a elicits a mild skeletal phenotype that lacks the typical features of rickets and osteomalacia in mice. Thus, the goal of this study was to investigate the role of the Npt2c transporter in the overall maintenance of Pi homeostasis and bone mineralization by disrupting the murine Npt2c gene and analyzing the phenotypes.
RESULTS
Targeted Disruption of the Npt2c Gene
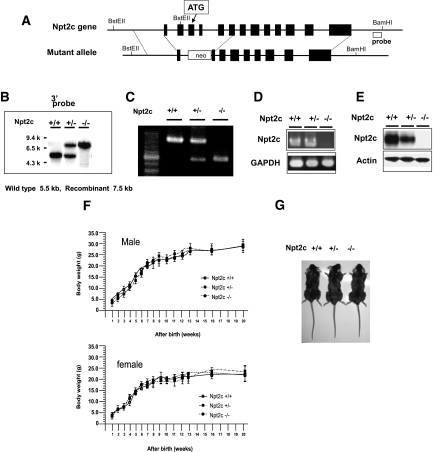
To generate Npt2c-null mice, we replaced Npt2c exons 3 through 5 with neomycin-resistant gene (neor; Figure 1A). We confirmed the mutant genotype by Southern blotting (Figure 1B) and PCR analysis (Figure 1C). Reverse transcriptase–PCR with Npt2c-specific primers confirmed the absence of detectable renal Npt2c in Npt2c−/− mice (Figure 1D). Western blot analysis of renal BBM proteins also demonstrated the absence of detectable Npt2c protein in Npt2c−/− mice (Figure 1E). Litters of mice showed Mendelian frequency, indicating the absence of prenatal lethality of homozygous animals. Male and female Npt2c−/− mice showed similar weight gain when compared with Npt2c+/+ and to Npt2c+/− mice (Figure 1F). Furthermore, Npt2c−/− and Npt2c+/− mice did not show significant differences in birth weight, body length, behavioral abnormalities, or mortality rate compared with Npt2c+/+ mice at all ages analyzed (Figure 1G).
Figure 1.
Establishment of Npt2c-null mice. (A) Wild-type allele (top) and targeted mutant allele (bottom). (B) Genomic Southern blot analysis. Genomic DNA (5 μg) isolated from transfected ES clones were digested with BstEII and BamHI and hybridized to the indicated (A) probe. (C) PCR analysis of mouse tail genomic DNA from Npt2c+/+, Npt2c+/−, and Npt2c−/− mice. (D and E) Expression of Npt2c in Npt2c+/+, Npt2c+/−, and Npt2c−/− mice. Reverse transcriptase–PCR (D) and Western blotting (E) analysis in the kidney of mice. (D) Aliquots of each PCR product were electrophoresed on a 1.5% agarose gel. Glyceraldehyde-3-phosphate dehydrogenase (GAPDH) was used as the internal control. (E) Western blotting analysis of BBMV isolated from the kidney of Npt2c+/+, Npt2c+/−, and Npt2c−/− mice. Each lane was loaded with 20 μg of BBMV. Actin was used as the internal control. (f) Growth curves for Npt2c+/+, Npt2c+/−, and Npt2c−/− mice. Each point represents the mean ± SD derived from four to 15 measurements. (G) 9-wk-old Npt2c+/+, Npt2c+/−, and Npt2c−/− male mice.
Characterization of the Npt2c Mutant Mice
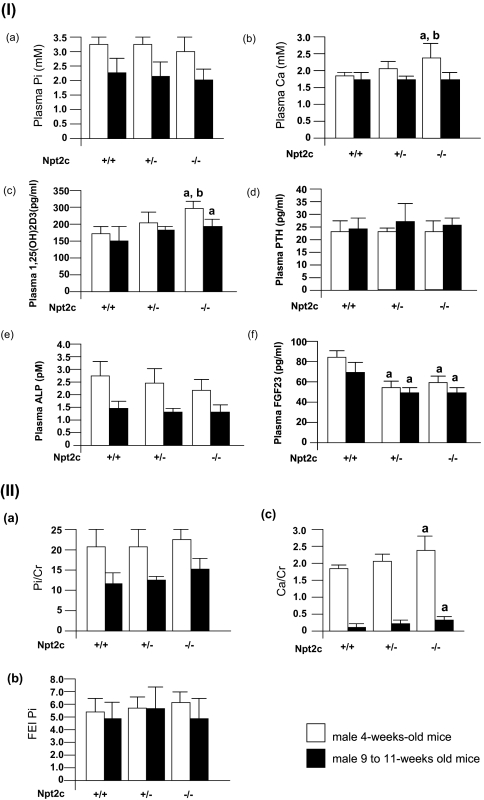
Plasma Pi levels were similar when comparing the Npt2c−/−, Npt2c+/−, and Npt2c+/+ mice at ages ranging from 2 to 50 wk. Data points at 4 wk of age and from 9 to 11 wk of age are illustrated in Figure 2IA. Plasma Ca concentration was significantly higher in Npt2c−/− mice than in the wild-type or heterozygous mice at 4 wk of age (Figure 2IB); however, there was no difference in plasma Ca concentrations at 9 to 11 wk of age when comparing all mice groups (Figure 2IB). Furthermore, plasma 1,25(OH)2D3 levels were significantly higher in the Npt2c−/− mice than in the wild-type or heterozygous mice. There were no differences in plasma parathyroid hormone (PTH) and alkaline phosphatase (ALP) levels when comparing all mouse groups (Figure 2I, C through E). Plasma fibroblast growth factor 23 (FGF-23) levels were markedly decreased in Npt2c+/− and Npt2c−/− mice when compared with Npt2c+/+ mice (Figure 2IF).
Figure 2.
Characteristics of Npt2c-KO mice. (I) Plasma parameters. (A through F) Plasma Pi (A), Ca (B), 1,25(OH)2D3 (C), PTH (D), ALP (E), and FGF-23 (F). □, Male 4-wk-old mice (n = 7 to 11); ▪, male 9- to 11-wk-old mice (n = 15 to 19). Data are means ± SD. a_P_ < 0.05 versus Npt2c+/+ mice, b_P_ < 0.05 versus Npt2c+/− mice. (II) Urine parameter. Metabolic cages were used for 24-h urine collection from Npt2c+/+, Npt2c +/−, and Npt2c −/− mice (n = 6 to 8, respectively). (A through C) Urinary Pi/urine creatinine (A), fractional excretion index for Pi (FEI Pi; B), and urinary Ca/urine creatinine (C). Data are means ± SD a_P_ < 0.05 versus Npt2+/+ mice.
Urine Pi to creatinine ratio (Pi/Cr) and the fractional index for Pi were slightly but not significantly increased in Npt2c−/− mice when compared with Npt2c+/+ and Npt2c+/− mice (Figure 2II, A and B); however, the urine Ca to Cr ratio (Ca/Cr) was significantly higher in Npt2c−/− mice than in Npt2c+/+ and Npt2c+/− mice (Figure 2IIC). Urinary Na/Cr, Cl/Cr, and K/Cr ratios were similar for Npt2c+/+ and Npt2c−/− mice (data not shown).
Renal Npt2a and Renal Pi Transport Activity in Npt2c−/− Mice
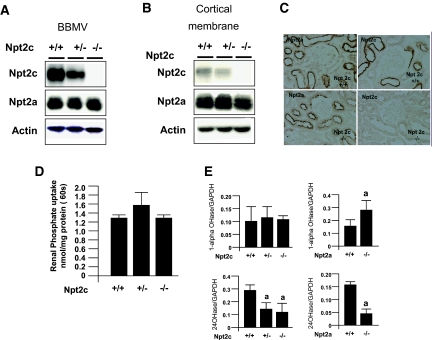
Western blotting analysis (Figure 3, A and B) showed absence of Npt2c protein in either renal BBM vesicles (BBMV) or cortical membranes prepared from Npt2c−/− mice (Figure 3, A and B, top). Renal Npt2a protein levels were similar among Npt2c−/−, Npt2c+/−, and Npt2c+/+ mice (Figure 3, A and B, middle). Similar data were generated by immunohistochemical analyses (Figure 3C).
Figure 3.
Expression of Npt2a and renal Na+-dependent Pi transport activity in Npt2c-KO mice. (A and B) Western blotting analysis of renal BBMV (A) and cortical membranes (B) isolated from the kidney of Npt2c+/+, Npt2c +/−, and Npt2c −/− mice (9 wk old). Each lane was loaded with 20 μg of BBMV or 30 μg of cortical membranes. Actin was used as internal the control (n = 3 to 5); experiments were performed in triplicate. (C) Immunohistochemical detection of renal Npt2a and Npt2c proteins in Npt2c+/+ and Npt2c −/− mice. (D) Renal Na+-dependent Pi transport activity in Npt2c+/+, Npt2c+/−, and Npt2c−/− mice. Data are means ± SD; n = 3 to 5. (E) 1-αOHase and 24OHase mRNA levels in the kidney of Npt2-null mice, as assessed by quantitative PCR. GAPDH was used as the internal control. Data are mean ± SD; n = 4 to 5. a_P_ < 0.05 versus wild-type mice. Magnification, ×400.
Furthermore, Na+-dependent Pi transport activity was similar when comparing Npt2c−/−, Npt2c+/−, and Npt2c+/+ mice (Figure 3D). 25-Hydroxyvitamin D–24-hydroxylase (CYP24/24OHase) mRNA levels were significantly decreased in Npt2c−/− mice when compared with age-matched Npt2c+/+ littermates, whereas 1-α-hydroxylase mRNA levels were unchanged when compared with age-matched Npt2c+/+ mice (Figure 3E). By contrast, 1-αOHase mRNA levels were significantly increased and 24OHase mRNA levels were decreased in Npt2a−/− mice when compared with in Npt2a+/+ mice, as described previously (Figure 3E).9
Renal Stone Formation in Npt2a−/− and Npt2c−/− Mice
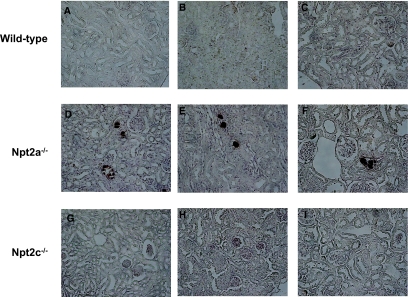
Von Kossa staining of renal sections demonstrated the presence of mineral deposits in their kidneys of Npt2a−/− mice, as described previously9; however, there were no Ca deposits in the kidney of Npt2c−/− mice of any age (Figure 4).
Figure 4.
Renal calcification in the kidney of Npt2a- and Npt2c-KO mice. Von Kossa staining of renal sections from Npt2a−/− and Npt2c−/− mice. Renal sections prepared from paraffin-embedded kidneys of 4-wk-, 9-wk-, and 1-yr-old mice. Counterstaining with hematoxylin is shown. Mineral deposits; black arrows. Magnification, ×200.
Effect of Fasting on Plasma Ca and Urinary Ca Excretion
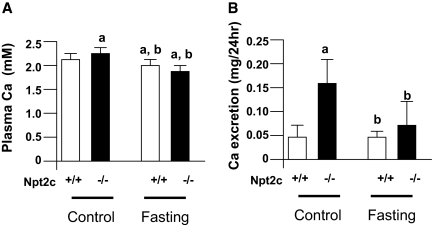
In Npt2a−/− mice, the hyperabsorption of dietary Ca contributes to the hypercalcemia and hypercalciuria.10 To determine whether the hypercalciuria in Npt2c−/− mice is dependent on dietary Ca intake, we examined the effect of fasting on plasma Ca concentration and urinary Ca excretion (Figure 5). Under control conditions, the levels of plasma Ca concentration and urinary Ca excretion were significantly increased in Npt2c−/− mice compared with Npt2c+/+ mice at 4 wk of age (Figures 2IIB and 5). The levels of plasma Ca but not Ca excretion were significantly decreased after fasting in Npt2c+/+ mice (Figure 5). In contrast, in Npt2c−/− mice, both plasma Ca concentration and urinary Ca excretion were significantly decreased after fasting (Figure 5). There were no differences in either parameter between Npt2c+/− mice and Npt2c+/+ mice in the control and fasting conditions (data not shown).
Figure 5.
Effect of fasting on serum Ca and urine Ca excretion in Npt2c+/+ and Npt2c−/− mice. Npt2c**+/+** and Npt2c−/− mice (4 wk old) were deprived of food but not water for 24 h. At the end of this period, urine and blood samples were collected for measurement of serum and urine Ca excretion. (A) Plasma Ca concentration (mM). (B) Urinary Ca excretion. Data are means ± SD; n = 9. a_P_ < 0.05 versus Npt2c+/+ mice under control conditions; b_P_ < 0.05 versus Npt2c−/− mice under control conditions.
Effect of Npt2c Gene Disruption on Intestinal and Renal TRPV5, TRPV6, CalbindinD9K, and CalbindinD28K mRNA Levels
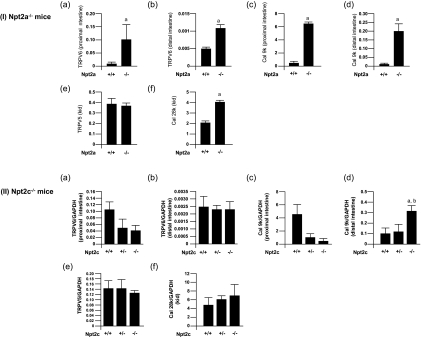
The levels of intestinal TRPV6 and calbindinD9k mRNA were significantly increased in Npt2a−/− mice when compared with Npt2a+/+ mice, as described previously (Figure 6I, A through D).10 In the kidney, the levels of calbindinD28K mRNA were significantly increased in Npt2a−/− mice compared with Npt2a+/+ mice, but there was no differences in renal TRPV5 mRNA between Npt2a−/− mice and Npt2a+/+ mice (Figure 6I, E and F).10 TRPV6 mRNA levels were slightly but not significantly decreased in the proximal and distal intestine of Npt2c+/− and Npt2c−/− mice when compared with Npt2c+/+ mice (Figure 6II, A and B).
Figure 6.
Effect of Npt2a or Npt2c gene disruption on Ca transport gene, as assessed by quantitative PCR. GAPDH was used as the internal control. (I) Npt2a+/+ and Npt2a−/− mice (9 to 11 wk old). (II) Npt2c+/+, Npt2c+/−, and Npt2c−/− mice (9 to 11 wk old). Data are means ± SD; n = 4 to 5. a_P_ < 0.05 versus Npt2c+/+ or Npt2c+/+ mice; b_P_ < 0.05 versus Npt2c+/− mice.
CalbindinD9k mRNA was decreased in the proximal intestine of Npt2c−/− mice compared with Npt2a+/+ mice (Figure 6IIC). Furthermore, calbindinD9k mRNA level was significantly increased in the distal intestine of Npt2c−/− mice compared with Npt2 mice (Figure 6IID). In the kidney, there were no differences in renal TRPV5 and calbindinD28k mRNA levels between Npt2c−/− mice and Npt2c+/+ mice (Figure 6II, E and F).
Skeletal Phenotypes of Npt2c−/− Mice
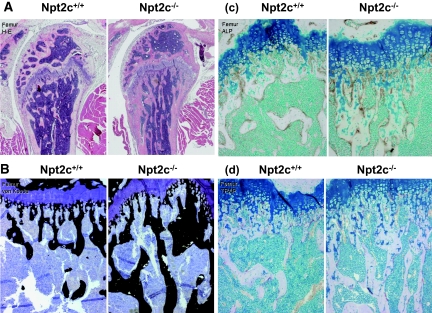
Histologic examination of bone samples from 9-wk-old Npt2c−/− mice failed to identify typical features of advanced rickets (Figure 7). Npt2c−/− mice showed epiphyseal growth plates with widths similar to those of Npt2c+/+ littermates (Figure 7). The metaphyseal trabecular and cortical bones of Npt2c−/− mice were found to be well mineralized by von Kossa staining (Figure 7B). The number and distribution patterns of ALP-positive osteoblasts and tartrate-resistant acid phosphatase–positive osteoclasts lining bone surfaces in the metaphyseal trabecules did not differ between Npt2c−/− and Npt2c+/+ mice (Figure 7, C and D).
Figure 7.
Histologic analysis of longitudinal femoral sections form 9-wk-old Npt2c+/+ and Npt2c−/− mice. (A through D) Hematoxylin/eosin (H-E) staining (A), von Kossa staining (B), ALP immunoreactivity detected by staining with antibody against ALP (C), and tartrate-resistant acid phosphatase (TRAP) staining (D).
Renal Npt2a protein levels increased postnatally and showed no change after weaning (Supplemental Figure 1). In contrast, Npt2c protein levels peaked by day 28 of life and were markedly decreased by day 60 (Supplemental Figure 1). Bone samples from 3- to 4-wk-old Npt2c-null mice failed to show features typical of advanced rickets (Supplemental Figure 1).
Furthermore, when comparing Npt2c+/+ mice at 9 wk of age, all bone histomorphometry parameters of Npt2c−/− mice were found to be similar (Table 1). In 1-yr-old mice, no histomorphometric abnormalities were observed in the bones of wild-type or Npt2c−/− mice (data not shown).
Table 1.
Results of bone histomorphometry in 9-wk-old micea
| Parameter | Npt2c+/+ (n = 6) | Npt2c+/− (n = 6) | Npt2c−/− (n = 7) |
|---|---|---|---|
| Tissue area (mm2) | 1.78 ± 0.19 | 1.75 ± 0.15 | 1.83 ± 0.10 |
| BV/TV (%) | 10.00 ± 1.34 | 10.19 ± 4.35 | 10.65 ± 3.81 |
| Tb. (μm) | 28.71 ± 1.55 | 27.95 ± 6.70 | 28.21 ± 5.76 |
| Tb.N/mm | 3.48 ± 0.42 | 3.53 ± 0.70 | 3.71 ± 0.70 |
| Tb.Sp (μm) | 261.60 ± 34.66 | 248.33 ± 66.98 | 248.96 ± 62.49 |
| OV/BV (%) | 6.23 ± 2.13 | 6.61 ± 2.34 | 7.32 ± 3.37 |
| OS/BS (%) | 25.92 ± 4.94 | 25.77 ± 4.49 | 26.12 ± 6.36 |
| O.Th (μm) | 3.59 ± 0.08 | 3.79 ± 0.08 | 3.89 ± 0.13 |
| Ob.S/BS (%) | 15.66 ± 0.05 | 14.48 ± 0.67 | 15.29 ± 1.56 |
| ES/BS (%) | 3.85 ± 1.23 | 3.80 ± 1.06 | 3.26 ± 1.14 |
| N.Oc/B.Pm/100 mm | 195.18 ± 16.04 | 200.63 ± 16.91 | 204.31 ± 59.44 |
| Oc.S/BS (%) | 1.58 ± 0.73 | 1.35 ± 0.18 | 1.47 ± 0.80 |
| MAR/d | 1.35 ± 0.23 | 1.38 ± 0.14 | 1.49 ± 0.22 |
| MS/BS (%) | 24.03 ± 3.17 | 23.43 ± 3.45 | 22.73 ± 0.74 |
| BFR/BS (mm3/cm2 per yr) | 13.92 ± 0.32 | 10.44 ± 1.87 | 11.86 ± 2.60 |
Immunohistochemical Studies of the Bone from Npt2c−/− Mice
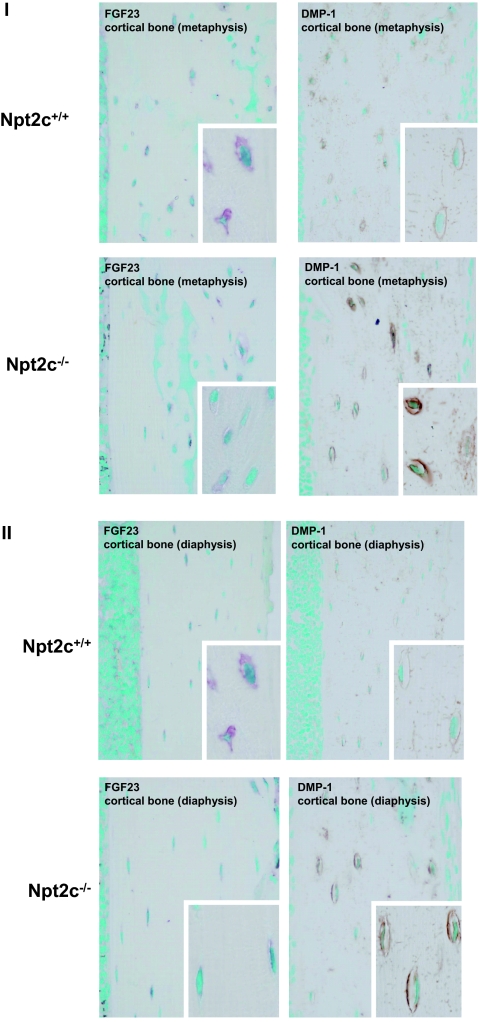
FGF-23 immunopositivity was decreased in the cortical bone of Npt2c−/− mice compared with Npt2c+/+ mice (Figure 8). In contrast, Npt2c−/− mice showed intense dentin matrix protein 1 (DMP-1) immunopositivity (Figure 8); however, there were no differences of FGF-23 and DMP-1 mRNA in the bone of Npt2c+/+ and Npt2c−/− mice (data not shown).
Figure 8.
Expression of immunoreactivity for FGF-23 and DMP-1 in the cortical bone of 9-wk-old Npt2c+/+ and Npt2c−/− mice. (I) cortical bone (metaphysis). (II) Cortical bone (diaphysis). Magnifications: ×400; ×1200 in insets.
DISCUSSION
Dysfunction of the type IIc transporter protein in patients with HHRH results in severe Pi-wasting and hypophosphatemic rickets.7, 8, 11, 12 Nucleotide sequence analysis revealed a homozygous single-nucleotide deletion (c.228delC) in the candidate gene (SLC34A3/NPT2c) in all individuals affected by HHRH in the family originally described by Tieder et al.7 This mutation is predicted to truncate the NPT2c protein in the first membrane-spanning domain and, thus, likely results in a complete loss of function of this protein in individuals homozygous for c.288delC.7 Unrelated patients with HHRH have other homozygous or compound heterozygous NPT2c mutations.7, 8, 11 This study demonstrated that Npt2c-null mice developed hypercalciuria and hypercalcemia but not hypophosphatemia, rickets, or osteomalacia. Although the hypercalciuria of Npt2c−/− mice is similar to that observed in patients with HHRH, plasma Pi levels and bone phenotypes were clearly different. Renal Na/Pi co-transport activity in Npt2c−/− mice was not significantly changed when compared with that in wild-type mice. Urinary Pi excretion was not significantly increased in Npt2c−/− mice compared with Npt2c+/+ mice. In fact, Npt2c plays a minor role in renal Pi reabsorption, and it is thought that Npt2a can sufficiently support Na/Pi transport activity to compensate for deficiencies in Npt2c-KO mice.
Although the absence of hypophosphatemia in Npt2c−/− mice can be predicted on the basis of these observations, the reason for the increase in 1,25(OH)2D3 remains unclear. Plasma Pi level regulates vitamin D activation in the kidney, and plasma 1,25(OH)2D3 levels are increased in Npt2a−/− mice. The levels of 1-αOHase mRNA levels were significantly increased and 24OHase mRNA levels were decreased in the kidney of Npt2a−/− mice.
Npt2c−/− mice showed elevations in plasma 1,25(OH)2D3 levels and high plasma Ca at 4 wk of age. This may be dueto the reduction of 24OHase mRNA levels, because 1,25(OH)2D3 is catabolized by 24OHase in the kidney but not induction of 1-αOHase mRNA. These results suggest that Npt2a may act in concert with Npt2c to regulate renal Na/Pi co-transport activity but that Npt2a cannot substitute for Npt2c function in terms of regulating vitamin D metabolism.
The marked differences in phenotypes of the Npt2a- and Npt2c-KO mice may result from the differential dominance in transporters for Pi homeostasis. Npt2c-KO mice showed hypercalciuria and high levels of plasma 1,25(OH)2D3 but not hypophosphatemia and hyperphosphaturia. Consistent with these findings, Na+-dependent Pi transport activity in BBMV was not significantly decreased in Npt2c-null mice. In contrast, Npt2a-KO mice show hypophosphatemia and reduction of renal Na+-dependent Pi transport activity. Moreover, Npt2c protein level is increased in renal BBMV of Npt2a-null mice, but the converse does not occur in Npt2c-null animals; therefore, we speculate that Npt2c may be involved in the Ca/vitamin D system and be linked in a minor way to Na+-dependent Pi transport in the renal proximal tubule of mice.
Furthermore, plasma levels of FGF-23 concentration and immunoreactive signals of FGF-23 protein in the osteocyte of Npt2c−/− mice were decreased compared with Npt2c+/+ mice. Recent studies suggested that DMP-1 may regulate bone FGF-23 production.13, 14 DMP-1–null mice were used to demonstrate that the absence of DMP-1 results in defective osteocyte maturation and increased FGF-23 expression.14 Inactivating mutations of DMP-1 in patients with autosomal recessive hypophosphatemia leads to elevation of plasma FGF-23 concentration.13, 14 Immunoreactive signals of DMP-1 were increased in the osteocyte of Npt2c−/− mice. It is not clear why the disruption of Npt2c induces the expression of DMP-1 protein in the bone. One possibility is that extrarenal expression of Npt2c may be related to bone physiology, including the expression of DMP-1 or FGF-23. Although Npt2c mRNA could be detected in bone tissue of mice, Npt2c immunoreactive signals could not be detected in the osteocytes of wild-type mice (data not shown). Whether Npt2c plays a role in FGF-23 production in osteocytes needs to be clarified.
Npt2a-KO mice showed elevated plasma 1,25(OH)2D3 level and reduced plasma FGF-23 level compared with wild-type mice. Similar observations were made in Npt2c-KO mice; however, induction of plasma 1,25(OH)2D3 and reduction of plasma FGF-23 levels were greater in Npt2a-KO mice than in Npt2c-KO mice.
After fasting, the level of plasma Ca and urinary Ca excretion was significantly decreased in both Npt2a−/− and Npt2c−/− mice. Hypercalcemia and hypercalciuria in Npt2a−/− mice were due to induction of intestinal Ca absorption via transcellular transport (TRPV6 and calbindinD9k).10 In contrast, the level of intestinal TRPV6 and calbindinD9k mRNA was not increased in Npt2c−/− mice. The mechanisms causing elevation of intestinal Ca absorption in Npt2c−/− mice may differ from those in Npt2a−/− mice.
It is not clear why mutations in the Npt2c gene produce different phenotypes in humans (NPT2c) and mice (Npt2c). One possibility is that NPT2c function predominates in humans, whereas Npt2a function predominates in mice. Indeed, renal brush border Na+-dependent Pi transport activity is low in humans compared with that in mice and rats.15 Another possible explanation for this phenomenon is that NPT2c is involved in bone mineralization. It is possible that mouse models of a large number of human diseases will not yield sufficiently accurate information, although they might contribute to the overall knowledge of Npt2a biology in mice and humans. Further studies of humans and rodents are also needed to clarify the role of Npt2c in Pi metabolism.2, 4, 16, 17
In conclusion, Npt2c-KO mice exhibit hypercalcemia, hypercalciuria, and elevation of plasma 1,25-(OH)2D3 levels but not hypophosphatemia, renal calcification, rickets, or osteomalacia. These findings suggest that Npt2c is necessary for normal Ca metabolism but that the Pi metabolism and bone physiology of Npt2c-KO mice are different from those in patients with HHRH.
CONCISE METHODS
Mice
Male C57BL/6 mice were purchased from Charles River Laboratories Japan (Yokohama, Japan). Male and female Npt2a−/− mice were purchased from the Jackson Laboratory (Bar Harbor, ME). Mice were maintained under pathogen-free conditions and handled in accordance with the Guidelines for Animal Experimentation of the Tokushima University School of Medicine.
Generation of Npt2c−/− Mice
Npt2c-deficient mice were generated by gene targeting. Briefly, a targeting vector was constructed by replacing the 129 genomic Npt2c locus (exons 3 through 5) with the _neo_r (Figure 1A). The targeting vector was introduced into 129 day 14 embryonic stem (ES) cells by electroporation, and clones that had undergone homologous recombination were confirmed by Southern blot analysis. Southern blot analysis demonstrated homologous recombination in ES cell clones, generating a 7.5-kb BstEII and BamHI fragment from the targeted allele and a 5.5-kb fragment from the normal allele (Figure 1B). By Southern blot analysis, two of 150 neomycin-resistant ES cell clones were detected. After the targeted cells were injected into C57BL/6 blastocysts, the resulting chimeric male mice were mated with C57BL/6 female mice to establish germline transmission. The N1 heterozygotes were backcrossed five more times into the C57BL/6 background. The heterozygous N6 offspring were subsequently used to obtain mice that were homozygous for the targeted Npt2c gene mutation.
Genotyping
Mice were genotyped by Southern blot analysis and PCR amplification of genomic DNA. Genomic DNA was digested with BstEII and BamHI and analyzed by Southern blot hybridization using a probe (Figure 1A). Expressed sizes of fragments for the normal and disrupted alleles were 5.5 and 7.5 kb, respectively (Figure 1B). PCR typing of genomic DNA was performed by using TaKaRa Ex Taq (Takara Bio, Ohtsu, Japan) and three primers: Sense primer 1 (5′-ctcaccatacatgcag-3′) in exon 1, antisense primer 2 (5′-ctgcatttctcagactccgg-3′) in exon 3, and antisense primer 3 (5′-cggtatcgccgctcccgatc-3′) in the neo-resistance gene cassette (Figure 1A). Expressed sizes of amplified fragments were 5.5 kb for the normal allele (primers 1 and 2) and 7.5 kb for the disrupted allele (primers 1 and 3; Figure 1C). For the genotyping of Npt2a−/−, three PCR primers were used as described previously.4
Plasm and Urine Parameters
Concentrations of plasma and urinary inorganic Ca and Pi were determined by the Calcium-E test (Wako, Osaka, Japan) and the Phospha-C test (Wako), respectively.18 Concentration of urinary Cr was determined by the Creatinine-Wako test (Wako). Concentrations of plasma PTH were determined using the PTH ELISA kit (Immunotopics Inc., San Clemente, CA).18 Concentrations of plasma 1,25(OH)2D3 were determined by the radioreceptor assay (SRL, Inc., Tokyo, Japan). Concentrations of plasma FGF-23 protein were determined using the FGF-23 ELISA kit (Kainos Laboratories, Inc., Tokyo, Japan).18 Metabolic cages were used for 24-h urine collection from mice. The fractional excretion index for Pi was calculated as urine Pi/(urine creatinine × plasma Pi).4
RNA Analysis
Total RNA was extracted from mouse tissues using ISOGEN (Nippon Gene, Tokyo, Japan). cDNA was synthesized using the Moloney murine leukemia virus, reverse transcriptase (Superscript, Invitrogen, Carlsbad, CA), and oligo(dT) 12 to 18 primer. The PCR reactions were initiated with denaturation at 95°C for 3 min, followed by amplification at 95°C for 30 s, 58°C for 30 s, and 72°C for 30 s for 35 cycles. PCR primer sequences were as follows: Npt2a, 5′-gaggagcaaaagccagag-3′ and 5′-agggagcagacaaagagg-3′; Npt2c, 5′-aaggacaatgtggtgctgtc-3′ and 5′-accatgctgaccacgatagag-3′; and glyceraldehyde-3-phosphate dehydrogenase, 5′-ctgcaccaccactgcttagc-3′ and 5′-catccacagtcttctgggtg-3′.
Quantitative PCR
Quantitative PCR was performed using ABI PRISM 7500 (Applied Biosystems, Foster City, CA). The reaction mixture consisted of 10 μl of SYBR Premix Ex Taq (Perfect Real Time; Takara Bio) with specific primers. The PCR reactions were initiated with denaturation at 95°C for 10 s, followed by amplification with 50 cycles at 95°C for 10 s, annealing at 60°C for 15 s, and 72°C for 15 s. Data were evaluated with SDS 1.2.X with RQ software.
PCR primer sequences were as follows: 1αOHase, 5′-gagcaagctccaggaagcag-3′ and 5′-tgaggaatgatcaggagagg-3′; 24OHase, 5′-tgggaagatgatggtgaccc-3′ and 5′-tcgaygcagggcyygacyg-3′; TRPV5, 5′-gttggttcttacgggttgaac-3′ and 5′-ctgctcttgtacttcttcctc-3′; TRPV6, 5′-atcgatggccctgcggaact-3′ and 5′-aggaggttaagcatgagcag-3′; calbindinD9k, 5′-cctgcagaaatgaagagcatttt-3′ and 5′-ctccatcgccattcttatcca-3′; calbindinD28k, 5′-aactgacagagatggccagg-3′ and 5′-tatccgttgccatcctgatc-3′; and glyceraldehyde-3-phosphate dehydrogenase, 5′-ctgcaccaccaacygcyyagca-3′ and 5′-ctccatcgccattcttatcca-3′.
Preparation of Membrane Fraction and Transport Assay
BBMV were prepared from mouse kidney using the Ca2+ precipitation method, as described previously.19, 20 The precipitation of cortical membrane was also performed as previous described.21 The homogenate of the tissue in 0.3 M sucrose containing protease inhibitor cocktail tablets (Complete Mini, EDTA-free; Roche Diagnostics, Indianapolis, IN) was centrifuged at 600 × g for 10 min. The supernatant was then centrifuged at 105,000 × g for 45 min, and the membrane pellet was used for Western blotting. BBMV 32P uptake was measured by the rapid filtration technique as described previously.19
Immunoblotting
Protein samples were heated at 95°C for 5 min in sample buffer in the presence of 5% 2-mercaptoethanol and subsequently subjected to 8% SDS-PAGE. The separated proteins were transferred by electrophoresis to a polyvinylidene difluoride transfer membrane (Immobilon-P; Millipore Corp., Billerica, MA). The membrane was treated with diluted rabbit affinity-purified anti-Npt2a (1:4000) or anti-Npt2c (1:500) antibodies or with mouse affinity-purified anti-actin (1:5000; Chemicon, Temecula, CA), as used for internal control, followed by treatment with horseradish peroxidase (HRP)-conjugated anti-rabbit or mouse IgG (Jackson ImmunoResearch Laboratories, West Grove, PA). Signals were detected using the Immobilon Western Chemiluminescent HRP Substrate (Millipore Corp.).
Immunohistochemical Analysis
Immunohistochemical analysis of mouse kidney sections was performed as described previously with minor modifications.19, 21 For immunostaining, serial sections (5 μm) were incubated with affinity-purified Npt2a antibodies (1:1000) and Npt2c antibodies (1:1000). Sections were then treated with Envision (+) rabbit peroxidase (Dako, Carpinteria, CA) for 30 min at room temperature. Immunoreactivity was detected by treatment with diaminobenzidine (0.8 mM).
Von Kossa Staining
Von Kossa staining for mineral deposit was performed by the application of 5% silver nitrate to the renal sections and exposure to bright light for 30 min.9 Sections were counterstained for tissue and cell morphology using hematoxylin for paraffin sections.
Bone Analysis
Immunohistochemical analysis of mouse bone sections was performed as described previously.22 Briefly, sections were immersed into 0.3% H2O2 in methanol for 30 min to block endogenous peroxidase. For reducing nonspecific binding, 1% BSA (Serologicals Proteins Inc., Kankakee, IL) in PBS (1% BSA-PBS) was applied on the sections for 20 min. Sections were then incubated with antibodies against ALP,23 DMP-1 (Takara Bio), and FGF-23 (R&D Systems, McKinley Place, NE) with 1% BSA-PBS at room temperature for 2 h and, after several washings in PBS, further incubated with HRP- or ALP-conjugated secondary antibodies (Chemicon International) for l h. For visualizing the immunoreaction, diaminobenzidine tetrahydrochloride or naphthol AS-BI was used as a substrate.
For tartrate-resistant acid phosphatase detection, sections were incubated in a mixture of 8 mg of naphthol AS-BI phosphate (Sigma, St. Louis, MO), 70 mg of red violet LB salt (Sigma), and 50 mM L(+) tartaric acid (0.76 g; Nacalai Tesque, Kyoto, Japan) diluted in 60 ml of a 0.1 M sodium acetate buffer (pH 5.0) for 20 min at 37°C. Methyl green was used for counterstaining in all sections. For bone histomorphometry, all mice were administered an injection of calcein (8 mg/kg body wt; Wako).24, 25
Statistical Analysis
Data are expressed as means ± SD. Differences among multiple groups were analyzed by ANOVA. P < 0.05 was considered to represent statistical significance.
DISCLOSURES
None.
Supplementary Material
[Supplemental Data]
Acknowledgments
This work was supported by grants from the Ministry of Education, Culture, Sports, Science and Technology of Japan (19790585 to H.S. and 11557202 to K.M.) and the 21st Century COE Program, Human Nutritional Science on Stress Control (Tokushima, Japan).
We are grateful to Yoshiko Shimada, Yukiko Sawai, and Rieko Tominaga for technical assistance and to Dr. Atsuko Mizuno (Jichi Medical University), Dr. Naoshi Horiba (Chugai Pharmaceutical Co., Ltd.), and Dr. Hideyuki Yamato (Kureha Special Laboratory Co., Ltd.) for technical advice.
Published online ahead of print. Publication date available at www.jasn.org.
Supplemental information for this article is available online at http://www.jasn.org/.
References
- 1.Murer H, Hernando N, Forster I, Biber J: Proximal tubular phosphate reabsorption: Molecular mechanisms. Physiol Rev 80: 1373–1409, 2000 [DOI] [PubMed] [Google Scholar]
- 2.Tenenhouse HS: Regulation of phosphorus homeostasis by the type IIa na/phosphate cotransporter. Annu Rev Nutr 25: 197–214, 2005 [DOI] [PubMed] [Google Scholar]
- 3.Miyamoto K, Ito M, Tatsumi S, Kuwahata M, Segawa H: New aspect of renal phosphate reabsorption: The type IIc sodium-dependent phosphate transporter. Am J Nephrol 27: 503–515, 2007 [DOI] [PubMed] [Google Scholar]
- 4.Beck L, Karaplis AC, Amizuka N, Hewson AS, Ozawa H, Tenenhouse HS: Targeted inactivation of Npt2 in mice leads to severe renal phosphate wasting, hypercalciuria, and skeletal abnormalities. Proc Natl Acad Sci U S A 95: 5372–5377, 1998 [DOI] [PMC free article] [PubMed] [Google Scholar]
- 5.Tenenhouse HS: Phosphate transport: Molecular basis, regulation and pathophysiology. J Steroid Biochem Mol Biol 103: 572–577, 2007 [DOI] [PubMed] [Google Scholar]
- 6.Jones A, Tzenova J, Frappier D, Crumley M, Roslin N, Kos C, Tieder M, Langman C, Proesmans W, Carpenter T, Rice A, Anderson D, Morgan K, Fujiwara T, Tenenhouse H: Hereditary hypophosphatemic rickets with hypercalciuria is not caused by mutations in the Na/Pi cotransporter NPT2 gene. J Am Soc Nephrol 12: 507–514, 2001 [DOI] [PubMed] [Google Scholar]
- 7.Bergwitz C, Roslin NM, Tieder M, Loredo-Osti JC, Bastepe M, Abu-Zahra H, Frappier D, Burkett K, Carpenter TO, Anderson D, Garabedian M, Sermet I, Fujiwara TM, Morgan K, Tenenhouse HS, Juppner H: SLC34A3 mutations in patients with hereditary hypophosphatemic rickets with hypercalciuria predict a key role for the sodium-phosphate cotransporter NaPi-IIc in maintaining phosphate homeostasis. Am J Hum Genet 78: 179–192, 2006 [DOI] [PMC free article] [PubMed] [Google Scholar]
- 8.Lorenz-Depiereux B, Benet-Pages A, Eckstein G, Tenenbaum-Rakover Y, Wagenstaller J, Tiosano D, Gershoni-Baruch R, Albers N, Lichtner P, Schnabel D, Hochberg Z, Strom TM: Hereditary hypophosphatemic rickets with hypercalciuria is caused by mutations in the sodium-phosphate cotransporter gene SLC34A3. Am J Hum Genet 78: 193–201, 2006 [DOI] [PMC free article] [PubMed] [Google Scholar]
- 9.Chau H, El-Maadawy S, McKee MD, Tenenhouse HS: Renal calcification in mice homozygous for the disrupted type IIa Na/Pi cotransporter gene Npt2. J Bone Miner Res 18: 644–657, 2003 [DOI] [PubMed] [Google Scholar]
- 10.Tenenhouse HS, Gauthier C, Martel J, Hoenderop JG, Hartog A, Meyer MH, Meyer RA Jr, Bindels RJ: Na/P(i) cotransporter (Npt2) gene disruption increases duodenal calcium absorption and expression of epithelial calcium channels 1 and 2. Pflugers Arch 444: 670–676, 2002 [DOI] [PubMed] [Google Scholar]
- 11.Ichikawa S, Sorenson AH, Imel EA, Friedman NE, Gertner JM, Econs MJ: Intronic deletions in the SLC34A3 gene cause hereditary hypophosphatemic rickets with hypercalciuria. J Clin Endocrinol Metab 91: 4022–4027, 2006 [DOI] [PubMed] [Google Scholar]
- 12.Yamamoto T, Michigami T, Aranami F, Segawa H, Yoh K, Nakajima S, Miyamoto K, Ozono K: Hereditary hypophosphatemic rickets with hypercalciuria: A study for the phosphate transporter gene type IIc and osteoblastic function. J Bone Miner Metab 25: 407–413, 2007 [DOI] [PubMed] [Google Scholar]
- 13.Lorenz-Depiereux B, Bastepe M, Benet-Pages A, Amyere M, Wagenstaller J, Muller-Barth U, Badenhoop K, Kaiser SM, Rittmaster RS, Shlossberg AH, Olivares JL, Loris C, Ramos FJ, Glorieux F, Vikkula M, Juppner H, Strom TM: DMP1 mutations in autosomal recessive hypophosphatemia implicate a bone matrix protein in the regulation of phosphate homeostasis. Nat Genet 38: 1248–1250, 2006 [DOI] [PMC free article] [PubMed] [Google Scholar]
- 14.Feng JQ, Ward LM, Liu S, Lu Y, Xie Y, Yuan B, Yu X, Rauch F, Davis SI, Zhang S, Rios H, Drezner MK, Quarles LD, Bonewald LF, White KE: Loss of DMP1 causes rickets and osteomalacia and identifies a role for osteocytes in mineral metabolism. Nat Genet 38: 1310–1315, 2006 [DOI] [PMC free article] [PubMed] [Google Scholar]
- 15.Béliveau R, Brunette MG: The renal brush border membrane in man: Protein pattern, inorganic phosphate binding and transport: comparison with other species. Ren Physiol 7: 65–71, 1984 [PubMed] [Google Scholar]
- 16.Prie D, Huart V, Bakouh N, Planelles G, Dellis O, Gerard B, Hulin P, Benque-Blanchet F, Silve C, Grandchamp B, Friedlander G: Nephrolithiasis and osteoporosis associated with hypophosphatemia caused by mutations in the type 2a sodium-phosphate cotransporter. N Engl J Med 347: 983–991, 2002 [DOI] [PubMed] [Google Scholar]
- 17.Liao BY, Zhang J: Null mutations in human and mouse orthologs frequently result in different phenotypes. Proc Natl Acad Sci U S A 105: 6987–6992, 2008 [DOI] [PMC free article] [PubMed] [Google Scholar]
- 18.Inoue Y, Segawa H, Kaneko I, Yamanaka S, Kusano K, Kawakami E, Furutani J, Ito M, Kuwahata M, Saito H, Fukushima N, Kato S, Kanayama HO, Miyamoto K: Role of the vitamin D receptor in FGF23 action on phosphate metabolism. Biochem J 390: 325–331, 2005 [DOI] [PMC free article] [PubMed] [Google Scholar]
- 19.Segawa H, Yamanaka S, Ohno Y, Onitsuka A, Shiozawa K, Aranami F, Furutani J, Tomoe Y, Ito M, Kuwahata M, Imura A, Nabeshima Y, Miyamoto K: Correlation between hyperphosphatemia and type II Na-Pi cotransporter activity in klotho mice. Am J Physiol Renal Physiol 292: F769–F779, 2007 [DOI] [PubMed] [Google Scholar]
- 20.Segawa H, Kaneko I, Takahashi A, Kuwahata M, Ito M, Ohkido I, Tatsumi S, Miyamoto K: Growth-related renal type II Na/Pi cotransporter. J Biol Chem 277: 19665–19672, 2002 [DOI] [PubMed] [Google Scholar]
- 21.Segawa H, Yamanaka S, Onitsuka A, Tomoe Y, Kuwahata M, Ito M, Taketani Y, Miyamoto K: Parathyroid hormone-dependent endocytosis of renal type IIc Na-Pi cotransporter. Am J Physiol Renal Physiol 292: F395–F403, 2007 [DOI] [PubMed] [Google Scholar]
- 22.Amizuka N, Yamada M, Watanabe JI, Hoshi K, Fukushi M, Oda K, Ikehara Y, Ozawa H: Morphological examination of bone synthesis via direct administration of basic fibroblast growth factor into rat bone marrow. Microsc Res Tech 41: 313–322, 1998 [DOI] [PubMed] [Google Scholar]
- 23.Oda K, Amaya Y, Fukushi-Irié M, Kinameri Y, Ohsuye K, Kubota I, Fujimura S, Kobayashi J: A general method for rapid purification of soluble versions of glycosylphosphatidylinositol-anchored proteins expressed in insect cells: An application for human tissue-nonspecific alkaline phosphatase. J Biochem 126: 694–699, 1999 [DOI] [PubMed] [Google Scholar]
- 24.Yamashita M, Ying SX, Zhang GM, Li C, Cheng SY, Deng CX, Zhang YE: Ubiquitin ligase Smurf1 controls osteoblast activity and bone homeostasis by targeting MEKK2 for degradation. Cell 121: 2–4, 2005 [DOI] [PMC free article] [PubMed] [Google Scholar]
- 25.Iwasaki Y, Yamato H, Nii-Kono T, Fujieda A, Uchida M, Hosokawa A, Motojima M, Fukagawa M: Administration of oral charcoal adsorbent (AST-120) suppresses low-turnover bone progression in uraemic rats. Nephrol Dial Transplant 21: 2768–2774, 2006 [DOI] [PubMed] [Google Scholar]
Associated Data
This section collects any data citations, data availability statements, or supplementary materials included in this article.
Supplementary Materials
[Supplemental Data]
