Human Chromosome 7: DNA Sequence and Biology (original) (raw)
. Author manuscript; available in PMC: 2010 Jun 9.
Published in final edited form as: Science. 2003 Apr 10;300(5620):767–772. doi: 10.1126/science.1083423
Abstract
DNA sequence and annotation of the entire human chromosome 7, encompassing nearly 158 million nucleotides of DNA and 1917 gene structures, are presented. To generate a higher order description, additional structural features such as imprinted genes, fragile sites, and segmental duplications were integrated at the level of the DNA sequence with medical genetic data, including 440 chromosome rearrangement breakpoints associated with disease. This approach enabled the discovery of candidate genes for developmental diseases including autism.
With the advent of the Human Genome Project (HGP), a wealth of resources including genetic (1), physical (2, 3), gene (4), and draft DNA sequence maps (5, 6) have facilitated the discovery of more than 360 disease-associated genes and loci on chromosome 7 (table S1).
Here we present a comprehensive assembly of 157,953,789 nucleotides (nt) of DNA covering human chromosome 7. About 85% of the content was derived from a subset of unpublished Celera whole-genome scaffolds for chromosome 7 (7) based on updates of previous work (5). Another 15% was from new or updated clone-based sequences from the International Human Genome Sequencing Consortium (notably the Washington University Genome Sequencing Center) and other sources (supporting online text) (tables S2 and S3). The assembly (named CRA_TCAGchr7.v1) is available at a public Web site (www.chr7.org/) and in Gen-Bank (7). To maximize the utility of the sequence for discovery, we incorporated biological and medically relevant features from all available databases, the literature, and our data (7). Wherever possible, computer-based annotations of the sequence were examined manually and validated experimentally. Moreover, we included patient analysis as an aspect of the sequence annotation to increase knowledge of the function and regulation of genes. The Generic Model Organism Database (8) and its Genome Browser function were implemented to display all mapping, sequencing, structural, and clinical data to provide a mechanism and dynamic platform for human chromosome 7 annotation.
The assembled sequences were positioned to cytogenetic bands on chromosome 7 by fluorescence in situ hybridization (FISH) with 1440 genomic clones (7). The FISH resource also assisted in confirming order and copy number in chromosomal regions containing low-copy or complex repeats (9, 10). For the 770 bacterial genomic clones displayed in the Genome Browser, FISH experiments were reproduced more than once in at least two laboratories to allow accurate cytogenetic boundaries to be established. The sequence assembly reached both telomere ends and encompassed the apparent junction sequences between the euchromatic arms, and the D7Z2 and D7Z1 centromeric satellites on 7p and 7q, respectively. Because the centromere is polymorphic (ranging in size from 1500 to 3800 kb at D7Z1 and 100 to 500 kb at D7Z2) (11, 12), 2,700,000 nucleotides (nt) were substituted to represent an average-sized chromosome 7.
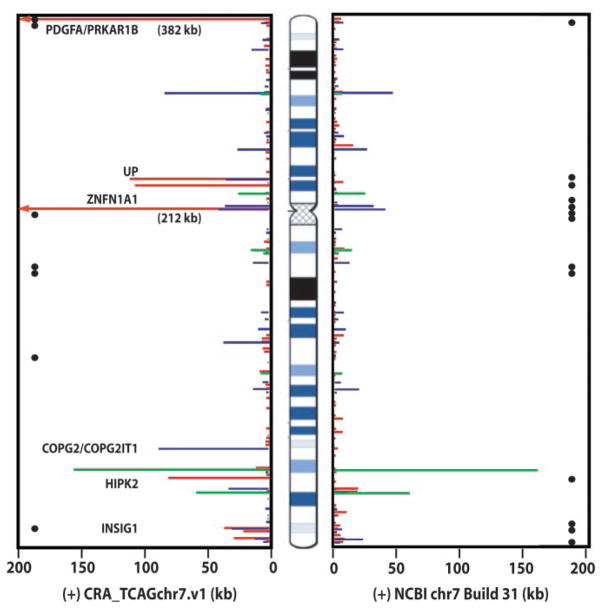
We tested all available genomic data against our assembly, including the latest National Center for Biotechnology Information (NCBI) chromosome 7 sequence database (Build 31) (supporting online text). Using the PatternHunter program (13) to compare CRA_TCAGchr7.v1 and Build 31, we found (i) a total of 1,186,913 nts of unmatched sequence between the assemblies, (ii) 132 other sites (encompassing 508,332 nt) where different sequences were found at the same relative chromosomal positions (termed sequence variations), and (iii) 10 equivalent DNA segments placed in an inverted orientation between the two assemblies (Fig. 1; figs. S1 and S2, table S4). The differences detected could be due to rearrangements arising during cloning, assembly mistakes, or polymorphism between the source chromosomal DNA (no correlation was observed between inverted regions and known genomic polymorphism or discrepancies in genetic maps).
Fig. 1.
DNA sequence comparison of CRA_TCAGchr7.v1 against NCBI Build 31. Black circles represent the sites of physical gaps. The sites and extent of unmatched sequences present in one assembly but not the other are shown in red, sequence variations in blue, and inversions in green. Genes present in CRA_TCAGchr7.v1, but absent in Build 31, are shown (see table S4; complete dataset is at www.chr7.org/).
Chromosome 7 functional and structural features
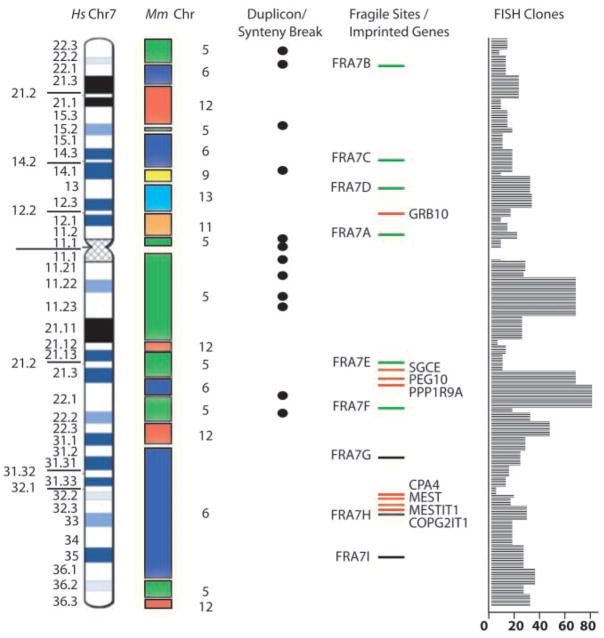
Through comparison of the Celera mouse genome sequence to our assembly, 21,859 syntenic anchor points (14) from six murine chromosomes (5, 6, 9, 11, 12, and 13) were identified (Fig. 2; table S5, a and b). The syntenic anchor points were grouped into 36 blocks, 14 of which had not been reported before (15, 16).
Fig. 2.
Six mouse chromosomes with synteny to human chromosome 7, 12 syntenic breakpoints overlapping segmental duplications, 9 fragile sites (FRA7E, FRA7G, FRA7H, FRA7I being cloned), 8 imprinted genes (7), and 770 bacterial clones anchored to the sequence.
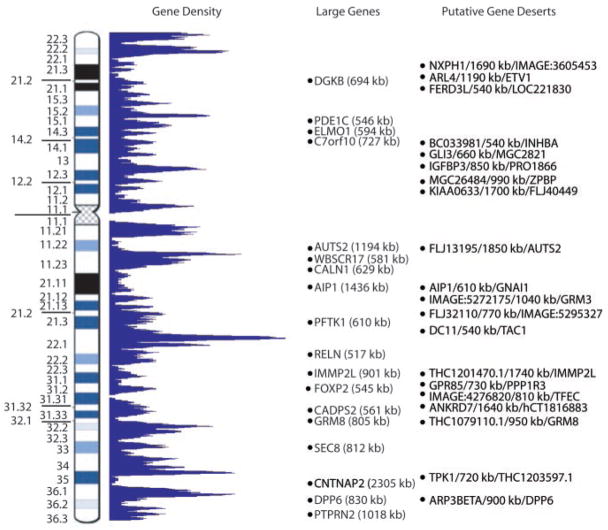
To generate the most complete description of genes on chromosome 7, we used computer-based annotation in conjunction with extensive laboratory experimentation (7). A team of reviewers scrutinized data and, by comparison to the reference DNA sequence, defined 1917 gene structures (Table 1). Their distribution along chromosome 7 is shown in Fig. 3. The description of 297 of these gene units was either exclusive to our dataset, or present in a more complete or different form, as seen from comparison with other databases.
Table 1.
Chromosome 7 gene summary. TCRB encompasses 67 gene and 16 pseudogene segments. TCRG includes 14 gene segments and 8 pseudogene segments. NCBI Refseq and Ensembl use different criteria; for comparison, we have grouped similar categories in the same row. The complete list of genes is at www.chr7.org/, and it will continue to be updated.
| Categories of genes | No. of genes | Gene length (bp) | Transcript length (bp) | Exon size (bp) | No. of exons per gene | CpG islands (−2000 to 1000 bp) | No. of chromosome 7 genes from other projects | |
|---|---|---|---|---|---|---|---|---|
| NCBI RefSeq | Ensembl | |||||||
| Known genes | 863 | 69,877 | 2,639 | 261 | 10.1 | 541 (63%) | 355 (reviewed) | 1,053 (known) |
| Novel genes | 71 | 50,103 | 1,989 | 386 | 5.2 | 27 (38%) | 276 (provisional) | 297 (novel) |
| Partial genes | 40 | 42,964 | 1,850 | 339 | 5.5 | 20 (45%) | 172 (predicted) | |
| Predicted genes | 481 | 14,573 | 1,026 | 326 | 3.1 | 102 (21%) | 520 (model) | |
| Putative and noncoding RNA genes | 213 | 17,501 | 1,638 | 629 | 2.6 | 45 (21%) | ||
| Total genes | 1,668 | 1,323 | 1,350 | |||||
| TCR (gene segments) | 81 | 565 | 290 | |||||
| TCR pseudogene segments | 24 | 454 | 349 | |||||
| Pseudogenes | 144 | 1,439 | 1,056 | |||||
| Total structures | 1,917 |
Fig. 3.
Distribution of 1917 gene structures and 20 putative gene deserts on chromosome 7.
The gene structures were grouped into eight categories: (i) 863 known genes or human full-length cDNA sequences present in LocusLink or HUGO databases; (ii) 71 novel genes, full-length cDNA, or expressed sequence tag (EST) clusters that contain an open reading frame (ORF) (>100 amino acids) without a formal name; (iii) 40 partial genes, human cDNA, or EST clusters with an incomplete ORF (missing the start or stop codon); (iv) 481 predicted genes or predicted gene models, for which at least one exon matches supportive evidence (EST, protein homology, or mouse sequence) of nonoverlapping NCBI, RefSeq, or Ensembl entries; (v) 213 putative and noncoding RNA genes, human cDNA, or EST clusters that do not contain an apparent ORF (51 that have homology in mouse); (vi) 81 gene segments from the two T cell receptor (TCR) loci; (vii) 24 TCR pseudogene segments; and (viii) 144 pseudogenes. Overall, our data suggest that 1455 potential protein coding genes (known, novel, partial, predicted) and 213 putative and noncoding RNA genes reside on chromosome 7. Extrapolating these chromosome 7 numbers to the human genome, one would predict that there are about 29,000 protein coding genes and 3700 putative and noncoding RNA genes, consistent with some other estimates (5, 6, 17). Of the known genes, 474 of 863 (55%) were found to have one or more alternatively spliced forms, comparable to those observed on chromosomes 14 (54%) and 22 (59%) (18, 19).
The average gene size on chromosome 7 was 69.9 kb, exceeding what was reported previously (5, 6). There were 18 genes greater than 500 kb in size (Fig. 3); the largest, CNTNAP2, spanned 2300 kb. The q22 Giemsa light band had the highest gene density. At one site (coordinates 98.2 to 99.2 Mb), 56 genes were found; that exceeds the mean of 10.7 genes/Mb for the rest of chromosome 7. If the 1749 annotated genes (excluding pseudogenes) are considered, they cover a total of 72.9 Mb of sequence (intragenic regions), which suggests at least 46.5% of chromosome 7 is transcribed (the average intergenic distance was 42.4 kb). A total of 1335 CpG islands were identified on chromosome 7, of which 63% (541 of 863) resided in the 5′ end of a known gene.
Overlapping genes (total 100) were identified through comparison of the sequence coordinates for each known, novel, or partial gene. The pairs were then categorized on the basis of the type of sequence overlap and transcriptional orientation (7). After excluding splice variants, 38 sense-antisense gene pairs (with direct sequence overlap) were identified, 8 and 18 of which were in head-to-head or tail-to-tail orientation, respectively (table S6). The median size of sequence overlap between these transcripts was 238 bp, and for 23 out of 38 (61%), this occurred in the coding sequence. There were also 18 sense-sense (same strand) and 43 sense-antisense overlapping gene pairs that did not share sequence overlap, but occupied the same genomic domain. We found no bias in the number or position of CpG islands near overlapping transcripts. We did, however, observe that a disproportionate number of known imprinted genes, 5 of 8 on chromosome 7 (Fig. 2), had an overlapping transcript (table S6) relative to the total number of transcripts on chromosome 7.
We discovered 20 euchromatic regions each greater than 500 kb in size where no known, novel, or partial gene was found (named putative gene deserts; Fig. 3, table S7). These intervals, which were mostly (16 out of 20) located within or at the boundary of Giemsa dark bands, covered 20.5 Mb (13%) of chromosome 7; the largest was 1850 kb. They contained a low number of CpGs (0.8/Mb vs. 9.8/Mb control) and short interspersed nuclear elements (SINEs) (7.5 versus 16%), a high density of long interspersed nuclear elements (LINEs) (28.1 versus 18.8%), and a decreased mouse syntenic anchor point density (4.2 versus 7.2%). Gene-poor regions described on chromosomes 14, 20, and 21 (18, 20, 21) also exhibited similar characteristics (in all cases, each category yielded statistically significant results when compared with controls, P < 0.0001). Moreover, our analysis of the equivalent regions in mouse also did not yield any new genes, which suggests that these 20 deserts occurred before the divergence of the human and mouse genomes (table S7). As in humans, the mouse region contained low SINE (3.8 versus 13.6% average) and high LINE (30.2 versus 21%) content. However, the observation that 14 of 20 of these deserts were larger (average increase in size was 19%) in mouse was intriguing given the estimates of a 15% compression in overall size of the murine genome compared with the human (14, 16).
As part of this project, we had shown previously that segmental duplications (duplicons) on chromosome 7 can be targets for nonallelic homologous recombination leading to genomic deletions or inversions in Williams-Beuren syndrome (WBS) (10), or gene conversion events in Shwachman-Diamond syndrome (22). Moreover, our analysis of the entire human genome (using NCBI Build 31) revealed that chromosome 7 contained the largest amount of intrachromosomal duplication (23), which suggests that there could be other disease associations. To complete a more refined analysis of chromosome 7, we compared the CRA_TCAGchr7.v1 assembly with itself to search for all recent (>90% sequence identity) and large (>5 kb) intrachromosomal duplications. Overall, 146 distinct segments were identified, which composed 5.3% (8.3 out of 157.9 Mb) of the chromosome (Fig. 4).
Fig. 4.
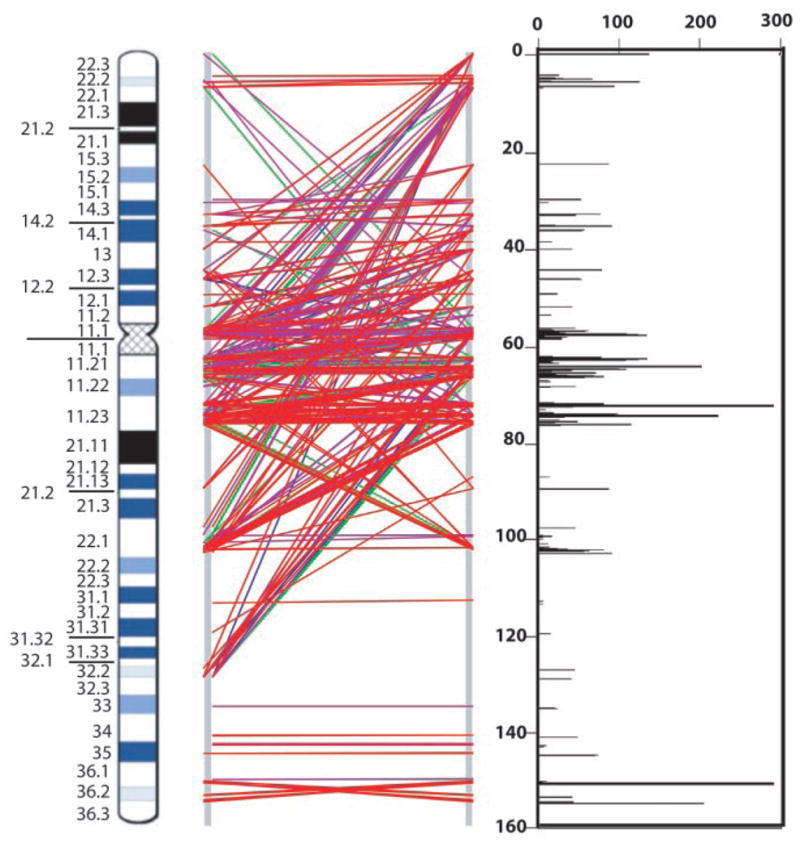
Recent segmental duplications on chromosome 7. Graphical views (using GenomePixelizer) of paralogous relationships between segmental duplications. Each line pairs two related sequences; red, 99 to 100% identity; purple, 96 to 98%; green, 93 to 95%; and blue, 90 to 92%. The size of segmental duplications (kb) is plotted against the length of chromosome 7.
Large duplicons (>100 kb) were identified at 7p22, 7p14-p15, the pericentromeric region, 7q11.21, 7q11.23, 7q22, and 7q36. We identified segmental duplications on chromosome 7 contained in 37 bacterial artificial clones (BACs) (confirmed by FISH) not described before (24). Notwithstanding, sequence analysis and metaphase FISH alone would not allow detection of all segmental duplications, and our finding that duplicons were present at 4 of the 7 remaining physical gaps on chromosome 7 suggests additional complexities (Fig. 1). Near-identical duplicons situated directly adjacent to each other on the chromosome could also be missed. Using high-resolution FISH analysis, we discovered one such segmental duplication about 1 Mb in size just telomeric to the WBS region (spanning D7S2470 to D7S2545) (7). Before we can add this to the sequence assembly, the exact boundaries of duplication will need to be determined. Additional WBS-like duplicons were observed at 7q22.1, where 29 rearrangement breakpoints were mapped; 24 were involved in malignancy (Fig. 5). Finally, our observation that 12 of 35 (34.2%) of mouse synteny breaks coincide with a recent segmental duplication on human chromosome 7 (P < 0.0001) (7) supports the idea synteny breaks (genomic rearrangements) do not always occur as random events (table S8).
Fig. 5.
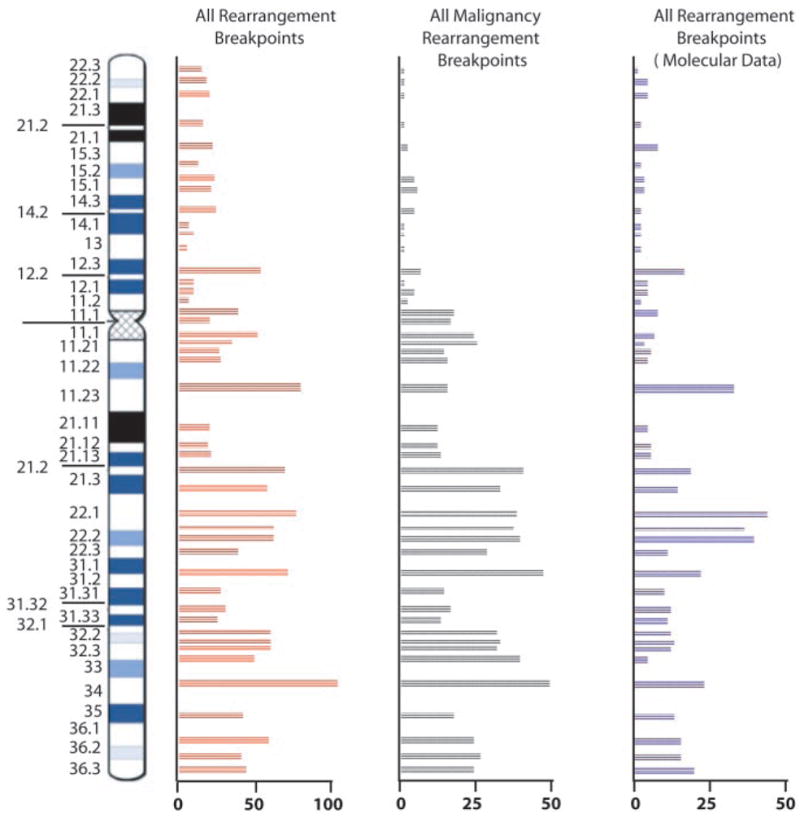
The distribution of 1570 cytogenetic rearrangement breakpoints (850 constitutional and 720 malignancy-associated) from 1440 patients with defined phenotypes; 440 rearrangement breakpoints have been characterized at the molecular level for disease identification studies (7).
Medical annotation of the chromosome 7 DNA sequence
To facilitate positional cloning studies and genotype-phenotype correlation, we have incorporated all medically relevant data into the DNA sequence map (supporting online text). From this ongoing initiative, we positioned 70 additional microsatellite markers, collated 1440 clinical karyotypes, and gathered numerous structural data, based on our FISH resource, that have been distributed worldwide. We have also cloned the FRA7G, FRA7H, and FRA7E fragile sites and have identified imprinted and differentially expressed genes (7). We studied rearrangement breakpoints from patients who have chromosome 7 anomalies and could place 440 on the sequence map (Fig. 5) (7). For more than 100 of these, molecular data were not available previously. Examples of new breakpoints mapped within a genomic region that contains a disease locus (gene not yet identified) associated with the patient’s phenotype (e.g., acute myeloid leukemia at 7q22, cavernous malformation syndrome at 7p15, splenic lymphoma at 7q33) are summarized in table S9. Therefore, studies of the sequence at the rearrangement breakpoint(s) could provide insight into the regulation and function of genes, as is described below for three different developmental diseases.
Split-hand split-foot syndrome [Online Mendelian Inheritance of Man (OMIM) 183600], also known as ectrodactyly or lobster claw deformity, is a human developmental condition that is genetically heterogeneous and demonstrates variable expression of phenotype. These genetic characteristics are problematic in the clinical setting, making it impossible to predict carrier status and severity of the disease. Examples of such pedigrees (the first reported in 1908) were even used to argue against the applicability of Mendelian genetics to humans. Our analysis of chromosomal deletions in patients with the syndrome led to the mapping of a disease locus within a 1.2-Mb critical region at 7q21.3 (named SHFM1) (Fig. 6), but in a decade-long search, no disease gene could be identified. We positioned a balanced translocation or inversion breakpoint from 12 unrelated ectrodactyly patients and found them to be scattered throughout the critical region. The breakpoints did not collectively interrupt any single gene, which suggests a “position effect” mutation might be involved. Reports that double-null knockouts of two murine Distalless homeobox genes, Dlx5 and Dlx6, exhibit ectrodactyly (25, 26) strongly implicate the human orthologs (which map within the SHFM1 region). In the simplest explanation, the chromosomal breakpoints located up to 1 Mb centromeric of human DLX5 and DLX6 separate critical regulatory elements from the genes and lead to their dysregulation during development. From our characterization of other patients (represented in the Genome Browser), position-effect mutations are known for other developmental genes on chromosome 7: GLI3, TWIST, SHH, and CDK6 in Greig’s cephalopolysyndactyly (up to 15 kb-3′), Saethre-Choetzen (up to 100 kb-5′), holoprosencephaly (up to 250 kb-5′) and triphalangeal thumb (up to 1000 kb-5′), and splenic marginal zone lymphoma (up to 66 kb-5′), respectively. Further study of the breakpoints including comparative DNA analysis will guide experiments to identify candidate regulatory sequences for testing in functional assays.
Fig. 6.
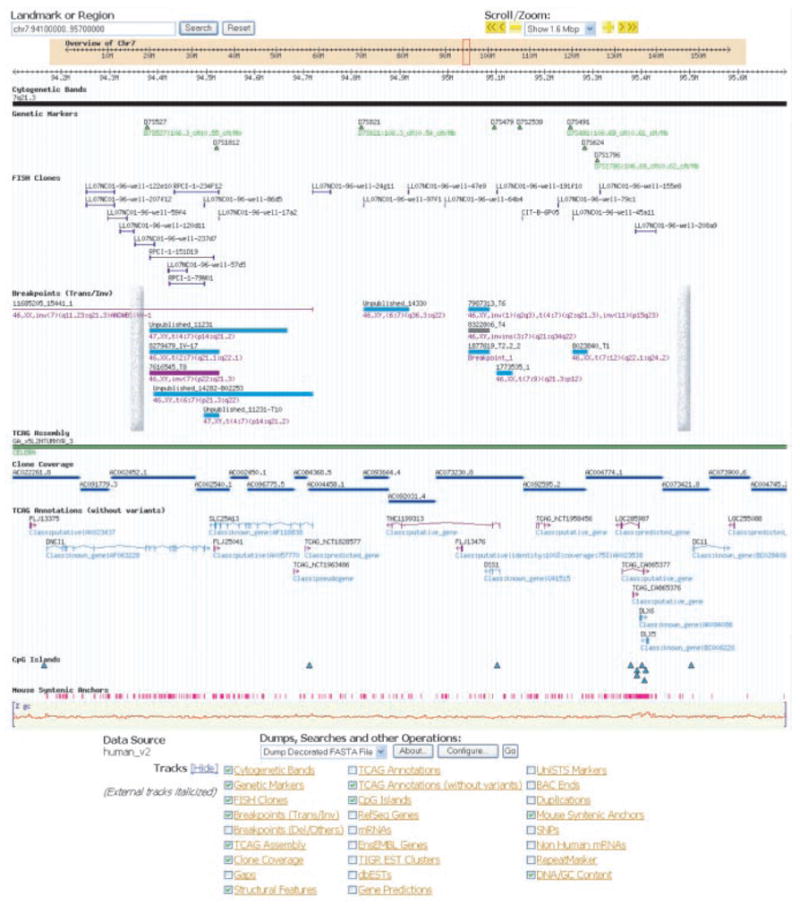
The SHFM1 region at 7q21.3, as an example of information in the chromosome 7 Genome Browser. The positions of nine translocations, two inversions, and two breakpoints from an insertion (all from SHFM1 patients) are shown to map within the minimal critical region defined by deletion breakpoints (vertical bars) (30). Besides the known genes (DNCI1, SLC25A13, DSS1, DLX5, DLX6) (31), we identified two novel transcripts (TCAG_CA865376 and TCAG_CA865377) at the DLX locus, a longer variant of DSS1 (THC1199313), and additional putative genes.
We followed a line of investigation similar to that used to study chromosomal rearrangements in autism patients to assess candidate genes for the susceptibility locus (AUTS1) mapped to 7q (27). Using the sequence as a guide, we fine-mapped the chromosome 7 derivative-translocation breakpoints from three new autism patients within 7q22-q31 (the region demonstrating maximum linkage). The breakpoints in cases 16724, 18667, and 11550 (table S9) were positioned within BACs at 7q22.1, 7q31.2, and 7q31.3, respectively. The most interesting finding was that the breakpoint in case 11550 overlapped with a rearrangement from an unrelated patient (10893502_2), diagnosed with speech and language disorder (a common component of the autism phenotype). The last breakpoint was anchored to the sequence by using data from the literature (28). Both breakpoints disrupt the same, apparently noncoding, RNA transcript (TCAG_4133353; GenBank CB338058), which is composed of at least 5 exons spanning 288 kb and is not found in the mouse genome.
For autism case 18667, the translocation breakpoint mapped near to the FOXP2 gene, which was shown previously to cause a form of speech and language disorder (29). The child inherited the translocation from the mother, who had speech delay, which suggests that FOXP2 might also be involved in autism. Seven isoforms of FOXP2 (spanning 545 kb) were characterized, but all mapped at least 680 kb 3′ of the translocation breakpoint (in a gene-poor region), once again raising the possibility of a position-effect mutation. Finally, in autism case 16724, the breakpoint was nearest to the neuronal pentraxin 2 (NPTX2) gene, which is thought to be involved in excitatory synaptogenesis and could, therefore, be considered a functional candidate for autism. The TCAG_4133353, FOXP2, and NPTX2 are now being examined for mutations in autism families.
In the third example, for two WBS patients (17430 and 16724) who do not carry the common 1.6-Mb hemizygous microdeletion found in 95% of affected individuals, we have discovered a new 500-kb inversion variant associated with the disease (supporting online text). Unlike the majority of other WBS deletions or inversions (10), the breakpoints in these individuals do not appear to be associated with segmental duplication-mediated events because they map to unique sequences. The CYLN2 and GTF2IRD1 genes and the SCYA24 and SCYA26 genes are closest to the centromeric and telomeric inversion breakpoints, respectively.
Future studies of human chromosome 7 and community-based annotation
Our goal of establishing a complete reference sequence benefited from data derived from both whole-genome shotgun and clone-based projects. Although some experimentation will be necessary to resolve minor discrepancies in the assembly, with the current framework in hand, the focus of work can be turned to confirming representation, testing for polymorphism, finalizing the gene map, and applying the information for disease study. For the last, we will continue to incorporate as much biomedical information as possible into the DNA sequence map. As we demonstrated, the approach of studying chromosomal rearrangements en masse enabled rapid identification of candidate genes for monogenic and complex diseases and facilitated many functional and structural studies of chromosome 7.
Throughout our study, we found differences and inconsistencies between databases, arguing strongly for the need of additional community involvement in establishing and annotating the consensus sequence of the human genome. We have established a user-friendly database and organized our results into standardized files, in the spirit that this compilation of chromosome 7 information will not only be used as a primary source, but also be incorporated into other projects.
Supplementary Material
Suppl
Acknowledgments
We thank The Centre for Applied Genomics at The Hospital for Sick Children (HSC) and Celera Genomics, as well as clinical collaborators and families. Supported by Genome Canada, the Canadian Institutes of Health Research, the Canadian Genetic Diseases Network, the Howard Hughes Medical Institute International Scholar Program (to S.W.S.), and the HSC Foundation. We also thank groups worldwide for contributing genomic information to databases.
Footnotes
References and Notes
- 1.Dib C, et al. Nature. 1996;380:152. doi: 10.1038/380152a0. [DOI] [PubMed] [Google Scholar]
- 2.Kunz J, et al. Genomics. 1994;22:439. doi: 10.1006/geno.1994.1407. [DOI] [PubMed] [Google Scholar]
- 3.Bouffard GG, et al. Genome Res. 1997;7:59. doi: 10.1101/gr.7.1.59. [DOI] [PubMed] [Google Scholar]
- 4.Schuler GD, et al. Science. 1996;274:540. [PubMed] [Google Scholar]
- 5.Venter JC, et al. Science. 2001;291:1304. doi: 10.1126/science.1058040. [DOI] [PubMed] [Google Scholar]
- 6.International Human Genome Sequencing Consortium. Nature. 2001;409:860. [Google Scholar]
- 7.Materials and methods are available as supporting material on Science Online. The sequence assembly is at www.chr7.org/ and in the Third Party Annotation Section of the DDBJ/EMBL/GenBank databases under the accession number TPA: BL000001. The scaffolds are in DDBJ/EMBL/GenBank under the project accession number AACC00000000. The version described in this paper is the first version, AACC01000000. Individual accession numbers of the scaffolds are AACC01000001, AACC01000002, AACC01000003, AACC01000004, AACC01000005, AACC01000006, AACC01000007, AACC01000008, AACC01000009, AACC01000010, AACC01000011, AACC01000012, AACC01000013, AACC01000014, AACC01000015, AACC01000016, AACC01000017, AACC01000018, AACC01000019, AACC01000020, AACC01000021, AACC01000022, AACC01000023, AACC01000024, AACC01000025, and AACC01000026. The annotation data and analyses based on the CRA_TCAGchr7.v1 assembly described in this paper are shown (and are archived) as the March 2003 database freeze (see www.chr7.org/). Additional annotations or updates to the sequence assembly will be available as subsequent freezes. The Washington University Genome Sequencing Center has also produced an assembly and analysis of human chromosome 7 (L. Hillier et al., Nature, in press).
- 8.Stein LD, et al. Genome Res. 2002;10:1599. doi: 10.1101/gr.403602. [DOI] [PMC free article] [PubMed] [Google Scholar]
- 9.Osborne LR, et al. Genomics. 1997;45:402. doi: 10.1006/geno.1997.4923. [DOI] [PubMed] [Google Scholar]
- 10.Osborne LR, et al. Nature Genet. 2001;29:321. doi: 10.1038/ng753. [DOI] [PMC free article] [PubMed] [Google Scholar]
- 11.Wevrick R, Willard HF. Nucleic Acids Res. 1991;19:2295. doi: 10.1093/nar/19.9.2295. [DOI] [PMC free article] [PubMed] [Google Scholar]
- 12.de la Puente A, et al. Cytogenet Cell Genet. 1998;83:176. doi: 10.1159/000015175. [DOI] [PubMed] [Google Scholar]
- 13.Ma B, Tromp J, Li M. Bioinformatics. 2002;18:440. doi: 10.1093/bioinformatics/18.3.440. [DOI] [PubMed] [Google Scholar]
- 14.Mural RJ, et al. Science. 2002;296:1661. doi: 10.1126/science.1069193. [DOI] [PubMed] [Google Scholar]
- 15.Pevzner P, Tesler G. Genome Res. 2003;13:37. doi: 10.1101/gr.757503. [DOI] [PMC free article] [PubMed] [Google Scholar]
- 16.Mouse Genome Sequencing Consortium. Nature. 2002;420:520. [Google Scholar]
- 17.The Fantom Consortium. Nature. 2002;420:523. [Google Scholar]
- 18.Heilig R, et al. Nature. 2003;421:601. doi: 10.1038/nature01348. [DOI] [PubMed] [Google Scholar]
- 19.Dunham I, et al. Nature. 1999;402:489. doi: 10.1038/990031. [DOI] [PubMed] [Google Scholar]
- 20.Deloukas P, et al. Nature. 2001;414:865. doi: 10.1038/414865a. [DOI] [PubMed] [Google Scholar]
- 21.Hattori M, et al. Nature. 2000;405:311. doi: 10.1038/35012518. [DOI] [PubMed] [Google Scholar]
- 22.Boocock GR, et al. Nature Genet. 2003;33:97. doi: 10.1038/ng1062. [DOI] [PubMed] [Google Scholar]
- 23.Cheung J, et al. Genome Biology. 2003;4:R25. doi: 10.1186/gb-2003-4-4-r25. [DOI] [PMC free article] [PubMed] [Google Scholar]
- 24.Bailey JA, et al. Science. 2002;297:1003. doi: 10.1126/science.1072047. [DOI] [PubMed] [Google Scholar]
- 25.Merlo GR, et al. Genesis. 2002;33:97. doi: 10.1002/gene.10098. [DOI] [PubMed] [Google Scholar]
- 26.Robledo RF, Rajan L, Li X, Lufkin T. Genes Dev. 2002;16:1089. doi: 10.1101/gad.988402. [DOI] [PMC free article] [PubMed] [Google Scholar]
- 27.International Molecular Genetic Study of Autism Consortium. Human Mol Genet. 1998;3:571. doi: 10.1093/hmg/7.3.571. [DOI] [PubMed] [Google Scholar]
- 28.Lai CS, et al. Am J Hum Genet. 2000;67:357. doi: 10.1086/303011. [DOI] [PMC free article] [PubMed] [Google Scholar]
- 29.Lai CS, Fisher SE, Hurst JA, Vargha-Khadem F, Monaco AP. Nature. 2001;413:519. doi: 10.1038/35097076. [DOI] [PubMed] [Google Scholar]
- 30.Scherer SW, et al. Hum Mol Genet. 1994;3:1345. doi: 10.1093/hmg/3.8.1345. [DOI] [PubMed] [Google Scholar]
- 31.Kobayashi K, et al. Nature Genet. 1999;2:159. doi: 10.1038/9667. [DOI] [PubMed] [Google Scholar]
Associated Data
This section collects any data citations, data availability statements, or supplementary materials included in this article.
Supplementary Materials
Suppl
