Relationship between obesity and pulse pressure in children: results of the National Health and Nutrition Survey (NHANES) 1988–1994 (original) (raw)
. Author manuscript; available in PMC: 2013 Mar 12.
Published in final edited form as: J Am Soc Hypertens. 2012 Jul-Aug;6(4):277–283. doi: 10.1016/j.jash.2012.05.002
Abstract
Background
Obesity is a known cardiometabolic risk factor in children. In adults, pulse pressure (PP) is a known predictor and a risk factor of cardiovascular (CV) diseases. In this study, we examined the association between measures of obesity and PP in children.
Methods
A retrospective analysis of 4667 children ages 6–17 years from the National Health and Nutrition Survey (1988–1994) was performed. We defined wide PP as 4th quartile PP and high waist circumference (WC) as >75th percentile based on age and gender.
Results
There were 51% boys, 74% whites, 16% blacks, 10% Hispanics, 12% obese, 26% with high WC, 26% with wide PP, and 9% with high blood pressure (BP). Prevalence of wide PP was high among obese children. A significantly higher mean PP was observed in boys, Blacks, obese, those with high WC and high BP. The adjusted odds ratio (OR) for wide PP was higher in boys, Blacks, and those with high WC.
Conclusion
There was a statistically significant independent association observed between wide PP and high WC, but not with obesity based on BMI. Further exploration of wide PP as a CV risk factor in childhood and its relationship to CV outcomes appears warranted.
Keywords: Body mass index, waist circumference, blood pressure, cardiovascular risk factors
Introduction
Emerging evidence from recent studies reveals that pulse pressure (PP) is an independent predictor of, and a risk factor for, coronary heart disease (CHD) and left ventricular hypertrophy (LVH) in both normotensive and hypertensive adults.1-4 It has been reported to be a more reliable marker of CHD than either systolic or diastolic blood pressure (BP) in the adult population.5 Change in PP for a given stroke volume is directly related to vascular stiffness, which could be either functional or structural in nature.6 Recent studies in children revealed that there is a direct relationship between increased arterial wall stiffness and various demographic/clinical factors such as gender,7 development,8,9 intrauterine growth retardation,10 and serum cholesterol level.11
Obesity is known to be one of the leading preventable causes of cardiovascular (CV) disorders, independent of other metabolic abnormalities such as hypertension, insulin resistance, and hyperlipidemia.12-15 There are several anthropometric measures that help to determine the differences in body fat distribution such as body mass index (BMI), waist circumference (WC), waist to height ratio, and waist to hip ratio that were shown to have an independent relationship to CV risk factors during childhood.16-18 However, to date there are no studies that have looked at the association between PP and body fat indices such as obesity based on BMI and WC, a measure of central obesity, in children.
The aims of the present study are to analyze the prevalence of wide PP across age, gender, and ethnicity and to determine the association between different measures of obesity and PP in a nationally representative sample of children in the United States, ages 6–17 years, using the data obtained from the Third National Health and Nutrition Survey (NHANES III) conducted between 1988 and 1994.
Methods
Sample Selection
Current study data were obtained from NHANES III that was conducted between 1988 and 1994. It was a cross-sectional survey on a representative sample of US civilian, noninstitutionalized population of children and adults between the ages of 2 months to 65 years. Select subgroups were over sampled such as young children, older persons, as well as Blacks and Hispanics.19 This survey used a stratified, multistage probability design. Details of the survey design can be found in the NHANES III Operational Manual.19 We identified 6961 children between the ages of 6 and 17 years and after excluding those with missing data on core variables, there were 4671 children identified, out of which 4 more were excluded because of receiving antihypertensive medications. Our final study population included 4667 children whose data were used for analysis.
Grouping of Study Population
We divided the total population into two groups, obese and non-obese based on BMI criteria, and compared them across their demographic and clinical characteristics. To assess the age dependent differences in cardiac parameters, we divided them into two groups: younger (6–12 years) and older (13–17 years). For the purpose of statistical analyses, they were also categorized according to gender (boys and girls), ethnicity (White, Black, and Hispanic), height percentiles (<50th and ≥50th percentile), BP status (normal and high), and the PP quartiles (normal and wide).
Measurements
BP Measurements
Three BP determinations were obtained on all eligible individuals using a mercury sphygmomanometer by a trained physician or a health technologist, who participated in the NHANES III data collection at the medical examination site or during home visits. Both systolic and diastolic BPs were obtained three times, 30 seconds apart on the same day of visit. Average of these three measurements were entered in the NHANES III database as a single value for each individual child.19
WC Measurements
This measurement was taken using a steel measuring tape to the nearest 0.1 cm at the high point of the iliac crest at minimal respiration when the participant was in a standing position. The examiner stood behind the participant, palpated the hip area for the right iliac crest, marked a horizontal line at the high point of the iliac crest, and crossed the line to indicate the mid-axillary line of the body. The examiner then stood on the participant’s right side and placed the measuring tape around the trunk in a horizontal flat surface at the level marked on the right side of the trunk. The recorder observed the participant to ensure that the tape was parallel to the floor and that the tape was snug, but did not compress the skin.19
Core Variables and Definitions
BMI
BMI was calculated by using the following equation: BMI = weight (kg)/height (m)2. Then BMI percentiles were determined from previous standardized data adjusted for age and gender.20,21
BMI-Based Obesity
A BMI value of ≥95th percentile indicated obesity.20
WC
Percentile value was determined for each individual child based on the standard data adjusted for age and gender.22 We defined high WC as >75th percentile.
Height
The height percentiles were determined from the standardized growth chart.21 Subjects were then divided into subgroups of those who had <50th percentile and ≥50th percentile to assess the relationship between height and other variables.
PP Quartile
PP is the difference between systolic and diastolic BPs. We determined the PP quartiles for the total population and considered the 4th quartile as wide PP.
BP
Data on systolic and diastolic BPs were used to identify the BP percentiles adjusted for age, gender, and height, according to the standards created by the “Fourth Report on Blood Pressure Prevention and Education Committee.” We defined high BP as systolic and/or diastolic BP ≥90th percentile (that includes both prehypertension, which is from the 90th to <95th percentile or in adolescent children systolic BP >120 and diastolic BP >80, and hypertension, which is ≥95th percentile).23
Statistical Analyses
All variables were stored and analyzed using SAS (SAS Institute Inc., Cary, North Carolina) and adjusted for the complex oversampling design. Standard descriptive statistics, two-tailed Student’s _t_-tests, and analysis of variance were employed for continuous variables. We used dichotomous variables indicating whether a participant had normal or high BMI, normal or high WC, and normal or high BP. Pearson’s chi-square was performed for dichotomous categorical variables to examine the level of statistical significance between two variables. Stepwise logistic regression analysis was performed where appropriate to identify the adjusted odds ratio for the 4th PP quartile independent of other variables. A P value less than .05 was considered statistically significant.
Results
There were 4667 participants ages 6–17 years; 51% were boys. The detailed demographics and clinical characteristics for the total population and for the obese and non-obese subgroups are shown in Table 1. Mean PP was higher among boys (P < .001), blacks (P < .02), obese by BMI (P < .001), and those with high WC (P < .001) and high BP (P < .001), but did not differ by other demographics and clinical characteristics as shown in Table 2.
Table 1.
Distribution by demographics and clinical characteristics of the total population, non-obese and obese children, ages 6–17 years, from the NHANES 1988–1994 data
| Variables | Total (Weighted %) | Non-obese* (Weighted %) | Obese† (Weighted %) | P Value†† |
|---|---|---|---|---|
| Number of subjects | 4667 | 3962 (88) | 705 (12) | |
| Age | ||||
| 6–12 y | 2940 (57) | 2461 (56) | 479 (62) | |
| 13–17 y | 1727 (43) | 1501 (44) | 226 (38) | .2 |
| Gender | ||||
| Boys | 2269 (51) | 1946 (51) | 323 (52) | |
| Girls | 2398 (49) | 2016 (49) | 382 (48) | .8 |
| Ethnicity | ||||
| White | 1300 (74) | 1147 (75) | 153 (68) | |
| Black | 1699 (16) | 1428 (16) | 271 (20) | |
| Hispanic | 1668 (10) | 1387 (9) | 281 (12) | .02 |
| Height | ||||
| <50th percentile | 1689 (34) | 1513 (35) | 176 (23) | |
| ≥50th percentile | 2765 (66) | 2256 (65) | 509 (77) | .002 |
| Waist circumference | ||||
| Normal‡ | 3395 (74) | 3338 (84) | 57 (7) | |
| High§ | 1272 (26) | 624 (16) | 648 (93) | <.001 |
| Blood pressure | ||||
| Normal¶ | 4292 (91) | 3700 (93) | 592 (81) | |
| High** | 375 (9) | 262 (7) | 113 (19) | <.001 |
| Pulse pressure | ||||
| 4th quartile | 1259 (26) | 991 (24) | 268 (35) | |
| 1st–3rd quartile | 3408 (74) | 2971 (76) | 437 (65) | .007 |
| Systolic BP (mean ± SE), mm Hg | 102.9 (0.3) | 102.6 (0.4) | 108 (0.8) | <.001 |
| Diastolic BP (mean ± SE), mm Hg | 56.3 (0.4) | 56.0 (0.5) | 58.5 (0.7) | .007 |
| Pulse rate (mean ± SE) per minute | 79.1 (0.6) | 78.3 (0.6) | 84.1 (1.4) | <.001 |
| Pulse pressure (mean ± SE), mm Hg | 46.7 (0.4) | 46.2 (0.5) | 49.7 (1.0) | .003 |
Table 2.
Mean pulse pressure in the total population of children, ages 6–17 years, by demographic and clinical characteristics
| Variables | Mean (SE) | P Value |
|---|---|---|
| Total population | 46.6 (0.4) | |
| Age | ||
| 6–12 y | 46.1 (0.6) | .2 |
| 13–17 y | 47.3 (0.5) | |
| Gender | ||
| Boys | 47.8 (0.5) | <.001 |
| Girls | 45.4 (0.6) | |
| Ethnicity | ||
| White | 46.3 (0.5) | |
| Black | 47.8 (0.6) | .02 |
| Hispanic | 47.3 (0.7) | .24 |
| Height | ||
| <50th percentile | 46.2 (0.6) | .14 |
| ≥50th percentile | 47.0 (0.5) | |
| Waist circumference | ||
| Normal* | 45.8 (0.5) | <.001 |
| High† | 49.1 (0.6) | |
| Blood pressure | ||
| Normal‡ | 45.7 (0.4) | <.001 |
| High§ | 56.9 (1.4) |
We noted a significant increase (P < .001) in systolic BP in the obese children of both age groups: ages 6–12 and 13–17 years; however, diastolic BP was only significantly increased among obese 6–12-year-old children (P =.002), did not vary significantly among the 13–17 year olds. Pulse rate was significantly higher among the obese in both age groups. On the other hand, PP was significantly higher only in the 13- to 17-year-old obese children (Table 3). Differences in pulse rate and PP were also illustrated as bar graphs in Figure 1.
Table 3.
Means of cardiovascular parameters in non-obese and obese children ages 6–12 and 13–17 years
| Variables | 6–12 years | 13–17 years | ||||
|---|---|---|---|---|---|---|
| Non-obese* | Obese† | P Value‡ | Non-obese* | Obese† | P Value‡ | |
| Systolic BP (mm Hg) | 97.8 (0.5) | 104.2 (0.8) | <.001 | 107.8 (0.4) | 114.6 (1.2) | <.001 |
| Diastolic BP (mm Hg) | 52.0 (0.7) | 55.9 (1.2) | .002 | 61.1 (0.5) | 62.7 (1.8) | .3 |
| Pulse rate (per minute) | 81.9 (0.7) | 87.7 (1.2) | <.001 | 73.7 (0.5) | 78.4 (2.3) | .04 |
| Pulse pressure (mm Hg) | 45.8 (0.7) | 48.3 (1.7) | .2 | 46.7 (0.5) | 51.9 (1.5) | <.001 |
Figure 1.
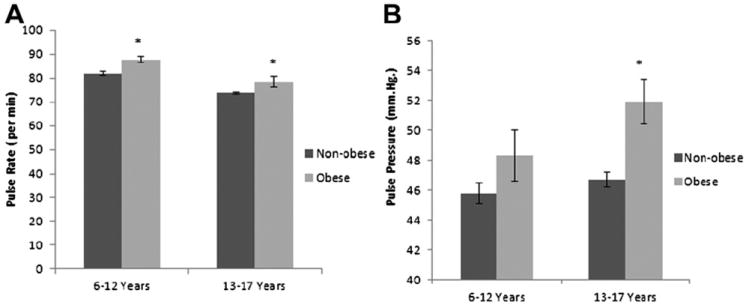
The mean resting pulse rate (A) and pulse pressure (B) in obese and non-obese children, ages 6–12 years and 13–17 years. *Obese vs. non-obese, P < .05; error bars depict standard error.
The odds ratio for wide PP was significantly higher in boys, Blacks, those who were obese by BMI, and in those with higher WC. However, after adjusting to relevant covariables, the odds ratio for wide PP for the entire cohort remained significant only for boys, blacks, and those with high WC (Table 4).
Table 4.
Odds ratios for wide PP by demographic and clinical characteristics using multiple regression analysis in the total population of 6- to 19-year-old children
| Variables | Unadjusted OR (95% CI) | P value | Adjusted OR (95% CI) | P value |
|---|---|---|---|---|
| 13–17 y vs. 6–12 y | 1.05 (0.78–1.38) | .80 | 1.08 (0.80–1.45) | .62 |
| Males vs. females | 1.36 (1.07–1.74) | .01 | 1.41 (1.13–1.77) | .003 |
| Blacks vs. Whites | 1.24 (1.00–1.51) | .04 | 1.25 (1.01–1.54) | .02 |
| Hispanics vs. Whites | 0.99 (0.80–1.26) | .90 | 0.96 (0.74–1.24) | .21 |
| Height <50th vs. ≥50th percentile | 1.15 (0.90–1.45) | .20 | 0.92 (0.73–1.15) | .44 |
| Obese* vs. non-obese† | 1.71 (1.16–2.52) | .01 | 1.22 (0.72–2.06) | .46 |
| High WC‡ vs. normal WC§ | 1.66 (1.32–2.10) | <.001 | 1.54 (1.12–2.11) | .008 |
Discussion
According to our findings, in children between the ages of 6 and 17 years, the prevalence of obesity was greater among Blacks, Hispanics, in children who were above average in height, and those with high waist circumference and who had high BP. The mean PP differed significantly by gender, ethnicity, and obesity status. Furthermore, independent associations between wide PP and males, Blacks, obesity, and high WC were also observed but, after multivariable adjustment, obesity did not reveal a significant independent association with wide PP. These findings suggest obesity is associated with an increased risk for wide PP, but is unlikely to be causal.
PP is a surrogate of vascular function and a known CV risk factor in adults.24 In the Bogalusa heart study, there were significantly more obese children in the higher PP quartile compared with non-obese children, independent of age, ethnicity, and gender.25 In our study, obesity, defined by BMI percentile, was more highly correlated with high PP (defined as being in the 4th quartile), but after multivariable adjustment we found it did not have an independent association of a greater likelihood of having a higher PP suggesting the association is mediated by other factors. However, WC, a measure of central obesity, which is another risk factor for CV disorders,16-18 was independently associated with a significantly increased likelihood of having a PP in the 4th quartile. Studies by Mehta et al revealed that, although WC and BMI were independent predictors of left ventricular mass index, WC predicted altered left ventricular function better than BMI in children between the ages of 3–19 years.26 This may suggest that central obesity perhaps plays an important role in the development of CV disorders more so than obesity defined by BMI percentile.
Our data also revealed that there was a significant increase in pulse rate among obese children as shown in Figure 1. This finding is consistent with previous study by Baba et al.27 The increase in pulse rate in obese children in this study did not appear to have a consistent direct effect on PP because the latter was only increased in the older age group.
When we analyzed the data on PP among different ethnic groups, we found Black children had a higher prevalence of wide PP and high mean PP in comparison to Whites. This could be a result of an increase in the sympathetic tone and peripheral vascular resistance that was reported previously by other investigators.28,29 When this occurs, it can lead to a preferential increase in systolic BP, which in turn can lead to increase in PP. In addition, the prevalence of obesity is also known to be high among these children,30 which is another independent contributor of high vascular resistance.31 Together, they could lead to an additive effect on PP. The results from the THUSA BANA (Transition and Health during Urbanization in South Africa in children; bana = children) study revealed associations between several dietary components and CV parameters such as abnormal arterial compliance, increased stroke volume, increased peripheral vascular resistance, and wide PP in Black children who had hypertension.32 This supports a possible hypothesis that a culture-specific dietary factor(s) could have also played a role in the difference in the mean PP and increased independent risk of wide PP.
The major strength of this analysis is that this study was based on a representative sample of national data obtained from a large number of US children and adolescents. Other strengths include the use of rigorous, quality control monitoring, a standardized BP protocol, calibrated equipment, and well-trained examiners. In addition, the primary variables examined in this study require no extra cost because PP can be determined from systolic and diastolic BP values that are routinely obtained during regular health visits for virtually every child. Although WC is not measured routinely during clinic visits, it is an easy measurement to obtain because it only requires a measuring tape and the teaching of the technique to medical staff. A limitation of the study is that BP measurements were obtained on only 1 day, and not on three separate occasions as recommended in the 2004 pediatric BP guidelines.23 Thus, we do not know if the children with higher BP were truly hypertensive. Second, there were no data on other potentially relevant information such as physical activity, psychosocial factors, and dietary intake, and therefore, these could not be taken into consideration during the analyses.
In conclusion, because the United States has witnessed widespread increases in the prevalence of obesity over the past few decades among children, the growing fear of high future health costs prompts the need for reliable and cost effective methods for early detection of chronic and complicating CV conditions. PP is an easy to assess marker and an independent risk factor for CHD and left ventricular dysfunction in adults. Further prospective studies should be conducted to identify a true independent risk association between PP and central obesity as well as its long-term effect on CV outcomes. In the future, PP and WC should be perhaps included in the study designs of clinical trials and therapeutic strategies that are aimed at long-term CV risk reduction in young children.
Acknowledgments
This manuscript was made possible, in part, through the support of the following National Institutes of Health grants: NIMHD grants P20MD000182 and U54MD007598 (formerly U54RR26138), and NIDDK grant R01-DK078106. K.N. has consulted with Amgen, King Pharmaceuticals, and Abbott/Reata.
References
- 1.Mazza A, Pessina AC, Gianluca P, Tikhonoff V, Pavei A, Casiglia E. Pulse pressure: an independent predictor of coronary and stroke mortality in elderly females from the general population. Blood Pressure. 2001;10:205–11. doi: 10.1080/08037050152669710. [DOI] [PubMed] [Google Scholar]
- 2.Franklin S, Khan S, Yong N, Larson M, Levy D. Is pulse pressure useful in predicting risk for coronary heart disease? The Framingham Heart Study. Circulation. 1999;100:354–60. doi: 10.1161/01.cir.100.4.354. [DOI] [PubMed] [Google Scholar]
- 3.Verdecchia P, Schillaci G, Borgioni C, Ciucci A, Pede S, Porcellati C. Ambulatory pulse pressure; a potent predictor of total cardiovascular risk in hypertension. Hypertension. 1998;32:983–8. doi: 10.1161/01.hyp.32.6.983. [DOI] [PubMed] [Google Scholar]
- 4.Jokiniitty JM, Majahalme SK, Kahonen MA, Tuomisto MT, Turjanmaa VM. Pulse pressure is the best predictor of future left ventricular mass and change in left ventricular mass: 10 years of follow-up. J Hypertens. 2001;19:2047–54. doi: 10.1097/00004872-200111000-00016. [DOI] [PubMed] [Google Scholar]
- 5.Safar M, Chamiot-Clerc P, Dagher G, Renaud JF. Pulse pressure, endothelium function, and arterial stiffness in spontaneously hypertensive rats. Hypertension. 2001;38:1416–21. doi: 10.1161/hy1201.096538. [DOI] [PubMed] [Google Scholar]
- 6.Safar ME. Systolic blood pressure, pulse pressure and arterial stiffness as cardiovascular risk factors. Curr Opin Nephrol Hypertens. 2001;10:257–61. doi: 10.1097/00041552-200103000-00015. [DOI] [PubMed] [Google Scholar]
- 7.Hayward CS, K R. Gender-related differences in the central arterial pressure waveform. JACC. 1997;30:1863–71. doi: 10.1016/s0735-1097(97)00378-1. [DOI] [PubMed] [Google Scholar]
- 8.de Simone G, Roman MJ, Daniels SR, Mureddu G, Kimball TR, Greco R, et al. Age-related changes in total arterial capacitance from birth to maturity in a normotensive population. Hypertension. 1997;29:1213–7. doi: 10.1161/01.hyp.29.6.1213. [DOI] [PubMed] [Google Scholar]
- 9.Montgomery SM, Berney LR, Blane D. Prepubertal stature and blood pressure in early old age. Arch Dis Childhood. 2000;82:358–63. doi: 10.1136/adc.82.5.358. [DOI] [PMC free article] [PubMed] [Google Scholar]
- 10.Ley D, Stale H, Marsal K. Aortic vessel wall characteristics and blood pressure in children with intrauterine growth retardation and abnormal foetal aortic blood flow. Acta Paediatr. 1997;86:299–305. doi: 10.1111/j.1651-2227.1997.tb08894.x. [DOI] [PubMed] [Google Scholar]
- 11.Leeson CP, Whincup PH, Cook DG, Mullen MJ, Donald AE, Seymour CA, et al. Cholesterol and arterial distensibility in the first decade of life: a population-based study. Circulation. 2000;101:1533–8. doi: 10.1161/01.cir.101.13.1533. [DOI] [PubMed] [Google Scholar]
- 12.Maggio AB, Aggoun Y, Marchand LM, Martin XE, Herrmann F, Beghetti M, et al. Associations among obesity, blood pressure, and left ventricular mass. J Pediatr. 2008;152:489–93. doi: 10.1016/j.jpeds.2007.10.042. [DOI] [PubMed] [Google Scholar]
- 13.Geiss HC, Parhofer KG, Schwandt P. Parameters of childhood obesity and their relationship to cardiovascular risk factors in healthy prepubescent children. Int J Obesity. 2001;25:830–7. doi: 10.1038/sj.ijo.0801594. [DOI] [PubMed] [Google Scholar]
- 14.Sowers JR. Obesity as a cardiovascular risk factor. Am J Med. 2003;115(Suppl 8A):37S–41. doi: 10.1016/j.amjmed.2003.08.012. [DOI] [PubMed] [Google Scholar]
- 15.Sowers KM, Sowers JR. Obesity, hypertension, and vascular disease. Curr Hypertens Rep. 1999;1:140–4. doi: 10.1007/s11906-999-0009-6. [DOI] [PubMed] [Google Scholar]
- 16.Savva SC, Tornaritis M, Savva ME, Kourides Y, Panagi A, Silikiotou N, et al. Waist circumference and waist-to-height ratio are better predictors of cardiovascular disease risk factors in children than body mass index. Int J Obes Relat Metab Disord. 2000;24:1453–8. doi: 10.1038/sj.ijo.0801401. [DOI] [PubMed] [Google Scholar]
- 17.Motswagole BS, Kruger HS, Faber M, van Rooyen JM, de Ridder JH. The sensitivity of waist-to-height ratio in identifying children with high blood pressure. Cardiovasc J Afr. 2011;22:208–11. doi: 10.5830/CVJA-2010-062. [DOI] [PubMed] [Google Scholar]
- 18.Choy CS, Chan WY, Chen TL, Shih CC, Wu LC, Liao CC. Waist circumference and risk of elevated blood pressure in children: a cross-sectional study. BMC Public Health. 2011;11:613. doi: 10.1186/1471-2458-11-613. [DOI] [PMC free article] [PubMed] [Google Scholar]
- 19.Reference Manuals and Reports: Manual for Medical Technicians and Laboratory Procedures Used for NHANES III. Hyattsville, MD: Centers for Disease Control and Prevention; 1996. National Center for Health Statistics: Third National Health and Nutrition Examination Survey, 1988–1994; pp. 591–617. [Google Scholar]
- 20.Must A, Dallal GE, Dietz WH. Reference data for obesity: 85th and 95th percentiles of body mass index (wt/ht2) and triceps skinfold thickness. Am J Clin Nutr. 1991;53:839–46. doi: 10.1093/ajcn/53.4.839. [DOI] [PubMed] [Google Scholar]
- 21.www.cdc.gov/growthcharts/clinical_charts.htm
- 22.Fernandez JR, Redden DT, Pietrobelli A, Allison DB. Waist circumference percentiles in nationally representative samples of African-American, European-American, and Mexican-American children and adolescents. J Pediatr. 2004;145:439–44. doi: 10.1016/j.jpeds.2004.06.044. [DOI] [PubMed] [Google Scholar]
- 23.The fourth report on the diagnosis, evaluation, and treatment of high blood pressure in children and adolescents. Pediatrics. 2004;114(2 Suppl. 4th Report):555–76. [PubMed] [Google Scholar]
- 24.Resnick LM, Militianu D, Cunnings AJ, Pipe JG, Evelhoch JL, Soulen RL, et al. Pulse waveform analysis of arterial compliance: relation to other techniques, age, and metabolic variables. Am J Hypertens. 2000;13:1243–9. doi: 10.1016/s0895-7061(00)01219-x. [DOI] [PubMed] [Google Scholar]
- 25.Jiang X, Srinivasan SR, Urbina E, Berenson GS. Hyperdynamic circulation and cardiovascular risk in children and adolescents. The Bogalusa Heart Study. Circulation. 1101;91:1101–6. doi: 10.1161/01.cir.91.4.1101. [DOI] [PubMed] [Google Scholar]
- 26.Mehta SK, Richards N, Lorber R, Rosenthal GL. Abdominal obesity, waist circumference, body mass index, and echocardiographic measures in children and adolescents. Congen Heart Dis. 2009;4:338–47. doi: 10.1111/j.1747-0803.2009.00330.x. [DOI] [PubMed] [Google Scholar]
- 27.Baba R, Koketsu M, Nagashima M, Inasaka H, Yoshinaga M, Yokota M. Adolescent obesity adversely affects blood pressure and resting heart rate. Circ J. 2007;71:722–6. doi: 10.1253/circj.71.722. [DOI] [PubMed] [Google Scholar]
- 28.van Rooyen JM, Nienaber AW, Huisman HW, Schutte AE, Malan NT, Schutte R, et al. Differences in resting cardiovascular parameters in 10- to 15- year-old children of different ethnicity: the contribution of physiological and psychological factors. Ann Behav Med. 2004;28:163–70. doi: 10.1207/s15324796abm2803_4. [DOI] [PubMed] [Google Scholar]
- 29.Daniels SR, Kimball TR, Khoury P, Witt S, Morrison JA. Correlates of the hemodynamic determinants of blood pressure. Hypertension. 1996;28:37–41. doi: 10.1161/01.hyp.28.1.37. [DOI] [PubMed] [Google Scholar]
- 30.Hedley AAP, Ogden CLP, Johnson CLM, Carroll MDM, Curtin LRP, Flegal KMP. Prevalence of overweight and obesity among US children, adolescents, and adults, 1999–2002. JAMA. 2004;291:2847–50. doi: 10.1001/jama.291.23.2847. [DOI] [PubMed] [Google Scholar]
- 31.Kwagyan J, Tabe CE, Xu S, Maqbool AR, Gordeuk VR, Randall OS. The impact of body mass index on pulse pressure in obesity. J Hypertens. 2005;23:619–24. doi: 10.1097/01.hjh.0000160220.71350.5f. [DOI] [PubMed] [Google Scholar]
- 32.Schutte AEVRJ, Huisman HW, Kruger HS, Malan NT, De Ridder JH. Dietary markers of hypertension associated with pulse pressure and arterial compliance in black South African children: the THUSA Bana Study. Cardiovasc J S Afr. 2003;14:81–9. [PubMed] [Google Scholar]