LC-MS-based metabolomics (original) (raw)
. Author manuscript; available in PMC: 2013 Jul 2.
Published in final edited form as: Mol Biosyst. 2011 Nov 1;8(2):470–481. doi: 10.1039/c1mb05350g
Abstract
Metabolomics aims at identification and quantitation of small molecules involved in metabolic reactions. LC-MS has enjoyed a growing popularity as the platform for metabolomic studies due to its high throughput, soft ionization, and good coverage of metabolites. The success of LC-MS-based metabolomic study often depends on multiple experimental, analytical, and computational steps. This review presents a workflow of a typical LC-MS-based metabolomic analysis for identification and quantitation of metabolites indicative of biological/environmental perturbations. Challenges and current solutions in each step of the workflow are reviewed. The review intends to help investigators understand the challenges in metabolomic studies and to determine appropriate experimental, analytical, and computational methods to address these challenges.
1. Introduction
Metabolomics is the comprehensive analysis of all metabolites in a biological system 1. It complements transcriptomics and proteomics as it provides a quantitative assessment of low molecular weight analytes (<1800Da) that define the metabolic status of a biological system. Another related term, “metabonomics” was coined by Nicholson et. al 2 to represent studies of changes in metabolic activities in response to patho-physiological stimuli or genetic modifications. However, both terms overlap by a large degree in practice especially within the field of human disease research and they are often in effect synonymous 3. Metabolomic investigations have been applied in various research areas including environmental and biological stress studies, functional genomics, biomarker discovery, and integrative systems biology 4, 5. Those studies facilitate understandings of biochemical fluxes and discoveries of metabolites which are indicative of unusual biological or environmental perturbations.
Metabolic analysis is typically categorized as two complementary methods: targeted and untargeted. Targeted approach focuses on identifying and quantifying selected metabolites (or metabolite classes), such as substrates of an enzyme, direct products of a protein, a particular class of compound or members of a particular pathway. In the targeted approach, the chemical properties of the investigated compounds are known, and sample preparation can be tailored to reduce matrix effects and interference from accompanying compounds. While targeted approach is usually hypothesis-driven, untargeted analysis can generate new hypothesis for further tests by measuring (ideally) all the metabolites of a biological system. In Fig. 1, a typical workflow of a metabolomic study using liquid chromatography-mass spectrometry (LC-MS) based platform is presented. The workflow aims at comparing multiple biological groups to identify metabolites that are significantly altered. It starts with an untargeted analysis to screen potential and putative metabolites of interest. These metabolites are then subjected to a targeted analysis for metabolite ID verification, quantitation, functional interpretation, and pathway analysis. Various experimental, analytical, and computational steps in the workflow are discussed below, with an emphasis on the untargeted analysis.
Fig. 1.

A typical workflow of a metabolomic study.
2. Experimental design
Experimental design includes considerations on (1) experimental type (e.g., time series, case vs. control, gene mutation, etc.); (2) experimental factors (e.g., time, dose, or genetic variation, etc.); (3) experimental comparisons (e.g., against a standard reference sample or between samples, etc.). Series of guidelines that are specific for each type of experiments have been published in order to formulate a minimal set and a best practice set of reporting standards for metabolomic studies 6–8. Readers can follow their interests to look into the details in each guideline.
One important aspect of experiment design is to determine how many biological replicates are needed for a study to have the desired statistical power. In the proposed minimum reporting standard for chemistry analysis in metabolomic study 9, it was suggested that a minimum of three biological replicates is required and five replicates preferred. It is also useful to conduct a pilot study to evaluate LC-MS data variation under specific experimental conditions. The results from the pilot study can then be used to guide subsequent experiments. In addition, since homogeneous quality control (QC) samples are generally recommended to be included throughout the experiment 10, the variation estimated using QC samples can also be utilized to retrospectively evaluate the statistical power of an experiment. A proper experimental design for metabolomic investigations also includes analytical replicates, blanks, negative and positive controls to infer analytical and biological variations and assess data quality.
3. Sample collection and handling
Sample collection and sample handling are of critical influence on experimental reproducibility. Recent studies have evaluated the impact of sample handling and storage on metabolite composition 11–13. Results from these studies indicated that consistent sample handling as well as prompt storage of samples minimize the variability in the later analysis and ensure the quality of data. Some of the suggested guidelines from proteomics studies on biofluids 14 are also applicable to metabolomic investigations 15. These guidelines include: sample storage at −80°C or in liquid nitrogen to avoid metabolite degradation and minimize freeze-thawing cycle to avoid degradation or formation of metabolites. Additionally, for biofluid collection, factors such as the type of syringe, vacuum system/vacutainer for blood collection, storage vessel, anticoagulant, temperature, velocity, duration of centrifugation should be considered.
For tissue sample harvesting and processing, several methods are available including lyophilization, pulverization/homogenization, tissue cell lysis (e.g. liquid N2 grinding, manual or electric homogenization, and ultrasonic cell lysis). Other factors that affect the quality of samples include sample freezing methods, sample wash method, time, duration for tissue collection, etc. To inhibit metabolism in cell, plant tissue, and animal tissue samples, shock quenching and shock freezing are two commonly used methods. However for samples such as yeast or microbial, the sample quenching remains a difficult issue 16, 17.
4. Metabolite extraction
The chemical diversities in the metabolome and dynamic nature of metabolite turnover make metabolite extraction a challenging task. Matrix interference and sample loss often occur during this step. Balancing between the minimal matrix interference and maximum sample recovery, many efforts have been made to optimize the extraction protocols for target metabolites or the entire metabolome 15, 18. These protocols can vary and often depend on the sample types and objectives of the study. For example, extraction of high-abundance metabolites can be often achieved with good recoveries, whereas extraction of low-abundance metabolites requires enrichment for better detection. The enzymatic activities in cell and tissue samples often require careful sample quenching and stringent controlling during the extraction, in which analyte standards or isotope-labeled internal standards are spiked into samples to determine the metabolite recoveries and to test the absence of enzymatic activities or the extent of metabolite degradation 19. Unbiased metabolites extraction methods include liquid-liquid extraction (LLE), solid-liquid extraction (SLE), solid phase extraction (SPE), microwave assisted extraction, accelerated solvent extraction, protein precipitation, etc, among which LLE, SLE and SPE are the three most common ones.
During LLE, choice of the solvents depends on the chemical properties of metabolites. A particular solvent can extract metabolites of the same chemical class. For a specific study, researchers are recommended to test several extraction methods, compare their performance in metabolites recovery, extraction specificity, and efficiency to determine the most appropriate method for their study. The choice of solvents should also consider their compatibility with analytical instruments. In SLE, sample preparation needs to be optimized to avoid degradation or modification of metabolites caused by extraction conditions or enzymatic activities in tissue samples. Multiple solvent extractions or further sample grinding are often needed to recover the metabolites to the maximum extent since the solid sample matrix may still contain some compounds after the first extraction step.
SPE could work as an efficient method to extract the sample and remove interfering substances (e.g. salts or abundant metabolites). It is observed that retaining low abundant compounds on the solid phase of SPE is a good enrichment strategy 20. Several solid phase sorbents are available such as silica, alkylated silica (C-18), carbon based sorbents, ion-exchange materials, polymer materials and RAM (restricted access materials) that comprise the three most common chromatographic separation modes: normal phase, reverse phase and ion-exchange. SPE has been applied to metabolomic investigations in various studies including screening of serotonin and its precursor tryptophans in human platelet rich plasma 21, screening of hetrocyclic amines and metabolites in rat urine 22, 23, metabolite profiling in animal tissues 24 and in plant samples 25.
Readers are encouraged to refer to the literatures for a detailed description on the extraction techniques available for metabolomic studies 22, 26, 27.
5. LC-MS-based metabolomic data acquisition
Once the metabolites are extracted, metabolomic data are acquired using specific analytical technologies. In this review, we focus on LC-MS based analytical platforms.
LC-MS is a coupling of liquid chromatography and mass spectrometry. A mass spectrometer is typically composed of three major parts: ion source, mass analyzer, and detector. While the ion source converts sample molecules into ions, the mass analyzer resolves these ions either in a time-of-flight tube or an electromagnetic field before they are measured by the detector. Several options are available for ion sources including electrospray ionization (ESI), atmospheric pressure chemical ionization (APCI), atmospheric pressure photoionization (APPI), and fast atom bombardment (FAB). Due to the diverse chemical properties of metabolites, it is often required to analyze the biological sample in both +ve (positive) and −ve (negative) ionization modes under scan range of m/z 50–1000 to maximize metabolome coverage. ESI is by far the method of choice in LC–MS-based metabolomic studies, because its “soft ionization” capability produces a large number of ions through charge exchange in solution and often forms intact molecular ions which aid initial identification. APCI and APPI also typically induce little or no in-source fragmentation and are considered relatively tolerant to high buffer concentrations. These ionization approaches are complimentary to ESI for the analysis of non-polar and thermally stable compounds such as lipids. Ranges of applicability of APPI, APCI and ESI in terms of molecular weight and compound polarity are summarized in the Fig. 2. Nowadays instruments with dual ionization capabilities (e.g. ESI and APCI, or ESI and APPI) have gradually become the trend, which results in an increased coverage of the metabolome.
Fig. 2.
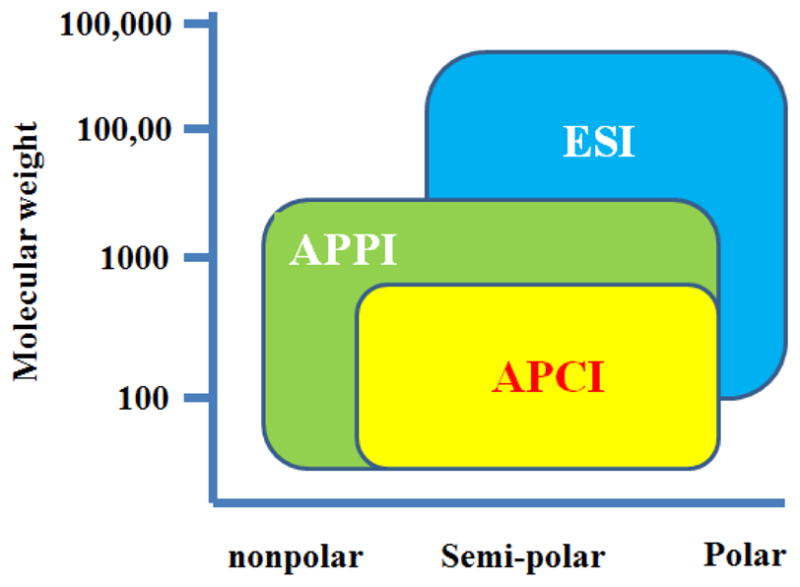
Ranges of applicability of APPI, APCI and ESI.
Mass analyzers can be categorized as: quadrupole (e.g. Agilent 6100 Single Quadruple; Thermo MSQ plus;), ion trap (IT, e.g. Thermo LTQ; Bruker Dalton amazon Ion trap; Agilent 6300 Ion trap), time-of-flight (TOF, e.g. Bruker Dalton MicrOTOF; AB Sciex Triple TOF; Agilent Accurate mass TOF), Orbitrap (Thermo Scientific) and Fourier transform ion cyclotron (FTICR, e.g. Bruker Apex FTICR; Thermo Scientific FT Ultra). Hybrid or tandem mass spectrometers refer to the combination of two or more analyzers. Modern high resolution mass spectrometers (HRMS), such as FTICR, Orbitrap, and TOF can provide accurate mass measurements to facilitate metabolite identification and also provide accurate metabolite quantitation. In addition to resolving ions by their m/z values and obtaining estimates of their molecular masses, mass analyzers can further aid metabolite identification by acquiring highly resolved and accurate MS/MS spectra. This is achieved through ion fragmentation by collision-induced dissociation (CID) in either quadrupole-based tandem in-space instruments such as triple quadrupole (QqQ, e.g. AB 5000 API QQQ; Agilent 6430 triple quadrupole; Thermo TSQ Quantumn /Vantage; Shimazhu LC-MS-8030 Triple Quadruple), quadrupole TOF (QTOF, e.g. Waters XEVO G2 QTOF; AB QSTAR Elite; Agilent 6540 accurate mass QTOF; Bruker micrOTOF-Q II), or ion trap-based tandem in-time instruments such as quadrupole-ion trap (QIT, e.g. AB QTRAP 4000), ion trap-TOF (IT-TOF, e.g. Shimazhu LCMS IT-TOF), LTQ-Orbitrap and LTQ-FTICR. Table 1 has summarized the performance of modern mass analyzers (parameters are from reference 28–30).
Table 1.
Performance of modern mass spectrometers in small molecule quantitation
| MS | Resolving power a | Mass accuracy | Scan rate | Detection limit b |
|---|---|---|---|---|
| QqQ | Unit resolution | 50 ppm | Moderate | fg-pg* (SRM) |
| QIT | 10,000 | 50 ppm | Moderate | fg-pg (SRM) |
| LIT | 10,000 | 50 ppm | Fast | pg (SRM) |
| IT-TOF/ QTOF | 20,000 | 3 ppm | Fast/moderate | pg (full scan) |
| High-Res-TOF | 60,000 | 2ppm | Fast | pg (full scan) |
| Q- Orbitrap/LTQ-Orbitrap | 140,000 | 2 ppm | Moderate | fg-pg (full scan); SRM compatible |
| LTQ-FTICR/Q-FTICR | 1,000,000 | ≤1 ppm | Slow/slow | pg (full scan) |
Most metabolomic studies use a separation method before mass spectrometric analysis. High performance liquid chromatography (HPLC), as a versatile separation method, allows separation of compounds of a wide range of polarity through either isocratic elution (the water-solvent composition remains constant during the separation) or a gradient elution (the water-solvent composition changes during the separation). Acetonitrile, methanol and tetrahydrofuran (THF) are the most common used organic solvents. Isocratic elution is preferred for simple samples (i.e. less than 10 components). Gradient elution provides an overall faster analysis, narrower peaks and similar resolution compared to isocratic elution 31.
LC-ESI-MS is becoming a method of choice for profiling metabolites in complex biological samples 32. Chromatographic separation can reduce sample complexity and alleviate matrix effects during ionization. In LC-ESI-MS, reverse phase liquid chromatography (RPLC), normally using C18 columns, can separate semi-polar compounds such as phenolic acids, flavonoids, glycosylated steroids, alkaloids, and other glycosylated species. Hydrophilic interaction liquid chromatography (HILIC) can use columns, such as aminopropyl columns to separate polar compounds like sugars, amino sugars, amino acids, vitamins, carboxylic acids, and nucleotides etc. For separation of basic and acidic metabolites, ion-paring reagents such as sodium alkanesulfonates and quaternary ammonium salts are often used in the mobile phase (e.g. sodium 1-heptanesulfonate and tetrabutylammonium hydroxide). Although normal phase liquid chromatography (NPLC) can also separate polar compounds, the use of non-polar organic mobile phase makes it more compatible with APCI-MS instead of ESI-MS. NPLC-APCI-MS has been applied for the analysis of non-polar lipids such as triacylglycerols, sterols, and fatty acid esters.
Good chromatographic separation improves the sensitivity of MS detection and also results in better MS data quality due to reduced background noise. Therefore, more efficient separation approaches are needed to reduce the sample complexity and improve the chromatographic resolutions of overlapping metabolites. One of such approaches is multidimensional liquid chromatography (MDLC) that allows the combination of two or more independent separation steps to increase the peak capacity and improve the separation of metabolites in complex samples. MDLC examples include RPLC-HILIC, ion exchange-reverse phase, size exclusion-reverse phase, and strong cation exchange-HILIC. Recent developments in capillary monolithic chromatography, high temperature LC, and ultra performance liquid chromatography (UPLC, i.e., pressure >400 bar in columns packed with <2 μm diameter particles) have also achieved significant progress in chromatographic resolution and expedited analysis 33. Meanwhile, metabolites of interest at low abundance interfered by significant backgrounds at low mass range or having the poor ionization also pose challenges to the sensitivity of detection by LC-ESI-MS method. Solutions to alleviate those issues include performing adequate sample preparation prior to LC separation. For example, adopting more selective SPE) to concentrate and purify samples, changing the ionization mode from ESI to APCI, APPI to reduce the ionization background interference, or performing chemical derivatization on metabolites to increase their MS signals and to have them detected in high mass range.
6. LC-MS and MS/MS data variability
Multiple factors contribute to the variability of LC-MS data. In addition to biological variability, which is inherent in biological studies involving multiple subjects, LC-MS data can exhibit significant variability because of analytical reasons. Sample preparation, instrument condition, or operation environment may introduce variations into the acquired data. The variations include drift of retention times, alteration of intensity values, and to a much less scale, drift of m/z values.
To evaluate the analytical variability, it is recommended that QC samples are repeatedly analyzed throughout the entire LC-MS experiment 10. QC samples can be aliquots of a sample pooled from multiple subjects in an equal amount and homogeneously mixed. The QC samples are then injected periodically throughout the experiment. By inspecting the QC runs, one can evaluate the analytical variation using summary statistics such as coefficient of variation (CV) or using projection methods such as principal component analysis (PCA). The pooled sample may also be used to reduce the variability of the LC-MS data. For example, peaks exhibiting a comparable variation within the LC-MS runs from the pooled sample relative to the variability within the biological samples of interest in the study can be considered unreliable and thus removed from subsequent statistical analysis.
In addition to variations in LC-MS data, variations are also seen in MS/MS spectra, especially for data generated with different types of instruments or under different experimental conditions. Due to different combinations of ionization source, collision energy, mass analyzer, and detectors, the same metabolite can be represented by distinct MS/MS spectra. For example, two MS/MS spectra from the same metabolite may vary on the relative intensities of the peaks. In addition, some peaks may appear in only one of the two spectra. The relatively poor reproducibility of MS/MS spectra (comparing with EI spectra) is a major obstacle against metabolite identification using spectral matching approaches. Database enlargement or the tuning point technique may enable MS/MS spectra library which can accommodate different instruments 34, 35.
7. Pre-processing of LC-MS data
To convert the raw LC-MS data into a peak list which can be easily interpreted and compared across runs, multiple preprocessing steps need to be performed as outlined below:
Outlier Screening aims to eliminate LC-MS runs or peaks which exhibit an unacceptable deviation from the majority of their replicates (analytical or biological). While the LC-MS variability is unavoidable, the outlier runs/peaks with excessive amount of bias need to be removed from the subsequent analysis. In practice, PCA is often used to identify sample outliers by visually inspecting the 2-D (or 3-D) score plot of the data. Those runs that deviate significantly from the majority are considered as possible outliers. R package OutlierD uses quantile regression on MA plot to detect outlier peaks from LC-MS/MS data 36. Schulz-Trieglaff et al. proposed another outlier detection algorithm by first summarizing the characteristics of LC-MS raw data with 20 quality descriptors. Robust PCA is then used to reduce the 20 descriptors to a vector of 6 dimensions, and Mahalanobis distance is used to identify the LC-MS run outliers 37.
Filtering is used to remove the noise and contaminants from LC-MS data. Various filtering methods such as median filtering or moving average filtering are applied to LC-MS data. One major requirement for filtering is to suppress the noise while preserving the peaks in the data. For example, Savitzky-Golay filter reduces the noise while keeping the peaks by preserving high-frequency components in LC-MS signals. By locally fitting a high-order polynomial function to the observed data, Savitzky-Golay filter is particularly successful in preserving the sharpness of peaks. Other methods such as matched filtering with the second order derivative of Gaussian function are also shown to be successful in smoothing the signal and enhance the peaks in a noisy background 38.
Baseline correction algorithms estimate the low-frequency baseline, and then subtract the estimated baseline from the raw signal. Baseline shift is often observed as the baseline of the intensities is elevated with increasing retention time, and the elevated baseline results in an over-estimate of the intensities of those late eluting analytes. A low-order Savitzky-Golay filter can be used to remove the baseline from LC-MS signal 39. PCA can also be used for baseline correction by first estimating the noise sub-space and then subtracting the projected signal in the noise sub-space from the raw data 38. Theoretically, it is expected that filtering and baseline correction are able to improve the detection and quantitation of peaks. However, there is no strict performance evaluation and comparison of different techniques on LC-MS data so far. In addition, as some researchers suggested 40, these algorithms may be a contributor of noise by themselves. An example of baseline correction is shown in Fig. 3.
Fig. 3.

Preprocessing of a LC-MS dataset with 10 samples. The LC-MS raw data are first corrected for baseline effect, and then peak detection is performed on each EIC to detect the peak(s). For multiple samples peak alignment is used to correct for retention time drift. The peak list can be acquired after peak alignment for the dataset. Ion annotation is used to recognize the peaks originating from the same metabolite. The data are acquired using a UPLC-QTOF Premier instrument.
Peak detection is a transformation which converts the raw continuous data into centroided discrete data so each ion is represented as a peak. This transformation offers two advantages: (1) part of the noise in the continuous data is removed; (2) data dimension is reduced without much information loss. Peak detection is generally carried out in two steps by first calculating the centroids of peaks over m/z range and then searching across retention time range for chromatographic peaks. For peak centroiding over m/z range, many manufactures of LC-MS instruments have provided vendor-specific software tools which enable the user to directly acquire centroided data. It is assumed these software tools are superior to general approaches as they can exploit machine-specific models. Currently, main efforts of peak detection algorithms focus on centroiding over retention time. Because m/z has significantly less variation compared with retention time, peak detection is generally performed on extracted ion chromatograms (EICs) 40 which is a 2-D signal of intensity versus retention time over a small m/z interval. In the majority of algorithms, EICs are acquired through binning over m/z range with a small bin size (e.g., 10–30 ppm). However, an inevitable situation in binning is that the trace of one ion may be split into two neighboring bins no matter how fine the bin size is chosen. Improved EIC extraction is achieved by Kalman tracking on 3-D LC-MS data or exploiting the density distribution of m/z data points 41, 42. In both cases, a fixed bin width is avoided. After the extraction of EICs, they are analyzed to determine the presence of peaks as well as their boundaries. Matched filtering with second order derivative of Gaussian function 43 is among the most common choices for this step. An example of peak detected by the method is shown in Fig. 3. More recently, multi-scale analysis such as “Mexican Hat” wavelet analysis 40 has gained popularity because it is more effective in handling peak width variation within LC-MS data. Other algorithms try to improve the peak detection accuracy through better modeling of chromatographic peaks. For example, a bi-Gaussian mixture model have been used for peak detection 44. However, the fitting of the model to a particular dataset often needs to be checked as chromatographic peak characteristics vary among experiments and instruments. To our knowledge, no performance comparison of peak detection on LC-MS data has been published yet. The main difficulty for such evaluation is the lack of ground truth, especially for the low intensity peaks.
Peak matching and retention time alignment enable the comparison of LC-MS-based metabolomic data across samples. The retention time of an ion may drift across different samples, even if those samples are analytical replicates. The drift is generally non-uniform across the retention time range and cannot be completely controlled during experiments. For large-scale studies involving multiple samples, retention time alignment is used to correct for the retention time drift and ensure that the same ion is compared across samples. One way for retention time correction is to add reference compounds to the samples and use these reference compounds as landmarks to align other peaks 27. However, these landmark compounds generally need to be carefully selected to have enough coverage of the retention time range and to avoid overlap with the analyzed metabolites. In addition, the excessive presence of internal standards may also cause ion suppression of analyzed compounds and result in unreliable quantitation. Because of these limitations, alignment approaches that do not rely on reference compounds are desired. One class of these approaches utilizes the peak detection results and makes efforts to find and match similar peaks 43. For example, XCMS first uses a kernel estimation procedure to group the peaks with similar m/z values and retention times across the dataset. After grouping, “well-behaved” peak groups to which very few samples have no peak assigned or have more than one peaks assigned are used as landmarks for alignment. The deviations of the retention times of these landmarks from their median values within peak groups are regressed against the retention time. Those regions on chromatogram without “well-behaved” peaks can be interpolated and aligned. The aligned peaks are grouped again to match peaks with corrected retention times. This procedure is usually carried out iteratively two or three times to make sure the retention time drift is sufficiently corrected for. The other class of approaches utilizes the LC-MS raw data for retention time alignment by matching the chromatographic signals, such as EIC or total ion chromatogram (TIC). Correlation optimized warping (COW) was proposed for aligning chromatographic signals by dividing the time axis into segments and performing a linear warping within each segment to maximize the overall correlation of the two chromatographic profiles 45. Similarly dynamic time warping (DTW) aligns chromatograms by maximizing the spectra similarity while preserving the internal ordering of the eluents 46. A critical assessment of several popular alignment methods concludes that XCMS gives the best performance for alignment of LC-MS metabolomic data 47. However, it is also pointed out the success of a particular method is highly dependent on the experience of the user to choose the appropriate parameters. An example of a set of EIC peaks before and after alignment is shown in Fig. 3.
Ion Annotation groups together ions which are likely to originate from the same compound. In LC-MS-based metabolomics, one metabolite is often represented by multiple peaks in LC-MS data with distinct m/z values but at similar retention times, due to the presence of isotopes, adducts, and neutral-loss fragments. As long as the scan rate is properly adjusted and enough scanning points are acquired to define the chromatographic peaks, the ions from the same compound share similar-shaped elution profiles which can be represented by their EICs. Thus, ion annotation can be achieved by clustering similar elution profiles together. An ion annotation approach was previously developed where ions are grouped based on the Pearson correlation of their EICs 48. If the correlation between two ions is above a pre-defined threshold, and the m/z difference between the two ions can be explained by known adducts/isotopes/neutral-loss fragments relationships, the two ions are considered to originate from the same metabolite. One example of ion annotation is shown in Fig. 3 using this approach. However, in above method, the choice of the Pearson correlation threshold is largely empirical without statistical interpretation. Additionally, when the elution profiles of two ions have a large overlap, Pearson correlation is generally high and not sensitive enough to capture the subtle differences in EICs. A statistically rigorous approach was proposed to test if two ions measured by TOF-MS are originated from the same compound 49. In this approach, the observed TOF-MS signal is modeled as a Poisson process. If two ions are derived from the same compound, the conditional distribution of observed intensity given the summed intensity should follow a binomial distribution with a constant success rate across the retention time. The Pearson chi-square test was used to evaluate the goodness-of-fit of the observation to binomial distribution, from which an associated p-value is derived. It was shown that this approach can reduce the ion annotation false positive rate to 6% compared with the 50% obtained by the Pearson correlation approach while maintaining the same sensitivity level. However, this approach is limited to data acquired using TOF analyzer and time-to-digital converter (TDC) detectors. In addition, when the ion intensity is high, the acquired signal will deviate from the Poisson process due to detector saturation, thus an inflated p-value is obtained.
Normalization of peak intensities helps to reduce the systematic variation of LC-MS data. One way to normalize LC-MS data is to add same amount of internal standards into all the samples. Relative abundance is calculated by adjusting other ions’ intensities based on their ratios to internal standards. When there are multiple internal standards, an algorithm was developed to find optimized normalization factor for each peak utilizing variability information from internal standards 50. Four normalization techniques without using internal standards were reviewed in a metabolomic study of urine samples 51. The study recommended the use of two normalization techniques for endogenous metabolites: normalization to osmolality and normalization to “total useful MS signal”.
Transformation of LC-MS data is sometimes needed to modify the data distribution so it is more suitable for subsequent statistical analysis. For example, transformations which lead to a more normal-distributed dataset or compress the dynamic range of data are often used. These transformations are usually heuristic. Z-score, log-transformation, and square-root transformation of peak intensities are common choices of transformations.
Software tools are provided by most instrument manufactures to relieve the LC-MS system users from the burden of sophisticated and sometimes heuristic pre-processing steps, especially peak detection and alignment. For example, MarkerLynx (Waters) is provided in conjunction with Waters LC-MS system for data pre-processing, visualization and statistical analysis. Other commercially available tools such as AnalyzerPro (SpectralWorks) and Genedata Refiner MS (Genedata) also provide pre-processing capability for LC-MS data. Publicly available software tools for pre-processing and analysis of LC-MS data include MZmine 52, XCMS 43, and MetAlign 53. These tools accept LC-MS data files of one or more standard file exchange format, such as NetCDF, mzXML, and mzML. Various steps in LC-MS data preprocessing are integrated into one platform and often modularized. The pre-processed results can be exported for further statistical analysis. Although the implementation details for the commercially available software are not often available, many of the algorithms reviewed before were implemented in the publicly available software. However, all of these software tools involve a large number of parameters which need to be chosen by the user. Because these parameters are often experiment-specific, they need to be understood and fine-tuned to ensure the success of preprocessing. A parameter selection procedure was proposed based on discrepancies among replicate samples. The advantage of the procedure was showcased in combination with XCMS by doubling the number of detected peaks with improved intensity estimations 54.
8. Statistical analysis
After pre-processing, the LC-MS raw data are summarized by a peak list. The statistical analysis aims to detect those peaks whose intensity levels are significantly altered between distinct biological groups. The specific choice of statistical methods often depends on the particular study design, while some methods can be applied to multiple types of studies.
The statistical analysis methods can be categorized as univariate and multivariate analysis. The univariate approach assesses the statistical significance of each peak separately. Commonly used univariate techniques include t-test, fold-change analysis, Wilcoxon rank-sum test, analysis of variance (ANOVA), etc. They are used to find the significantly altered metabolites in both unpaired 55 or paired studies 56. P-values are usually assessed in univariate methods, either through parametric approaches or permutation tests. Because thousands of metabolites can be simultaneously measured in an untargeted study, the multiple hypothesis testing problem will result in a high chance of false discovery even with a small p-value threshold. False discovery rate (FDR) is used to estimate the chance of false discovery at a given test statistics threshold or to control the total number of false discoveries. A q-value for each peak can be evaluated which is the minimum FDR at which that peak is called significant. Multiple methods exist to estimate or control the FDR 57. Some algorithms, such as significance analysis of microarray (SAM), directly estimate q-values using a re-sampling approach.
Multivariate analysis considers the combinatorial effect of multiple variables. It can be further categorized as unsupervised and supervised techniques. Unsupervised learning refers to methods that identify hidden structure in the data without knowing the class labels. One of the most popular unsupervised techniques in LC-MS-based metabolomic study is PCA, which finds a series of orthogonal projection directions that maximize the variance of the projected data. If PCA successfully clusters the samples according to prior knowledge (phenotype, genotype, time course, dose response etc), the metabolites with the largest weights in the loading vectors of the first few principal components are considered as most relevant to the interested biological question. PCA has been extensively used in multiple studies to elucidate the metabolomic consequence in time-course studies 58, to phenotype closely related genotypes 59, and to find indicative metabolites for diseases 60. Other unsupervised techniques such as self-organizing map (SOM) 61 or two-mode clustering 62 have also been used in LC-MS-based metabolomic studies.
In contrary to unsupervised techniques, supervised learning uses the class label information to construct a model to interpret the LC-MS data. Partial least square-discriminant analysis (PLS-DA) is a supervised technique widely used in LC-MS-based metabolomic data analysis. PLS-DA finds the projection direction which gives the largest covariance between the data and the labels. It is successful in identifying the projection that separates the pre-defined groups and finding the discriminant metabolites for the separation 58. PLS-DA has also seen applications in other study designs, such as the case-control study 63 or the time-course study 64. In addition to PLS-DA, other supervised learning methods such as random forest 65 and support vector machine 66 have also been used in assessing the discriminative power of metabolites. However, results from supervised techniques could be misleading due to over-fitting to the limited observation data. As a result, cross-validations or permutation tests 67 are needed to ensure the generalization capability of the constructed models.
An integrated software tool named MetaboAnalyst has been developed for statistical analysis of LC-MS data, which incorporated various algorithms 68. Many of the algorithms were previously developed for microarray data analysis, such as SAM and empirical Bayesian analysis of microarray. Other software tools such as Gene Expression Dynamics Inspector can also be used for metabolomic data analysis 69.
9. Metabolite identification
One of the major challenges in metabolomic studies is the identification of metabolites. Metabolites include a wide variety of structure classes such as sugars, lipids, steroids, amino acids, etc. Their chemical and physical diversities make it difficult to derive general rules to predict the fragmentation patterns. Many types of metabolism reactions further complicate the identification task. While it is estimated that there are 2,000 major metabolites in human body 70, the total number of possible metabolites in nature can reach up to 1,000,000 71.
At present, metabolite identification in untargeted metabolic analysis is mainly achieved through mass-based search followed by manual verification. First, the m/z value of a molecular ion of interest is searched against database(s) 72–75. The molecules having molecular weights within a specified tolerance range to the query molecular weight are retrieved from databases as putative identifications. The mass-based search can seldom provide unique identifications for the ions of interest due to three reasons. First, it has been shown that even with an accuracy of less than 1 ppm, which is a remarkably better accuracy than most analytical platforms can achieve, it is still not sufficient for unambiguous metabolite identification due to the presence of compounds with extremely similar molecular weights 8. Second, mass-based metabolite identification cannot discriminate isomers which have the same elemental composition but different structures. Third, all the metabolite databases are of limited coverage. Generally less than 30% of the detected ions in a typical LC-MS-based metabolomic experiment can be uniquely identified through mass-based search, leaving most of the ions either unidentified or with multiple putative identifications. Improved approaches, such as those involving isotope labeling, can be used to reduce the ambiguities from the mass-based search. But they cannot guarantee unique identification either 76.
While retention index derived from retention time in GC-MS experiments has been included in libraries and used for metabolite identification, no such index currently exists for LC-MS experiments. Due to the run-to-run variation of retention time even on the same machine, the comparison of retention times can only be performed under identical experimental conditions.
To verify the mass-based search results, authentic compounds of those putative identifications are subjected to MS or tandem MS experiments together with the sample. By comparing the retention times or tandem MS spectra of the authentic compounds with the ions of interest in the sample, the identities of the metabolites can be confirmed. It may be necessary to extend the MS2 to MS3 or MS4 level for more confident identifications of some metabolites. It was suggested that at least two independent and orthogonal data (retention time and mass spectrum, accurate mass and tandem mass spectrum, etc.) relative to an authentic compound analyzed under identical experimental conditions are necessary to verify a putative metabolite identification 9. The limiting factor of verification is that it is often costly and time consuming. The authentic compounds of putative identifications need to be acquired. More experiments need to be performed. Sometimes, a molecular ion can have more than 100 putative identifications which make manual verifications extremely laborious. An example of verification for S-1-P (Sphingosine-1-phosphate) through MS2 spectra is shown in Fig. 4.
Fig.4.

Metabolite ID verification by comparison of the MS2 spectrum of S-1-P (top) with experimental sample (bottom). The MS2 spectra are acquired with a precursor ion mass at 378 Da under negative ionization mode on a QSTAR Elite instrument.
10. Metabolite quantitation
LC-MS methods described in the previous section are primarily for semi-quantative characterization of metabolites. Quantitation of metabolites can help evaluate metabolic changes and further check the results from semi-quantative analysis. In the following, we discuss quantitation methods using selected reaction monitoring (SRM) (e.g., QqQ-based LC-SRM-MS/MS) and LC-HRMS in full scan. Note that multiple reaction monitoring (MRM) is used as a synonym for SRM.
In the QqQ-based SRM experiment, the precursor ion selected in the first quadruple (MS1) is dissociated to fragment ions in the collision cell and only specific fragment ion (daughter ion) is selected in the second quadruple (MS2) for detection. The two-stage ion selection procedure produces a sensitive measurement that is specific to both molecular weight (precursor ion) and structure (fragment ion) of a given analyte. Such pair of m/z values is referred to as “transition” in SRM.
SRM, as the gold standard of absolute quantitation can measure real concentration of several metabolites in a single run by using the isotope dilution technique, where a stable isotope analogue of the analyte compound is used as an internal standard (IS) in the MS analysis. Because of the high physical–chemical similarities between the labeled IS and the analyte, degradation during sample preparation, variations in instrumental response, and ion suppression effects in LC–ESI-MS can be compensated. The ratio of their MS signals within the dynamic range remains the same as well. Absolute quantitation of metabolites can be achieved by correlating their ratio of MS signals detected by SRM in the calibration curves as illustrated in Fig. 5, where calibration curves are constructed by relating the varying amounts of each analyte to their relative response factors (RRFs) as determined by the ratio of the peak area of the analyte to that of the corresponding isotope-labeled IS.
Fig. 5.
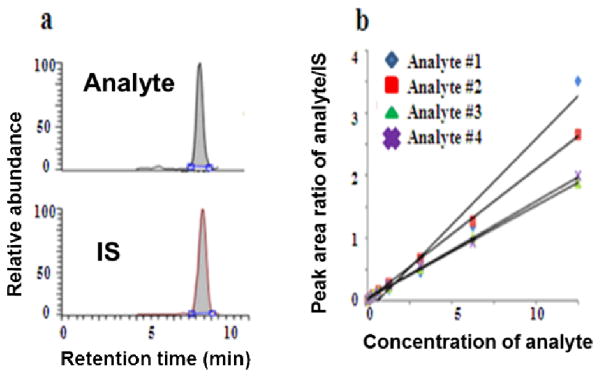
Illustration of absolute quantitation of metabolites by QqQ-based SRM using isotope dilution technique.(a) SRM detection of analyte and its isotope-labelled IS; (b) absolute quantitation of four analytes by SRM: correlating signal ratio of analyte and IS to its respective standard curve.
SRM has become the method of choice for small molecule quantitation for more than three decades 77. With the development of more effective sample preparation and chromatographic separations, e.g. adopting more selective SPE cleanup step and introducing dual chromatographic methodology by combining ion-paring RPLC and HILIC, modern QqQ mass spectrometers with fast spectral scan rate (e.g. SRM dwell time < 25ms) and high ionization efficiency (e.g. heated ESI or nano ESI) can achieve simultaneous quantitation of hundreds of metabolites. QqQ-based LC-SRM-MS/MS has become an ideal quantitative approach for targeted metabolic analysis 15, 78.
Although QqQ-based SRM quantitation has high sensitivity, the specificity of the method limits its application to targeted metabolomics and often neglects the information of other metabolites. In addition, some analytes only have non-specific transitions that are also common for matrix interferences such as the neutral loss of H2O or CO2. This compromises the specificity of SRM method and causes inaccurate quantitation. A global MS detection by HRMS, such as FTICR, Orbitrap, TOF or QTOF can address these limitations in SRM analysis. HRMS operating in full-scan mode can determine virtually all compounds present in a sample. Modern HRMS instruments with fast scan rates allow the acquisition of enough data points across a chromatographic peak for accurate quantitation using EICs by centering a narrow mass window (e.g. ±5–10 mmu) on the theoretical m/z value for each analyte. This quantitation approach avoids the pre-selection of SRM transitions and offers the quantitation of off-target compounds. So far FTICR presents the unsurpassed high mass accuracy and resolving power, but it is not widely used because of its high cost, maintenance difficulty, and compatibility with LC compared with Orbitrap and TOF mass spectrometers. More recently, Orbitrap-based HRMS has become the platform of choice to perform integrated qualitative and quantitative analysis in the full-scan mode 79. Especially the new benchtop Exactive Orbitrap™ showed more competitive advantages in terms of cost, sensitivity, mass accuracy, and linear dynamic range 80. Meanwhile, efforts have been made in sample preparation and LC separation in order to increase detection sensitivity, metabolites coverage and quantitation accuracy by HRMS full scan-based LC-MS method. For example the absolute or relative quantitation of a large number of unknown metabolites in complex samples has been advanced by differential isotope labeling techniques 81. Although there are only a few papers reporting TOF/QTOF-based HRMS for quantitative analysis, modern TOF technology could offer a potential alternative. The limited dynamic range in typical TOF instruments using TDC has been improved by analog-to-digital detector technology (ADC) 82. Significant improvements have been made in mass resolution and mass accuracy of TOF instruments. Currently TOF instruments with 40,000 in resolution and sub-ppm accuracy are possible 83, such as Agilent 6540 Ultra High Definition Accurate-Mass QTOF not only allow accurate-mass measurements for compound confirmation and molecular formula generation, but also provide accurate isotope ratios. Such capabilities help us narrow down the list of plausible molecular formulas and increase confidence in the result.
11. Pathway Analysis
Metabolomics is one member in the “omics” cascade. To acquire a comprehensive picture of the biological process, it needs to be combined with other data from genomics, transcriptomics, and proteomics. Data from different platforms will support and complement each other to understand the biological mechanism. Integration of the data from heterogeneous sources on the biological network or pathway level has proved to provide a more complete picture about the investigated biological system. Metabolite set enrichment analysis (MSEA) has been developed to provide functional interpretation of a selected set of metabolites, after verification and quantitation of metabolites from untargeted studies 84. MSEA assembles predefined metabolite sets through both public databases (such as HMDB and KEGG) and text mining of literatures. Using these metabolite sets as the backend knowledgebase, MSEA enables researchers to perform enrichment analysis on a list of altered metabolites from a biofluid or tissue to identify a biological pathway or disease condition that can be further investigated. A Google-Map style interactive visualization system is used to help users understand the pathway analysis results. A similar algorithm, metabolite pathway enrichment analysis (MPEA), has also been published which can accommodate ambiguous identifications for metabolites 85. Pathway enrichment analysis is also available through commercial pathway analysis tools including Ingenuity Pathways Analysis (IPA, Ingenuity Systems), Pathway Studio (Ariadne Genomics), and MetaCore (GeneGo). Pathway enrichment analysis tests if a group of metabolites are involved in a particular pathway compared with random hits. For example, IPA-Metabolomics is a capability within IPA that can extract rich pathway information from metabolomic data. Through pathway analysis, the results from metabolomics study can be compared, confirmed and integrated with other “omics” studies such as transcriptomics 85 and proteomics.
12. Future outlook
While many studies have already benefited from metabolomics, certain issues still need to be addressed to fully utilize the potential of LC-MS in metabolomic studies. Some of these issues and future outlooks are discussed below.
The hyphenation of UPLC to MS can be advantageous for better assignment of metabolites from chromatographic mass signals 86. In the future, as new quadrupole mass analyzers evolve with faster acquisition rate or shorter dwell time, their coupling with advanced HPLC will allow the analysis of hundreds of metabolites or more at once. Therefore SRM will find more applications in monitoring concentration changes of endogenous metabolites in targeted analysis 78. At the same time, for less targeted analyses involving a large number of analytes, full-scan HRMS with high mass resolution and high mass accuracy hold the promise for quantitative metabolomics in the future.
The identification of metabolites is the current bottle-neck in LC-MS-based metabolomic studies. Although it is generally easy to measure the exact mass of a molecular ion detected in LC-MS experiments, mass information alone is often not enough to fully characterize its structure and identify it as a specific biochemical entity. Although novel metabolites continue to be discovered, many of the metabolites we face in practice have already been found and identified in some other studies. The collection and utilization of these “known unknowns” pose major challenges for computational and informatics tools. This is in part because the information is often scattered in different sources, in various formats, and with spectra acquired under different conditions. In addition to data collection, multiple steps are required to fully utilize the information embedded in LC-MS and MS/MS data. Automated acquisition of high-quality MS/MS spectra is needed to increase the throughput of metabolite identification. Improved in-silico fragmentation models of metabolites are needed, which consider complicated ion-molecular interactions encountered in metabolites fragmentation. LC-MS/MS spectral libraries for metabolites, such as HMDB 72, Metlin 74, and MassBank 87, continue to evolve and expand for increased metabolome coverage. In addition, carefully designed experiments and appropriate spectral matching algorithms are desired to ensure spectral libraries from different laboratories and instruments are transferable 34. Last but not least, integration of contextual information into identification can potentially reduce the ambiguity in metabolite identification 88.
Acknowledgments
This work was supported in part by the National Cancer Institute Grant R21CA153176.
References
- 1.Fiehn O. Plant Mol Biol. 2002;48:155–171. [PubMed] [Google Scholar]
- 2.Nicholson JK, Lindon JC, Holmes E. Xenobiotica. 1999;29:1181–1189. doi: 10.1080/004982599238047. [DOI] [PubMed] [Google Scholar]
- 3.Robertson DG. Toxicol Sci. 2005;85:809–822. doi: 10.1093/toxsci/kfi102. [DOI] [PubMed] [Google Scholar]
- 4.Khoo SH, Al-Rubeai M. Biotechnol Appl Biochem. 2007;47:71–84. doi: 10.1042/BA20060221. [DOI] [PubMed] [Google Scholar]
- 5.Goodacre R, Vaidyanathan S, Dunn WB, Harrigan GG, Kell DB. Trends Biotechnol. 2004;22:245–252. doi: 10.1016/j.tibtech.2004.03.007. [DOI] [PubMed] [Google Scholar]
- 6.van der Werf MJ, Takors R, Smedsgaard J, Nielsen J, Ferenci T, Portais JC, Wittmann C, Hooks M, Tomassini A, Oldiges M, et al. Metabolomics. 2007;3:189–194. doi: 10.1007/s11306-007-0080-4. [DOI] [PMC free article] [PubMed] [Google Scholar]
- 7.Griffin JL, Nicholls AW, Daykin CA, Heald S, Keun HC, Schuppe-Koistinen I, Griffiths JR, Cheng LL, Rocca-Serra P, Rubtsov DV, et al. Metabolomics. 2007;3:179–188. [Google Scholar]
- 8.Kind T, Fiehn O. BMC Bioinformatics. 2006;7:234. doi: 10.1186/1471-2105-7-234. [DOI] [PMC free article] [PubMed] [Google Scholar]
- 9.Sumner L, Amberg A, Barrett D, Beale M, Beger R, Daykin C, Fan T, Fiehn O, Goodacre R, Griffin J, Hankemeier T, Hardy N, Harnly J, Higashi R, Kopka J, Lane A, Lindon J, Marriott P, Nicholls A, Reily M, Thaden J, Viant M. Metabolomics. 2007;3:211–221. doi: 10.1007/s11306-007-0082-2. [DOI] [PMC free article] [PubMed] [Google Scholar]
- 10.De Vos RCH, Moco S, Lommen A, Keurentjes JJB, Bino RJ, Hall RD. Nat Protoc. 2007;2:778–791. doi: 10.1038/nprot.2007.95. [DOI] [PubMed] [Google Scholar]
- 11.Zivkovic A, Wiest M, Nguyen U, Davis R, Watkins S, German J. Metabolomics. 2009;5:507–516. doi: 10.1007/s11306-009-0174-2. [DOI] [PMC free article] [PubMed] [Google Scholar]
- 12.Tanja M. Plant Methods. 2010;6:6. [Google Scholar]
- 13.Wuolikainen A, Hedenström M, Moritz T, Marklund SL, Antti H, Andersen PM. Amyotroph Lateral Scler. 2009;10:229–236. doi: 10.1080/17482960902871009. [DOI] [PubMed] [Google Scholar]
- 14.Rai AJ, Gelfand CA, Haywood BC, Warunek DJ, Yi J, Schuchard MD, Mehigh RJ, Cockrill SL, Scott GBI, Tammen H, Schulz-Knappe P, Speicher DW, Vitzthum F, Haab BB, Siest G, Chan DW. Proteomics. 2005;5:3262–3277. doi: 10.1002/pmic.200401245. [DOI] [PubMed] [Google Scholar]
- 15.Lu W, Bennett BD, Rabinowitz JD. J Chromatogr B. 2008;871:236–242. doi: 10.1016/j.jchromb.2008.04.031. [DOI] [PMC free article] [PubMed] [Google Scholar]
- 16.Canelas AB, Ras C, ten Pierick A, van Dam JC, Heijnen JJ, van Gulik WM. Metabolomics. 2008;4:226–239. [Google Scholar]
- 17.Taymaz-Nikerel H, De Mey M, Ras C, Ten Pierick A, Seifar RM, Van Dam JC, Heijnen JJ, Van Gulik WM. Anal Biochem. 2009;386:9–19. doi: 10.1016/j.ab.2008.11.018. [DOI] [PubMed] [Google Scholar]
- 18.Rabinowitz JD, Kimball E. Anal Chem. 2007;79:6167–6173. doi: 10.1021/ac070470c. [DOI] [PubMed] [Google Scholar]
- 19.Canelas AB, ten Pierick A, Ras C, Seifar RM, van Dam JC, van Gulik WM, Heijnen JJ. Anal Chem. 2009;81:7379–7389. doi: 10.1021/ac900999t. [DOI] [PubMed] [Google Scholar]
- 20.Mitra S. Sample preperation techniques in analytical chemistry. Wiley; 2003. [Google Scholar]
- 21.Peterson ZD, Lee ML, Graves SW. Journal of Chromatography B. 2004;810:101–110. doi: 10.1016/j.jchromb.2004.07.022. [DOI] [PubMed] [Google Scholar]
- 22.Hernández-Borges J, Borges-Miquel TM, Rodríguez-Delgado MÁ, Cifuentes A. J Chromatogr A. 2007;1153:214–226. doi: 10.1016/j.chroma.2006.10.070. [DOI] [PubMed] [Google Scholar]
- 23.Idborg-Björkman H, Edlund PO, Kvalheim OM, Schuppe-Koistinen I, Jacobsson SP. Analytical Chemistry. 2003;75:4784–4792. doi: 10.1021/ac0341618. [DOI] [PubMed] [Google Scholar]
- 24.Masson P, Alves AC, Ebbels TMD, Nicholson JK, Want EJ. Anal Chem. 2010;82:7779–7786. doi: 10.1021/ac101722e. [DOI] [PubMed] [Google Scholar]
- 25.Theodoridis G, Gika H, Franceschi P, Caputi L, Arapitsas P, Scholz M, Masuero D, Wehrens R, Vrhovsek U, Mattivi F. Metabolomics. 2011:1–11. In Press. [Google Scholar]
- 26.Álvarez-Sánchez B, Priego-Capote F, Castro MDLd. TrAC, Trends Anal Chem. 2010;29:120–127. [Google Scholar]
- 27.Dettmer K, Aronov PA, Hammock BD. Mass Spectrom Rev. 2007;26:51–78. doi: 10.1002/mas.20108. [DOI] [PMC free article] [PubMed] [Google Scholar]
- 28.Krauss M, Singer H, Hollender J. Anal Bioanal Chem. 2010;397:943–951. doi: 10.1007/s00216-010-3608-9. [DOI] [PubMed] [Google Scholar]
- 29.Yates JR, Ruse CI, Nakorchevsky A. Annual Review of Biomedical Engineering. 2009;11:49–79. doi: 10.1146/annurev-bioeng-061008-124934. [DOI] [PubMed] [Google Scholar]
- 30.Gelpí E. J Mass Spectrom. 2009;44:1137–1161. doi: 10.1002/jms.1621. [DOI] [PubMed] [Google Scholar]
- 31.Schellinger AP, Carr PW. J Chromatogr A. 2006;1109:253–266. doi: 10.1016/j.chroma.2006.01.047. [DOI] [PubMed] [Google Scholar]
- 32.Bowen BP, Northen TR. J Am Soc Mass Spectrom. 2010;21:1471–1476. doi: 10.1016/j.jasms.2010.04.003. [DOI] [PubMed] [Google Scholar]
- 33.Guillarme D, Nguyen DTT, Rudaz S, Veuthey JL. J Chromatogr A. 2007;1149:20–29. doi: 10.1016/j.chroma.2006.11.014. [DOI] [PubMed] [Google Scholar]
- 34.Hopley C, Bristow T, Lubben A, Simpson A, Bull E, Klagkou K, Herniman J, Langley J. Rapid Commun Mass Spectrom. 2008;22:1779–1786. doi: 10.1002/rcm.3545. [DOI] [PubMed] [Google Scholar]
- 35.Milman BL. Rapid Commun Mass Spectrom. 2005;19:2833–2839. doi: 10.1002/rcm.2131. [DOI] [PubMed] [Google Scholar]
- 36.Cho H, Kim Y-j, Jung HJ, Lee S-W, Lee JW. Bioinformatics. 2008;24:882–884. doi: 10.1093/bioinformatics/btn012. [DOI] [PubMed] [Google Scholar]
- 37.Schulz-Trieglaff O, Machtejevas E, Reinert K, Schluter H, Thiemann J, Unger K. BioData Min. 2009;2:4. doi: 10.1186/1756-0381-2-4. [DOI] [PMC free article] [PubMed] [Google Scholar]
- 38.Bylund D. Doctoral thesis. Mid Sweden University; 2001. [Google Scholar]
- 39.Wang W, Zhou H, Lin H, Roy S, Shaler TA, Hill LR, Norton S, Kumar P, Anderle M, Becker CH. Anal Chem. 2003;75:4818–4826. doi: 10.1021/ac026468x. [DOI] [PubMed] [Google Scholar]
- 40.Tautenhahn R, Bottcher C, Neumann S. BMC Bioinformatics. 2008;9:504. doi: 10.1186/1471-2105-9-504. [DOI] [PMC free article] [PubMed] [Google Scholar]
- 41.Aberg KM, Torgrip RJO, Kolmert J, Schuppe-Koistinen I, Lindberg J. J Chromatogr A. 2008;1192:139–146. doi: 10.1016/j.chroma.2008.03.033. [DOI] [PubMed] [Google Scholar]
- 42.Stolt R, Torgrip RJO, Lindberg J, Csenki L, Kolmert J, Schuppe-Koistinen I, Jacobsson SP. Anal Chem. 2006;78:975–983. doi: 10.1021/ac050980b. [DOI] [PubMed] [Google Scholar]
- 43.Smith CA, Want EJ, O’Maille G, Abagyan R, Siuzdak G. Anal Chem. 2006;78:779–787. doi: 10.1021/ac051437y. [DOI] [PubMed] [Google Scholar]
- 44.Yu T, Peng H. BMC Bioinformatics. 2010;11:559. doi: 10.1186/1471-2105-11-559. [DOI] [PMC free article] [PubMed] [Google Scholar]
- 45.Nielsen NPV, Carstensen JM, Smedsgaard J. J Chromatogr A. 1998;805:17–35. [Google Scholar]
- 46.Wang CP, Isenhour TL. Anal Chem. 1987;59:649–654. [Google Scholar]
- 47.Lange E, Tautenhahn R, Neumann S, Gropl C. BMC Bioinformatics. 2008;9:375. doi: 10.1186/1471-2105-9-375. [DOI] [PMC free article] [PubMed] [Google Scholar]
- 48.Tautenhahn R, Böttcher C, Neumann S. In: Bioinformatics Research and Development. Hochreiter S, Wagner R, editors. Vol. 4414. Springer; Berlin / Heidelberg: 2007. pp. 371–380. [Google Scholar]
- 49.Ipsen A, Want EJ, Lindon JC, Ebbels TMD. Anal Chem. 2010;82:1766–1778. doi: 10.1021/ac902361f. [DOI] [PMC free article] [PubMed] [Google Scholar]
- 50.Sysi-Aho M, Katajamaa M, Yetukuri L, Oresic M. BMC Bioinformatics. 2007;8:93. doi: 10.1186/1471-2105-8-93. [DOI] [PMC free article] [PubMed] [Google Scholar]
- 51.Warrack BM, Hnatyshyn S, Ott KH, Reily MD, Sanders M, Zhang H, Drexler DM. J Chromatogr B. 2009;877:547–552. doi: 10.1016/j.jchromb.2009.01.007. [DOI] [PubMed] [Google Scholar]
- 52.Katajamaa M, Oresic M. BMC Bioinformatics. 2005;6:179. doi: 10.1186/1471-2105-6-179. [DOI] [PMC free article] [PubMed] [Google Scholar]
- 53.Lommen A. Anal Chem. 2009;81:3079–3086. doi: 10.1021/ac900036d. [DOI] [PubMed] [Google Scholar]
- 54.Brodsky L, Moussaieff A, Shahaf N, Aharoni A, Rogachev I. Anal Chem. 2010;82:9177–9187. doi: 10.1021/ac101216e. [DOI] [PubMed] [Google Scholar]
- 55.Wikoff WR, Gangoiti JA, Barshop BA, Siuzdak G. Clin Chem. 2007;53:2169–2176. doi: 10.1373/clinchem.2007.089011. [DOI] [PubMed] [Google Scholar]
- 56.Sreekumar A, Poisson LM, Rajendiran TM, Khan AP, Cao Q, Yu J, Laxman B, Mehra R, Lonigro RJ, Li Y, Nyati MK, Ahsan A, Kalyana-Sundaram S, Han B, Cao X, Byun J, Omenn GS, Ghosh D, Pennathur S, Alexander DC, Berger A, Shuster JR, Wei JT, Varambally S, Beecher C, Chinnaiyan AM. Nature. 2009;457:910–914. doi: 10.1038/nature07762. [DOI] [PMC free article] [PubMed] [Google Scholar] [Research Misconduct Found]
- 57.Storey J. In: International Encyclopedia of Statistical Science. 1. Lovric M, editor. Springer; 2011. p. 1673. [Google Scholar]
- 58.Chen C, Krausz KW, Shah YM, Idle JR, Gonzalez FJ. Chem Res Toxicol. 2009;22:699–707. doi: 10.1021/tx800464q. [DOI] [PMC free article] [PubMed] [Google Scholar]
- 59.Arbona V, Iglesias DJ, Talón M, Gómez-Cadenas A. J Agric Food Chem. 2009;57:7338–7347. doi: 10.1021/jf9009137. [DOI] [PubMed] [Google Scholar]
- 60.Kim K, Aronov P, Zakharkin SO, Anderson D, Perroud B, Thompson IM, Weiss RH. Mol Cell Proteomics. 2009;8:558–570. doi: 10.1074/mcp.M800165-MCP200. [DOI] [PMC free article] [PubMed] [Google Scholar]
- 61.Kim JK, Bamba T, Harada K, Fukusaki E, Kobayashi A. J Exp Bot. 2007;58:415–424. doi: 10.1093/jxb/erl216. [DOI] [PubMed] [Google Scholar]
- 62.Hageman J, Malosetti M, van Eeuwijk F. Euphytica. 2010:1–11. [Google Scholar]
- 63.Yin P, Zhao X, Li Q, Wang J, Li J, Xu G. J Proteome Res. 2006;5:2135–2143. doi: 10.1021/pr060256p. [DOI] [PubMed] [Google Scholar]
- 64.Wopereis S, Rubingh CM, van Erk MJ, Verheij ER, van Vliet T, Cnubben NHP, Smilde AK, van der Greef J, van Ommen B, Hendriks HFJ. PLoS ONE. 2009;4:e4525. doi: 10.1371/journal.pone.0004525. [DOI] [PMC free article] [PubMed] [Google Scholar]
- 65.Enot D, Beckmann M, Draper J. Computational Life Sciences II. 2006:226–235. [Google Scholar]
- 66.Guan W, Zhou M, Hampton C, Benigno B, Walker LD, Gray A, McDonald J, Fernandez F. BMC Bioinformatics. 2009;10:259. doi: 10.1186/1471-2105-10-259. [DOI] [PMC free article] [PubMed] [Google Scholar]
- 67.Bijlsma S, Bobeldijk I, Verheij ER, Ramaker R, Kochhar S, Macdonald IA, van Ommen B, Smilde AK. Anal Chem. 2005;78:567–574. doi: 10.1021/ac051495j. [DOI] [PubMed] [Google Scholar]
- 68.Xia J, Psychogios N, Young N, Wishart DS. Nucleic Acids Res. 2009;37:W652–660. doi: 10.1093/nar/gkp356. [DOI] [PMC free article] [PubMed] [Google Scholar]
- 69.Patterson AD, Li H, Eichler GS, Krausz KW, Weinstein JN, Fornace AJ, Gonzalez FJ, Idle JR. Anal Chem. 2008;80:665–674. doi: 10.1021/ac701807v. [DOI] [PMC free article] [PubMed] [Google Scholar]
- 70.Beecher CWW. In: Metabolic Profiling: Its Role in Biomarker Discovery and Gene Function Analysis. 1. George RG, Harrigan G, editors. Springer; 2003. p. 352. [Google Scholar]
- 71.Wink M. TAG Theoretical and Applied Genetics. 1988;75:225–233. [Google Scholar]
- 72.Wishart DS, Tzur D, Knox C, Eisner R, Guo AC, Young N, Cheng D, Jewell K, Arndt D, Sawhney S, Fung C, Nikolai L, Lewis M, Coutouly MA, Forsythe I, Tang P, Shrivastava S, Jeroncic K, Stothard P, Amegbey G, Block D, Hau DD, Wagner J, Miniaci J, Clements M, Gebremedhin M, Guo N, Zhang Y, Duggan GE, Macinnis GD, Weljie AM, Dowlatabadi R, Bamforth F, Clive D, Greiner R, Li L, Marrie T, Sykes BD, Vogel HJ, Querengesser L. Nucleic Acids Res. 2007;35:D521–526. doi: 10.1093/nar/gkl923. [DOI] [PMC free article] [PubMed] [Google Scholar]
- 73.Cui Q, Lewis IA, Hegeman AD, Anderson ME, Li J, Schulte CF, Westler WM, Eghbalnia HR, Sussman MR, Markley JL. Nat Biotechnol. 2008;26:162–164. doi: 10.1038/nbt0208-162. [DOI] [PubMed] [Google Scholar]
- 74.Smith CA, Maille GO, Want EJ, Qin C, Trauger SA, Brandon TR, Custodio DE, Abagyan R, Siuzdak G. Ther Drug Monit. 2005;27:747–751. doi: 10.1097/01.ftd.0000179845.53213.39. [DOI] [PubMed] [Google Scholar]
- 75.Go E. J Neuroimmune Pharmacol. 2010;5:18–30. doi: 10.1007/s11481-009-9157-3. [DOI] [PubMed] [Google Scholar]
- 76.Giavalisco P, Köhl K, Hummel J, Seiwert B, Willmitzer L. Anal Chem. 2009;81:6546–6551. doi: 10.1021/ac900979e. [DOI] [PubMed] [Google Scholar]
- 77.Baty JD, Robinson PR. Biomed Mass Spectrom. 1977;4:36–41. doi: 10.1002/bms.1200040104. [DOI] [PubMed] [Google Scholar]
- 78.Griffiths WJ, Koal T, Wang Y, Kohl M, Enot DP, Deigner HP. Angew Chem Int Ed. 2010;49:5426–5445. doi: 10.1002/anie.200905579. [DOI] [PubMed] [Google Scholar]
- 79.Scheltema RA, Kamleh A, Wildridge D, Ebikeme C, Watson DG, Barrett MP, Jansen RC, Breitling R. Proteomics. 2008;8:4647–4656. doi: 10.1002/pmic.200800314. [DOI] [PubMed] [Google Scholar]
- 80.Wong RL, Xin B, Olah T. Bioanalysis. 2011;3:863–871. doi: 10.4155/bio.11.37. [DOI] [PubMed] [Google Scholar]
- 81.Guo K, Li L. Anal Chem. 2010;82:8789–8793. doi: 10.1021/ac102146g. [DOI] [PubMed] [Google Scholar]
- 82.Stroh JG, Petucci CJ, Brecker SJ, Huang N, Lau JM. J Am Soc Mass Spectrom. 2007;18:1612–1616. doi: 10.1016/j.jasms.2007.06.001. [DOI] [PubMed] [Google Scholar]
- 83.Ow SY, Noirel J, Salim M, Evans C, Watson R, Wright PC. PROTEOMICS. 2010;10:2205–2213. doi: 10.1002/pmic.200900746. [DOI] [PubMed] [Google Scholar]
- 84.Xia J, Wishart DS. Nucleic Acids Res. 2010;38:W71–W77. doi: 10.1093/nar/gkq329. [DOI] [PMC free article] [PubMed] [Google Scholar]
- 85.Kankainen M, Gopalacharyulu P, Holm L, Orešič M. Bioinformatics. 2011 [Google Scholar]
- 86.Guillarme D, Schappler J, Rudaz S, Veuthey JL. TrAC, Trends Anal Chem. 2010;29:15–27. [Google Scholar]
- 87.Horai H, Arita M, Kanaya S, Nihei Y, Ikeda T, Suwa K, Ojima Y, Tanaka K, Tanaka S, Aoshima K, Oda Y, Kakazu Y, Kusano M, Tohge T, Matsuda F, Sawada Y, Hirai MY, Nakanishi H, Ikeda K, Akimoto N, Maoka T, Takahashi H, Ara T, Sakurai N, Suzuki H, Shibata D, Neumann S, Iida T, Tanaka K, Funatsu K, Matsuura F, Soga T, Taguchi R, Saito K, Nishioka T. J Mass Spectrom. 2010;45:703–714. doi: 10.1002/jms.1777. [DOI] [PubMed] [Google Scholar]
- 88.Rogers S, Scheltema RA, Girolami M, Breitling R. Bioinformatics. 2009;25:512–518. doi: 10.1093/bioinformatics/btn642. [DOI] [PubMed] [Google Scholar]