From the physics of interacting polymers to optimizing routes on the London Underground (original) (raw)
Abstract
Optimizing paths on networks is crucial for many applications, ranging from subway traffic to Internet communication. Because global path optimization that takes account of all path choices simultaneously is computationally hard, most existing routing algorithms optimize paths individually, thus providing suboptimal solutions. We use the physics of interacting polymers and disordered systems to analyze macroscopic properties of generic path optimization problems and derive a simple, principled, generic, and distributed routing algorithm capable of considering all individual path choices simultaneously. We demonstrate the efficacy of the algorithm by applying it to: (i) random graphs resembling Internet overlay networks, (ii) travel on the London Underground network based on Oyster card data, and (iii) the global airport network. Analytically derived macroscopic properties give rise to insightful new routing phenomena, including phase transitions and scaling laws, that facilitate better understanding of the appropriate operational regimes and their limitations, which are difficult to obtain otherwise.
Path optimization affects many of our daily activities. Although much attention has been dedicated to routing algorithms for Internet applications, such as instant messengers and peer-to-peer systems (1, 2), many other essential routing applications have attracted less attention, ranging from water distribution networks (3) to sensor networks (4), military convoy movements (5), and journey planners (6, 7). In many applications, enormous costs are incurred due to traffic congestion or nonessential and redundant capacity. Due to the computational costs involved, most existing routing algorithms are static and based on selfish decisions, with nonadaptive routing tables indicating the shortest path to destinations regardless of local traffic (8, 9). Dynamic routing protocols do exist, but they are either heuristic, probabilistic, or insensitive to other individual path decisions that dynamically constitute the traffic (10, 11). A more global approach that takes into account all individual path decisions is crucial for efficient use of overstretched infrastructure. For instance, one may suppress congestion by minimizing overlaps with other routes or decrease the number of active nodes by consolidating paths to reduce infrastructure demands or energy consumption. The latter is particularly important in the context of the Internet because it can consume up to 4% of the electricity generated (12). Future applications include individualized routing and optimal resource management of prebooked air and road traffic.
The difficulty in deriving a globally optimal algorithm, in contrast to greedy local ones, lies in the simultaneous assignment of multiple interacting paths to minimize a global cost, because the optimal path between any particular source–destination pair depends on all other path choices. Such interaction is highly nonlocal, because paths between different source–destination pairs may partially overlap. Existing algorithms either ignore these interactions (8, 9) or use heuristics to approximate them (10, 11); both approaches result in suboptimal solutions. A substantial effort has been devoted to the development of highly efficient routing methods: for instance, multicommodity flow algorithms (13–19). However, most methods are based on weighted linear objective functions and real variables, and they aim specifically at satisfying capacity constraints; they have limited flexibility in addressing the variety of nonlinear cost functions one may want to optimize in different scenarios, especially concave costs and integer variables. A more detailed discussion is provided in SI Appendix, section S4.
Here, we utilize statistical physics-based methods used in the study of interacting polymers (20) and spin glasses (21, 22) to obtain both a macroscopic description of the routing problem and microscopic solutions for given instances; the latter leads to a simple, generic, and distributed routing optimization algorithm. The algorithm resembles message-passing techniques that have been developed independently in a number of disciplines (21, 23, 24) and have been successfully applied to a variety of problems, ranging from prototyping (25) to solving hard computational problems (26) and control of complex systems (27). Here, we demonstrate the potential and efficacy of our routing algorithm by applying it to random networks, individualized routing on the London subway network, and the global airport network. Together with other benchmark tests described in SI Appendix, we demonstrate that our algorithm achieves better optimization compared with existing heuristics and state-of-the-art approximation algorithms in various routing scenarios; moreover, it is distributed and principled and does not require fine-tuning of free parameters.
In addition to the significant algorithmic advances, several macroscopic phenomena, including a phase transition, scaling rules as a function of network size, and nonmonotonic growth in mean path length as a function of traffic volume, are revealed; these cannot be obtained by numerical studies and provide unique insights and understanding of optimal routing on sparse networks.
Model
Consider a system of M polymers interacting on a network of N nodes. Each node  is connected to
  neighbors denoted by the set
  and the connectivity matrix
  when i and j are connected and is zero otherwise. Each polymer
  has two fixed ends and occupies a path described by a self-avoiding walk on the network (i.e., consecutive segments occupy topological neighbors and each polymer ν goes through a node at most once). We denote the variable
  when polymer ν occupies node i and
  otherwise, and the number of polymers occupying i as
  . To penalize or encourage polymer overlap, we define the Hamiltonian
  to be a nonlinear function of the normalized flow
  , namely,

The analytical solution and derived algorithm are generic for any ϕ. Although the current framework focuses on undirected polymers and costs that incur at vertices, it is clear that costs may incur at the edges and edges may be directed and weighted in some applications. Our framework, derivation, and algorithms accommodate costs on edges (using a factor graph representation), as well as directed and weighted polymers, making them suitable for most routing scenarios. The derivation and corresponding algorithms are given in SI Appendix, section S3. We would like to point out that the algorithm presented below already accommodates directed traffic.
This model is equivalent to a setting of M source–destination pairs, which we term “communications,” each of which occupies a path on a network with N nodes. The variable  is thus the normalized traffic on node i, and
  is the corresponding cost function. In the physical framework and the zero-temperature limit, we minimize
  to obtain the ground state of the system or the optimal path configuration of the corresponding routing system. Some simple forms of
  are already meaningful; for instance,
  , where the cases with
  penalize overlaps to suppress congestion, whereas
  encourages overlaps to aggregate traffic (28–30). The case of
  reduces to
  , whose ground state corresponds to shortest path routing.
Methods
Theoretical Approach.
The main obstacle in accounting for the interaction between paths is in keeping track of the cost at local nodes or edges while maintaining path integrity between the two end points and avoiding redundant loops. Therefore, in addition to the cost at the various nodes, given by Eq. 1, we have introduced a technique used in polymer physics (20) in the study of self-avoiding walks (31, 32) to enforce the appropriate path constraints.
The method is based on representing each node as an _n_-component vector  of length
  . Denoting the angular integration over
  as
as  , it has been shown (20) that all positive moments of
  vanish in the limit
  , except the second moment
  , for any component a in
  , where
  is a normalization constant. It is then implied that when
  , all nonvanishing terms that contribute in

are of the form  , where
  represents the _i_th node index of the corresponding path/polymer segment; these sequences represent self-avoiding paths over nodes
  , joining the end nodes x and y (20). Each node that is part of these paths incurs a cost as in Eq. 1; a sum over all possible paths of all communications provides the partition function
  , as detailed in SI Appendix, section S1.1. To obtain typical macroscopic properties, one needs to average
  over topologies (given a degree distribution) and node pair choices, termed “quenched disorders” in statistical physics. This requires the use of the replica or cavity method of spin glass theory (21, 22), as presented in SI Appendix, section S1.
The aim of the analysis is twofold.
- i) At the macroscopic level, we derive the stable traffic distribution
 in the limit of very large systems to obtain the average cost (energy)
  ; the average path length, given by the total occupancy divided by M (i.e.,
  ); and the average fraction of idle nodes, given by
  , as detailed in SI Appendix, section S1.4. Angled brackets denote an average over
  , which includes averages over all variable states for a given network and over choices of network and end-point instances.
 - ii) At the microscopic level, the cavity-based analysis (33) translates to an algorithm that optimizes path configuration in a principled, distributed, and computationally efficient manner.
Optimization Algorithm.
The analytical solutions for infinite systems translate into an optimization algorithm valid for finite systems, as detailed in SI Appendix, section S2. The derived algorithm is based on sending a couple of messages  and
and  at the zero temperature limit, from node j to node i for each index ν; these characterize the energy contributions of communication ν at edge
  , originated from the source and destination directions, respectively. The messages take the form:


where  for source and destination, respectively, and is zero otherwise; the general cost function ϕ and the set of nodes in the neighborhood of node j are denoted as
  . The value of
  is given by the solution of
  in
in

The step function  takes values
  for
for  , and
, and  , respectively. Solutions of Eq. 5 are obtained by setting
  and a test integer I starting from
  until a self-consistent
  is found. Finally, after the set of messages in Eqs. 3 and 4 converges to nonfluctuating values, the optimal configuration of path ν on each node j is given by

where  is the solution of Eq. 5 after convergence and
  if the communication ν passes through node j and zero otherwise. The generalized algorithms that accommodate weighted and directed communications, generic costs on nodes and edges, and separate costs defined on directed edges are given in SI Appendix, section S3. The computational complexities of these algorithms are discussed in SI Appendix, section S2.2.
In some instances, the iterative equations fail to converge; this suggests that solution space in the infinite system case is fragmented and nonergodic; this corresponds to “replica symmetry breaking” (21, 22), a complicated energy landscape with numerous local minima that typically hinder algorithmic convergence (details are provided in SI Appendix, section S5). This is typical in the case of hard computational problems. Convergence is improved by assigning a random bias  to each node (34), akin to an external field, guiding the system to one of the local minima. These biases can be easily incorporated in the present formulism by replacing
  with
with  for each node i, such that
  . In cases where a large number of source–destination pairs are identical, we further replace
  by
by  for each communication ν to break the degeneracy brought about by Eq. 5. Details can be found in SI Appendix, section S2.1.
Results
Microscopic Solution: Finding Best Paths.
Using the suggested algorithm, we can optimize path choices using the cost  . We illustrate the characteristic results obtained by applying the algorithm using two costs, with
  (convex,
  ) and
) and  (concave,
  ), to a system of 10 source–destination pairs communicating on a random regular graph with
  and
and  , as shown in Fig. 1.
Fig. 1.

Optimized path configurations on a regular random network. The network comprises 50 nodes (each with  ) and 10 source–destination pairs. The corresponding costs are
  (A) and
  (B). The path of each communication is illustrated by nodes and edges of a specific color, whereas black nodes are shared by more than one path. The size of a node is proportional to the amount of traffic through it, and square nodes represent the source or destination of each communication. Networks are visualized by the NetDraw software (40).
Fig. 1_A_ demonstrates how a cost with  penalizes congestion: The blue, orange, and violet communications are routed via nonshortest paths to avoid overlap, especially in the central congested part of the network. This holds when traffic is heavy and one aims to distribute it uniformly. In contrast to the reduced-congestion solutions, Fig. 1_B_ shows solutions obtained for
  , aimed at concentrating traffic. More specifically, the blue, orange, and violet communications in Fig. 1_B_ are all routed via the central congested part of the network that mainly consists of source and destination nodes, making best use of these nodes as relays and leaving many of the other nodes idle. In the case of the Internet or transportation networks, idle nodes can be switched off to save resources.
To demonstrate the efficacy of the algorithm for more realistic systems, we examine the performance of the algorithm on the London subway network based on real passenger source–destination data obtained by the Oyster card system (35). We report results for vertex costs only, but similar pictures have been obtained for edge costs and directed traffic. Fig. 2_A_ shows how congestion is reduced by the algorithm when  ; traffic is fairly uniform, even in the central region (Fig. 2_A_, Inset), at the cost of longer individual routes for global optimization. Table 1 shows that the cost
  obtained by our algorithm is 20.5% smaller than that of the shortest path configuration obtained by the commonly used Dijkstra algorithm (9), with only a slight increase in average path length by 5.8%. Practically, traffic optimization of this type may be achieved through differential pricing or by auxiliary information provided either individually or globally. On the other hand, when
  is used, paths for the same passenger set are consolidated at major routes and stations, as shown in Fig. 2_B_. Although the size of some of the nodes increases, other branches, such as the ones passing through “Holborn” and “Great Portland Street” (Fig. 2_B_, Inset), are almost idle. This scenario may be relevant at times when the service is reduced for some reason (e.g., a strike or at late evening); service on the shared branches can remain active, whereas the frequency of other less heavily loaded services decreases.
Fig. 2.

Optimized traffic on the London subway network. A total of 218 real passenger source–destination pairs are optimized, corresponding to 5% of the data recorded by the Oyster card system between 8:30 AM and 8:31 AM on one Wednesday in November 2009 (35). The network consists of 275 stations. The corresponding costs are  (A) and
  (B). Red nodes correspond to stations with nonzero traffic. The size of each node and the thickness of each edge are proportional to traffic through them. (Insets) Zoomed-in views of the central region. Nodes are drawn according to their geographic position.
Table 1.
A comparison between average cost as well as path length obtained by our algorithm (P) and the Dijkstra algorithm (D)
To compare the solutions obtained in the two scenarios better, we plotted the corresponding traffic at individual stations for the London Underground dataset in descending order (for  ), as shown in Fig. 3, Inset. The optimized states of
  show less traffic for overloaded stations and higher traffic for less heavily loaded ones (e.g., “Green Park”).
Fig. 3.

Optimized traffic at individual airports and London subway stations (Inset). The airports and stations are plotted in descending order of traffic in the optimized state of  (red lines). Symbols (
 ) in blue correspond to the optimized traffic with
  . Squared symbols refer to airports and stations mentioned in the main text that have much higher traffic than that indicated by the red lines. The optimized airport traffic is obtained from the single instance shown in Fig. 5, and the optimized subway traffic is obtained by averaging over the 30 passenger sets as in Table 1.
Similar experiments were carried out on the global airport network (36). Applying the optimization algorithm (3, 4) to the data, one obtains the results presented in Figs. 3 and 4. Similar trends to those of the subway network are observed: Air traffic consolidates at airports that are on main routes in the case of  , such as Frankfurt, Toronto, and Beijing, whereas several popular airports, such as Tokyo, Newark, and Hong Kong, show reduced air traffic in the case of
  , as represented by the red line in Fig. 3. Table 1 shows the cost obtained by our algorithm when
  is 56% lower than the cost obtained by the Dijkstra algorithm’s shortest paths, with a slight increase in path length of 6.2%. This may be due to the availability of a large number of alternative paths in the airport network. We note that a lower cost is also achieved in the case of
  . These results show that our algorithm optimizes a given generic cost at a price of modest increase in the average path length.
Fig. 4.

Optimized traffic at individual airports of the global air network. A total of 2,480 airports constitute nodes, whereas the edges represent the existence of direct flights between airport pairs (36). Because the real demand in terms of source–destination pairs is unavailable, it was artificially generated by selecting a set of 300 randomly drawn source–destination pairs. Red nodes correspond to airports with nonzero traffic; the size of nodes indicates the air traffic through particular airports, and edges are omitted for clarity. (A) For  , traffic is routed to be almost uniformly distributed to reduce congestion. (B) For
  , air traffic consolidates at the main hubs.
To evaluate the performance of the suggested algorithm (with  only), we compared our results against those obtained using a representative state-of-the-art congestion-aware routing algorithm, which we call the “min-cap” (MC) algorithm (13), based on multicommodity flow. Because the latter aims to optimize a linear cost, we have introduced a tunable parameter α such that the quadratic cost is optimized by an extensive search for an optimal
  (SI Appendix, Fig. S8). Details are provided in SI Appendix, section S4. We emphasize that this comparison is limited to congestion-aware algorithms (
 ) because we have not identified existing efficient optimization algorithms for concave costs that facilitate route consolidation (e.g., the results shown in Figs. 1_B_, 2_B_, and 4_B_).
Table 2 shows a modest gain in cost over the optimized MC results at individual  for each run, which is far less than the gain obtained with respect to the Dijkstra algorithm. Nevertheless, our algorithm provides a lower energy for all α values, which is unachievable by the MC algorithm even after fine-tuning (SI Appendix, Fig. S8). Our algorithm also results in a shorter average path length L in addition to a lower cost E in random regular graphs (SI Appendix, Table S1) used as a controlled benchmark problem. Moreover, it is distributed and principled; does not require fine-tuning of free parameters; and, most importantly, has the flexibility to accommodate any (nonpathological) cost function designed to address specific needs.
Table 2.
A comparison between average cost as well as path length obtained by our algorithm (P) and the modified min-cap (MC) algorithm
Path Adaptivity.
Fig. 5 illustrates the adaptivity of our algorithm after removing the London subway station “Bank” (black node). Nodes and edges in Fig. 5 that show an increase (decrease) in optimized traffic are colored red (blue), respectively, with their size and thickness proportional to the magnitude of increase (decrease). Nodes and edges in Fig. 5 with no traffic changes are shown in white and black, respectively. In the case of optimization using  , the original traffic through Bank is rerouted either via “Embankment” or via “Old Street.” This redistribution of traffic cannot be achieved by ordinary algorithms, such as routing tables, the shortest path, or minimal weight routing, without taking into account the interaction between paths.
Fig. 5.

Changes in optimized traffic in the central London subway network after the removal of the station “Bank” (black node). The corresponding costs are  (A) and
  (B). Nodes and edges that show an increase (decrease) in traffic appear in red (blue), where their size and thickness correspond to the magnitude of increase (decrease). Nodes and edges with no traffic changes appear in white and black, respectively. Passenger source–destination pairs are identical to those of Fig. 3, except for the removal of pairs starting or ending destinations in Bank.
On the other hand, in the case of  , almost all the original traffic through Bank is diverted to Old Street. Because the original traffic via Bank is substantial (Fig. 2_B_, Inset), significant changes at some stations have to be made, although only a small number of stations are subject to rerouting compared with the case of
  .
.
Macroscopic Behavior in Routing.
In addition to the microscopic solutions obtained, we would like to explore the macroscopic behavior of the system. We first examine the dependence of average path length  on the number of interacting communications M. Random regular networks and Erdös–Rényi (ER) and scale-free (SF) graphs are studied because they serve as standard benchmark problems and resemble overlay networks on the Internet. Theoretical results are obtained by solving numerically a set of recursive equations described in SI Appendix, section S1.4; simulation results are obtained using Eqs. 3 and 4. Fig. 6_A_ (Inset) shows results obtained for random regular graphs. Two remarkable phenomena are observed for both
  and
and  : (i) average path length
  peaks at intermediate M instead of increasing monotonously, and (ii) it approaches asymptotically the shortest path
  as
as  (formally, the value of
  when
when  ). Small deviations between theory and simulations are due to finite size effects.
Fig. 6.

Dependence of the optimized state on the number of communications. Rescaled path length 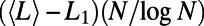 (A) and the cost difference
  (B) (D and P stand for the Dijkstra algorithm and our algorithm, respectively) as a function of the rescaled number of communications,
  , for random regular graphs with n = 100, 200, 500, and 1,000 and
  ; results were obtained for
  . The value of
  in A corresponds to the value of the shortest path
  . (Insets)
  (A) and
 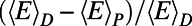 (B) are shown as a function of M for
  on random regular graphs of degree
  , with cost exponents
  and
and  . The error bars for simulation results are of the order of the symbol size. All simulation results are averaged over 2,000 realizations. Sim, simulation; Theo, theory.
The observed nonmonotonic trends imply the existence of interesting routing phenomena. In the case of  , nonmonotonic trends imply that the system is very sensitive to congestion in the intermediate range of M. Particularly when M is small, many communications are routed through longer routes because they face stiff competition for shorter ones. However, as M increases further, traffic become more homogeneous and
  decreases because communications are routed via shorter routes because longer ones are equally congested, matching the experience of frustrated drivers on congested roads. This is reflected in the lower cost obtained by our algorithm in comparison to the Dijkstra algorithm, which peaks at 20% for intermediate M as shown in Fig. 6_B_. A similar trend is observed for
  as different communications cooperate to share routes in the intermediate range of M. As M increases further, traffic becomes more homogeneous and there is less advantage to prefer a busy but longer route, making shorter routes more cost-effective. We note that the peak in
  for the case of
  occurs at a smaller M value compared with
  , implying that traffic homogeneity is achieved at smaller M in the case of
  .
.
Although similar behaviors are observed for ER graphs (SI Appendix, section S6), SF networks show a much slower decrease of  after attaining its maximum, possibly due to the intrinsic node degree inhomogeneity that leads to traffic inhomogeneity even at large M. This suggests that shortest path routing is effective when M is large and topology is homogeneous but not in networks with a high degree of variability.
The scaling property of path lengths is shown in Fig. 6_A_. Rescaled path lengths  with
with  at system sizes n = 100, 200, 500, and 1,000, plotted as a function of the rescaled number of communications,
 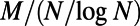 , fall on top of each other almost identically. A similar data collapse is also observed in ER graphs shown in SI Appendix, section S4. This finding implies that the nonmonotonic behavior observed for path lengths, and thus the network sensitivity to congestion, depends on M and N only through
  . The latter is roughly proportional to the average traffic on a node because
  is proportional to the average shortest distance between any two nodes in random regular networks (37, 38) and ER graphs (39). In other words, the optimal behavior of routing on these graphs depends only on the average node traffic, regardless of system size and number of communications. The rescaling also appears in the reduced cost obtained by our algorithm, as shown in Fig. 6_B_. Note that theoretical results have been obtained in the infinite system limit; finite N values for theoretical results have been introduced merely to determine the scaling properties of M.
We have also examined the fraction of idle nodes as a function of γ. This revealed a phase transition, an abrupt change in the fraction of idle nodes around the  value (SI Appendix, section S7 and Fig. S11). The implication is that even a small change in the power γ is sufficient to power down unnecessary routers or close redundant subway stations effectively, with little impact on the cost or average route length.
Discussion
Optimal routing is one of many hard problems on networks that one should tackle to use limited and usually overstretched resources efficiently. The common characteristic of these problems is their global nature, and thus the difficulty in solving them at both macroscopic and microscopic levels with limited computational resources. By applying methods from the physics of interacting polymers and disordered systems, we obtained typical properties of routing problems and derive a readily applicable, principled, generic, distributed, and adaptive routing algorithm. Improvements over state-of-the-art algorithms in the intermediate traffic regime where 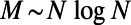 are considerable but are modest in the very sparse and dense traffic regimes. These findings will have a direct impact on a number of different research areas of practical and societal relevance, ranging from traffic to communication and logistics; however, more importantly, they may open the way for solving many other crucial and nonlocalized problems on networks.
Supplementary Material
Supporting Information
Acknowledgments
This work is supported by the European Union Future and Emerging Technologies project Statistical Mechanics Inspired Methods for Green Autonomous Networking (FP7-265496), Royal Society Exchange Grant IE110151, and the Research Grants Council of Hong Kong (Grant 605010).
Footnotes
The authors declare no conflict of interest.
This article is a PNAS Direct Submission.
References
- 1.Huitema C. Routing in the Internet. Englewood Cliffs, NJ: Prentice Hall; 1995. [Google Scholar]
- 2.Moy JT. OSPF: Anatomy of an Internet Routing Protocol. Reading, MA: Addison–Wesley; 1998. [Google Scholar]
- 3.Vasan A, Simonovic SP. Optimization of water distribution network design using differential evolution. Journal of Water Resources Planning and Management. 2010;136:279–287. [Google Scholar]
- 4.Rangwala S, Gummadi R, Govindan R, Psounis K. Interference-aware fair rate control in wireless sensor networks. Computer Communication Review. 2006;36:63–74. [Google Scholar]
- 5.Chardaire P, McKeown GP, Verity-Harrison SA, Richardson SB. Solving a time-space network formulation for the convoy movement problem. Operations Research. 2005;53(2):219–230. [Google Scholar]
- 6.Beckmann M, McGuire CB, Winsten CB. Studies in the Economics of Transportation. New Haven: Yale Univ Press; 1956. [Google Scholar]
- 7.Wardrop JG. Some theoretical aspects of road traffic research. Proceedings of the Institute of Civil Engineers. 1952;1(Part II):325–378. [Google Scholar]
- 8.Bellman R. On a routing problem. Quarterly of Applied Mathematics. 1958;16(1):87–90. [Google Scholar]
- 9.Dijkstra EW. A note on two problems in connexion with graphs. Numerische Mathematik. 1959;1:269–271. [Google Scholar]
- 10.Xie H, Qiu L, Yang YR, Zhang Y. Proceedings of the 12th IEEE International Conference on Network Protocols. Washington, DC: IEEE; 2004. On self adaptive routing in dynamic environments; pp. 12–23. [Google Scholar]
- 11.Zhu Y, Dovrolis C, Ammar M. Dynamic overlay routing based on available bandwidth estimation: A simulation study. Computer Networks Journal. 2006;50:739–876. [Google Scholar]
- 12.Baliga J, Hinton K, Tucker RS. Proceedings of the Conference on Optical Internet and the 32nd Australian Conference on Optical Fibre Technology. Washington, DC: IEEE; 2007. Energy consumption of the Internet; pp. 1–3. [Google Scholar]
- 13.Shahrokhi F, Matula DW. The maximum concurrent flow problem. Journal of the Association for Computing Machinery. 1990;37:318–334. [Google Scholar]
- 14.Leighton T, Rao S. Proceedings of Foundations of Computer Science 29th Annual Symposium. Washington, DC: IEEE; 1988. An approximate max-flow min-cut theorem for uniform multicommodity flow problems with applications to approximation algorithms; pp. 422–431. [Google Scholar]
- 15.Awerbuch B, Azar Y, Plotkin S. Proceedings of Foundations of Computer Science 34th Annual Symposium. Washington, DC: IEEE; 1993. Throughput-competitive on-line routing; pp. 32–40. [Google Scholar]
- 16.Garg N, Könemann J. Proceedings of Foundations of Computer Science 39th Annual Symposium. Washington, DC: IEEE; 1998. Faster and simpler algorithms for multicommodity flow and other fractional packing problems; pp. 300–309. [Google Scholar]
- 17.Awerbuch B, Khandekar R. Proceedings of the Twenty-Sixth Annual ACM Symposium on Principles of Distributed Computing. New York: ACM; 2007. Greedy distributed optimization of multi-commodity flows; pp. 274–283. [Google Scholar]
- 18.Barnhart C, Hane CA, Vance PH. Using branch-and-price-and-cut to solve origin destination integer multicommodity flow problems. Oper Res. 2000;48:318–326. [Google Scholar]
- 19.Castro J, Nabona N. An implementation of linear and nonlinear multicommodity network flows. Eur J Oper Res. 1996;92:37–53. [Google Scholar]
- 20.Daoud M, et al. Solutions of flexible polymers. Neutron experiments and interpretation. Macromolecules. 1975;8(6):804–818. [Google Scholar]
- 21.Mézard M, Parisi G, Virasoro MA. Spin Glass Theory and Beyond. Singapore: World Scientific; 1987. [Google Scholar]
- 22.Nishimori H. Statistical Physics of Spin Glasses and Information Processing. Oxford, UK: Oxford Univ Press; 2001. [Google Scholar]
- 23.Pearl J. Proceedings of the Second National Conference on Artificial Intelligence. San Francisco: AAAI; 1982. Reverend Bayes on inferenced engines: A distributed hierarchical approach; pp. 133–136. [Google Scholar]
- 24.Gallager RG. Information Theory and Reliable Communication. NY: Wiley; 1998. [Google Scholar]
- 25.Barash Y, et al. Deciphering the splicing code. Nature. 2010;465(7294):53–59. doi: 10.1038/nature09000. [DOI] [PubMed] [Google Scholar]
- 26.Mézard M, Parisi G, Zecchina R. Analytic and algorithmic solution of random satisfiability problems. Science. 2002;297(5582):812–815. doi: 10.1126/science.1073287. [DOI] [PubMed] [Google Scholar]
- 27.Liu YY, Slotine JJ, Barabási AL. Controllability of complex networks. Nature. 2011;473(7346):167–173. doi: 10.1038/nature10011. [DOI] [PubMed] [Google Scholar]
- 28.Bohn S, Magnasco MO. Structure, scaling, and phase transition in the optimal transport network. Phys Rev Lett. 2007;98(8):088702. doi: 10.1103/PhysRevLett.98.088702. [DOI] [PubMed] [Google Scholar]
- 29.Banavar JR, Colaiori F, Flammini A, Maritan A, Rinaldo A. Topology of the fittest transportation network. Phys Rev Lett. 2000;84(20):4745–4748. doi: 10.1103/PhysRevLett.84.4745. [DOI] [PubMed] [Google Scholar]
- 30.Shao Z, Zhou H. Optimal transportation network with concave cost functions: Loop analysis and algorithms. Phys Rev E Stat Nonlin Soft Matter Phys. 2007;75(6 Pt 2):066112. doi: 10.1103/PhysRevE.75.066112. [DOI] [PubMed] [Google Scholar]
- 31.Batchelor MT, Nienhuis B, Warnaar SO. Bethe-Ansatz results for a solvable O(n) model on the square lattice. Phys Rev Lett. 1989;62(21):2425–2428. doi: 10.1103/PhysRevLett.62.2425. [DOI] [PubMed] [Google Scholar]
- 32.Stilck JF, Machado KD, Serra P. Nature of the collapse transition for polymers. Phys Rev Lett. 1996;76(15):2734–2737. doi: 10.1103/PhysRevLett.76.2734. [DOI] [PubMed] [Google Scholar]
- 33.Mézard M, Montanari A. Information, Physics, and Computation. Oxford, UK: Oxford Univ Press; 2009. [Google Scholar]
- 34.Yeung CH, Saad D. Competition for shortest paths on sparse graphs. Phys Rev Lett. 2012;108(20):208701. doi: 10.1103/PhysRevLett.108.208701. [DOI] [PubMed] [Google Scholar]
- 35.Transport for London Oyster card data. Available at www.tfl.gov.uk. Accessed April 16, 2012.
- 36.Openflights.org Airport network data. Available at http://openflights.org/data.html. Accessed April 12, 2012.
- 37.Newman MEJ, Strogatz SH, Watts DJ. Random graphs with arbitrary degree distributions and their applications. Phys Rev E Stat Nonlin Soft Matter Phys. 2001;64(2 Pt 2):026118. doi: 10.1103/PhysRevE.64.026118. [DOI] [PubMed] [Google Scholar]
- 38.Kim M, Medard M. Proceedings of the IEEE Infocom Conference. 23rd Annual Joint Conference of the IEEE Computer and Communications Societies. Washington, DC: IEEE; 2004. Robustness in large-scale random networks; pp. 2364–2373. [Google Scholar]
- 39.Bollobás B. Random Graphs. London: Academic; 1985. [Google Scholar]
- 40.Borgatti SP. Lexington, KY: Analytic Technologies; 2002. NetDraw Software for Network Visualization. [Google Scholar]
Associated Data
This section collects any data citations, data availability statements, or supplementary materials included in this article.
Supplementary Materials
Supporting Information