Effects of garcinia cambogia (Hydroxycitric Acid) on visceral fat accumulation: a double-blind, randomized, placebo-controlled trial (original) (raw)
Abstract
Background
(-)-Hydroxycitric acid (HCA) is an active ingredient extracted from the rind of the Indian fruit Garcinia cambogia. It inhibits adenosine triphosphate citrate lyase and has been used in the treatment of obesity.
Objective
The primary end point of this study was the effects of 12 weeks of G cambogia extract administration on visceral fat accumulation. The secondary end points were body indices (including height, body weight, body mass index [BMI], waist and hip circumference, and waist–hip ratio) and laboratory values (including total cholesterol, triacylglycerol, and free fatty acid).
Methods
This study was performed according to a double-blind, randomized, placebo-controlled, parallel-group design. Subjects aged 20 to 65 years with a visceral fat area >90 cm2 were enrolled. Subjects were randomly assigned to receive treatment for 12 weeks with G cambogia (containing 1000 mg of HCA per day) or placebo. At the end of the treatment period, both groups were administered placebo for 4 weeks to assess any rebound effect. Each subject underwent a computed tomography scan at the umbilical level at −2, 0, 12, and 16 weeks.
Results
Forty-four subjects were randomized at baseline, and 39 completed the study (G cambogia group, n = 18; placebo group, n = 21). At 16 weeks, the G cambogia group had significantly reduced visceral, subcutaneous, and total fat areas compared with the placebo group (all indices P<0.001). No severe adverse effect was observed at any time in the test period. There were no significant differences in BMI or body weight at week 12, but there were slight numeric decreases in body weight and BMI in men. There were no signs of a rebound effect from week 12 to week 16.
Conclusion
G cambogia reduced abdominal fat accumulation in subjects, regardless of sex, who had the visceral fat accumulation type of obesity. No rebound effect was observed. It is therefore expected that G cambogia may be useful for the prevention and reduction of accumulation of visceral fat.
Keywords: Garcinia cambogia, hydroxycitric acid, visceral fat accumulation, computed tomography scan
Introduction
The prevalence of overweight has increased substantially in Japan during the past decade and it continues to rise. According to recent statistics, >30% of the Japanese adult population meets the current definition of overweight (body mass index [BMI] ≥25 kg/m2).1 Obesity is a problem not only in the Western world but also in Japan. It is well accepted that obesity is a risk factor for type 2 diabetes, coronary heart disease, and hypertension.2–13 Several studies, however, have shown that measurement of overall adiposity or body weight, such as with BMI, may not adequately describe the relationship of body fat to disease.14 It appears that visceral fat area (VFA) more fully explains this relationship.15,16 The clustering of hyperinsulinemia, dyslipidemia, type 2 diabetes mellitus, and hypertension is called the insulin resistance syndrome or metabolic syndrome, and syndrome X.17 Accordingly, evaluation of obesity for the prevention of syndrome X must be conducted using not only body weight or BMI but also VFA. Incidentally, it has been reported that a high-carbohydrate (sucrose) diet increases visceral fat accumulation in rats.18 Therefore, controlling the surplus energy from a high-carbohydrate diet is expected to be effective in preventing the accumulation of visceral fat.
Several studies have demonstrated that (-)-hydroxycitric acid (HCA), the principal acid of the rind of the Indian fruit Garcinia cambogia, is a competitive inhibitor of adenosine triphosphate citrate lyase,19–21 the enzyme that catalyzes the extramitochondrial cleavage of citrate to oxaloacetate and acetyl coenzyme A. This action of HCA should reduce the acetyl coenzyme A pool, thus limiting the availability of 2-carbon units required for fatty acid and cholesterol biosynthesis.22 In vitro and in vivo studies show that HCA inhibits the actions of citrate cleavage enzyme, suppresses de novo fatty acid synthesis, increases rates of hepatic glycogen synthesis, and decreases body weight gain.23–27 In human studies, only supporting evidence exists for the efficacy of G cambogia in weight control, and it has yet to be assessed in relationship to visceral fat accumulation.28–31
We previously reported32 that the efficacy of HCA depends on initial VFA values and was obvious in subjects whose initial VFA was >90 cm2. Because we enrolled overweight or obese class 1 subjects (BMI, 25–35 kg/m2) in that study, high VFA was not one of the inclusion criteria. The goal of the present study was to examine the effects of 12 weeks of G cambogia treatment on visceral fat accumulation in subjects having a VFA >90 cm2.
Subjects and methods
Subjects
All subjects had to be between the ages of 20 and 65 years and have a VFA >90 cm2. All of the subjects were to be generally healthy and have no history of diabetes mellitus; dysfunction of the liver, kidney, or heart; or hematologic disease. Other inclusion and exclusion criteria are given in Table I. Most of the subjects were classified as level 1 to 2 (mild) in terms of self-reported daily activity according to the 6th Recommended Dietary Allowances for the Japanese.33
Table I.
Study inclusion and exclusion criteria.
| Inclusion criteria |
|---|
| Age 20–65 years |
| Overweight (BMI ≥25 kg/m2) |
| Visceral fat area >90 cm2 |
| No fluctuation of BMI by the end of the run-in period |
| Provision of written informed consent |
| Exclusion criteria |
| Diabetes (fasting plasma glucose, 126 mg/dL) |
| Dysfunction of liver, kidneys, or heart |
| Hematologic disease |
| History of drug hypersensitivity or allergic condition that might interfere with the study |
| Use of drugs or dietary supplements that might influence body weight, body fat, or serum lipid levels |
| Pregnancy or lactation |
| Any other abnormality of potential clinical significance |
This study was carried out with sufficient respect for the spirit of the Declaration of Helsinki and was approved by the institutional review boards of FANCL Corporation, Maebashi Hirosegawa Clinic (Gunma, Japan), and Ono Clinic (Osaka, Japan). The procedures were fully explained to all the subjects in advance, and all gave their written informed consent before participating.
Treatment
G cambogia extract was provided by Nippon Shinyaku Co., Ltd., Kyoto, Japan. The HCA concentration was 60% as determined by high-performance liquid chromatography. The active herbal was a 270-mg tablet containing 185.25 mg of G cambogia extract. In the placebo tablet, the active compound was replaced with cellulose (Avicel, Asahi Kasei Corp., Tokyo, Japan) as an inert ingredient. The excipients were dextrin and cellulose.
Subjects were instructed to take 3 tablets 30 minutes before each meal (9 tablets/d). The total daily dose was 1667.25 mg of G cambogia extract, containing 1000 mg of HCA.
Protocol
This study was performed according to a double-blind, placebo-controlled, parallel-group design (Figure 1). Randomization was performed by random number generation, and group assignment was placed in a sealed envelope. The primary end point of this study was the effects of 12 weeks of G cambogia extract administration on visceral fat accumulation. The secondary end points were body indices (including height, body weight, BMI, waist and hip circumference, and waist–hip ratio [WHR]) and laboratory values (including total cholesterol [TC], triacylglycerol, and free fatty acid).
Figure 1.
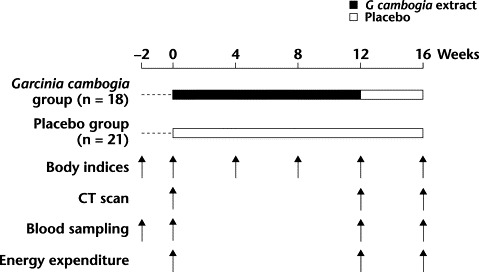
Protocol of the efficacy test of Garcinia cambogia. Subjects received no treatment during a 2-week run-in period. CT = computed tomography.
Subjects received no treatment during a 2-week run-in period. After runin, subjects underwent body weight measurement, computed tomography (CT), and laboratory analysis. They were then randomly assigned to either the G cambogia group (containing 1000 mg of HCA per day) or the placebo group. The treatment period lasted 12 weeks. At the end of the treatment period, both groups were administered placebo for 4 weeks to assess any rebound effect.
Subjects were started on a dietary intervention by a nationally registered dietitian in each institute. Subjects' intake was limited to 2250 kcal/d for men and 1800 kcal/d for women.33 Energy expenditure was determined by questionnaires completed at weeks 0, 12, and 16. At the same time, the aforementioned dietitians assessed dietary intervention, using a questionnaire, at each visit.
The subjects underwent CT at weeks 0, 12, and 16 at either the Maebashi Hirosegawa Clinic, using a Toshiba Medical TCT-300 machine (Toshiba Corp., Tokyo, Japan), or the Ono Clinic, using a Toshiba Medical X-force machine (Toshiba Corp.). VFA and subcutaneous fat area (SFA) were determined by the FAT Scan Program (N2 System Corp., Osaka, Japan) from CT image data at the level of the umbilicus. All CT scans were performed by radiologists blinded to participants' group randomization.
Body indices were measured at week −2 and every 4 weeks during the study. They included height, body weight, BMI, waist and hip circumference, and WHR.
Blood samples were collected from the subjects between 9:00 and 11:30 am after an overnight fast, which began at 9:00 am on the previous night. Laboratory parameters were red and white blood cell counts, hemoglobin, hematocrit, platelets, TC, high-density lipoprotein cholesterol, low-density lipoprotein cholesterol, triacylglycerol, free fatty acid, aspartate aminotransferase, alanine aminotransferase, γ-glutamyltransferase, lactate dehydrogenase, blood urea nitrogen, creatinine, fasting plasma glucose, insulin, acetoacetic acid, 3-hydroxybutyric acid, and total ketone bodies. Clinical laboratory data were measured at −2, 0, 12, and 16 weeks.
Statistical analysis
Rates of change were calculated for the CT scans and body indices, and the differences in effects between the G cambogia and placebo groups were calculated according to the Student t test. The evaluation of rebound was calculated according to the paired t test at weeks 12 and 16. The analysis of laboratory parameters to determine a safety profile was performed using the paired t test and the Student t test. For baseline data, we used mean values calculated from the start and end points of the run-in period. All analyses were conducted at the 2-tailedαlevel of 0.05. Data were analyzed using the statistical program StatView Version 5.0 (SAS Institute Inc., Cary, North Carolina).
Results
Subject characteristics
Forty-four subjects were randomized at baseline to either the G cambogia group (n = 21) or the placebo group (n = 23) (Figure 2). The mean (SEM) VFA was 145.5 (6.0) cm2, and their mean (SEM) BMI was 28.7 (0.7) kg/m2 (overweight [BMI 25–<30 kg/m2], 30 patients [68.2%]; obesity class I [BMI 30–<35 kg/m2], 7 patients [15.9%]; obesity class II [BMI 35–<40 kg/m2], 6 patients [13.6%]; obesity class III [BMI ≥40 kg/m2], 1 patient [2.3%]). Eighteen of the 21 subjects in the G cambogia group and 21 of the 23 placebo group subjects completed the 16-week protocol. Reasons for subject withdrawal are summarized in Figure 2. The number of G cambogia and placebo subjects, respectively, assessed at each period were as follows: week 0, 21 and 23; week 4, 19 and 23; week 8, 19 and 22; and weeks 12 and 16, 18 and 21.
Figure 2.
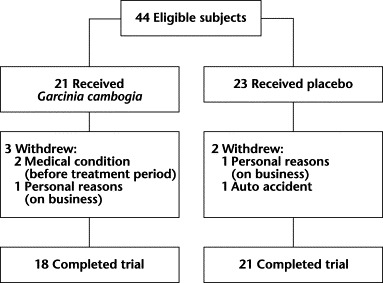
Study flow diagram.
The study subjects ranged in age from 20 to 65 years (mean [SEM] age, 44 [1.8] years). In an analysis including the subjects who withdrew, no significant differences were found in initial age, body weight, BMI, waist and hip circumference, WHR, VFA, SFA, or total fat area (TFA) between the placebo group and the G cambogia group (Table II).
Table II.
Baseline characteristics of study subjects (N = 44). (Values are given as mean [SEM] unless otherwise noted.)
| Characteristic | Garcinia cambogia Group (n = 21) | Placebo Group (n = 23) |
|---|---|---|
| Age, y | ||
| Mean (SEM) | 43.7 (2.6) | 45.2 (2.7) |
| Range | 23–64 | 23–65 |
| Sex, no. (%) | ||
| Men | 11 (52.4) | 13 (56.5) |
| Women | 10 (47.6) | 10 (43.5) |
| Body weight, kg | ||
| Men | 83.9 (4.7) | 78.7 (3.2) |
| Women | 72.8 (3.8) | 74.5 (4.2) |
| Height, cm | ||
| Men | 170.8 (1.8) | 171.2 (1.9) |
| Women | 154.2 (1.4) | 156.1 (1.5) |
| BMI, kg/m2 | ||
| Men | 28.8 (1.7) | 26.8 (0.8) |
| Women | 30.6 (1.5) | 30.6 (1.7) |
| Waist circumference, cm | ||
| Men | 94.6 (2.9) | 91.3 (1.9) |
| Women | 97.9 (3.0) | 98.2 (2.4) |
| Hip circumference, cm | ||
| Men | 99.8 (1.9) | 100.2 (1.9) |
| Women | 103.5 (2.5) | 104.7 (2.4) |
| WHR | ||
| Men | 0.94 (0.01) | 0.92 (0.01) |
| Women | 0.95 (0.01) | 0.94 (0.01) |
| Visceral fat area, cm2 | ||
| Men | 156.6 (10.5) | 137.0 (7.8) |
| Women | 138.2 (14.4) | 147.9 (13.6) |
| Subcutaneous fat area, cm2 | ||
| Men | 203.9 (30.3) | 176.1 (17.9) |
| Women | 279.6 (21.9) | 280.4 (28.2) |
| Total fat area, cm2 | ||
| Men | 363.9 (34.6) | 312.7 (16.3) |
| Women | 414.9 (25.1) | 427.9 (34.4) |
Nutrient intake
Table III compares the nutrient intake by subjects in the 2 groups. In the male subjects in both groups, energy expenditure was slightly lower than the 2250 kcal/d established by their dietary intervention. In the female subjects in both groups, energy expenditure was approximately equal to the 1800 kcal/d established by their dietary intervention. During the 16-week experiment period, there were no significant between-group differences in nutrient intake or energy expenditure.
Table III.
Comparison of nutrient intake and energy expenditure between the Garcinia cambogia and placebo groups over 16 weeks (N = 44). (Values are given as mean [SEM].)
| Nutrient | Garcinia cambogia Group (n = 21) | Placebo Group (n = 23) |
|---|---|---|
| Protein, g/d | ||
| Men | 77.7 (3.4) | 71.8 (3.1) |
| Women | 68.3 (2.9) | 69.1 (2.2) |
| Fat, g/d | ||
| Men | 59.5 (4.0) | 57.4 (3.9) |
| Women | 56.4 (3.8) | 55.6 (4.2) |
| Carbohydrate, g/d | ||
| Men | 273.5 (17.6) | 285.7 (9.1) |
| Women | 260.0 (12.7) | 264.5 (11.2) |
| Energy expenditure, kcal/d | ||
| Men | 2015.5 (105.5) | 2018.3 (76.2) |
| Women | 1869.3 (60.1) | 1862.1 (81.3) |
Abdominal fat distribution and body indices
Abdominal fat distribution and body indices are shown in Tables IV and V, respectively. Regardless of sex, the VFA, SFA, and TFA of subjects in the G cambogia group were significantly lower at 12 weeks (P = 0.009, 0.003, and <0.001, respectively) and 16 weeks (P = 0.001, <0.001, and <0.001, respectively) than in the placebo group (Table IV). Within the G cambogia group, each of these fat areas decreased by ∼10% to 15% from baseline to week 16.
Table IV.
Mean (SEM) changes in abdominal fat distribution versus baseline in patients who completed the study (N = 39). (Values are expressed as % unless otherwise noted.)
| All Subjects | Men | Women | |||||||
|---|---|---|---|---|---|---|---|---|---|
| Fat Distribution/ Study Week | Garciniacambogia Group (n = 18) | Placebo Group (n = 21) | P∗ | Garciniacambogia Group (n = 8) | Placebo Group (n = 11) | P∗ | Garciniacambogia Group(n = 10) | Placebo Group (n = 10) | P∗ |
| Visceral fat area | |||||||||
| Week 0, mean (SEM), cm2 | 146.2 (9.9) | 144.9 (7.5) | – | 156.2 (13.5) | 142.2 (8.1) | – | 138.2 (14.4) | 147.9 (13.6) | – |
| Week 12 | 89.2 (2.5) | 105.1 (3.2) | 0.009 | 87.8 (4.6) | 105.5 (5.5) | 0.032 | 90.2 (2.9) | 104.8 (3.2) | 0.003 |
| Week 16 | 86.4 (2.1) | 106.9 (3.8) | 0.001 | 82.3 (3.5) | 107.2 (5.9) | 0.004 | 89.7 (2.3) | 106.5 (5.2) | 0.004 |
| Subcutaneous fat area | |||||||||
| Week 0, mean (SEM), cm2 | 231.3 (20.2) | 223.4 (20.2) | – | 170.9 (22.7) | 171.5 (18.6) | – | 279.6 (21.9) | 280.4 (28.2) | – |
| Week 12 | 87.6 (2.4) | 106.7 (3.1) | 0.003 | 90.1 (2.7) | 107.0 (5.0) | 0.017 | 85.6 (3.8) | 106.3 (3.9) | 0.001 |
| Week 16 | 85.4 (3.1) | 108.0 (2.6) | <0.001 | 88.9 (3.9) | 110.5 (3.3) | <0.001 | 82.5 (4.7) | 110.5 (3.3) | <0.001 |
| Total fat area | |||||||||
| Week 0, mean (SEM), cm2 | 379.2 (21.9) | 367.9 (22.4) | – | 334.6 (32.9) | 313.3 (17.8) | – | 414.9 (25.1) | 427.9 (34.4) | – |
| Week 12 | 87.7 (1.6) | 105.6 (2.2) | <0.001 | 87.8 (2.6) | 105.6 (3.4) | 0.001 | 87.6 (2.2) | 105.6 (3.4) | <0.001 |
| Week 16 | 85.2 (2.3) | 106.3 (2.2) | <0.001 | 84.8 (2.9) | 107.7 (3.4) | <0.001 | 85.5 (3.6) | 104.7 (2.7) | <0.001 |
Table V.
Mean (SEM) changes in anthropometric values, by sex, in patients who completed the study (N = 39). (Values are expressed as % unless otherwise noted.)
| All Subjects | Men | Women | ||||
|---|---|---|---|---|---|---|
| Parameter/Study Week | Garciniacambogia Group(n = 18) | Placebo Group (n = 21) | Garciniacambogia Group (n = 8) | Placebo Group (n = 11) | Garciniacambogia Group (n = 10) | Placebo Group (n = 10) |
| Body weight | ||||||
| Week 0, mean (SEM), kg | 75.1 (2.9) | 75.9 (2.5) | 78.2 (4.5) | 77.5 (3.0) | 72.8 (3.8) | 74.3 (4.2) |
| Week 4 | 99.4 (0.3) | 99.8 (0.3) | 99.2 (0.5) | 100.1 (0.5) | 99.4 (0.4) | 99.4 (0.4) |
| Week 8 | 98.8 (0.4) | 99.0 (0.4) | 98.8 (0.7) | 99.7 (0.6) | 98.8 (0.5) | 98.3 (0.5) |
| Week 12 | 98.2 (0.5) | 99.4 (0.5) | 98.1 (0.8) | 100.3 (0.7) | 98.3 (0.6) | 98.5 (0.5) |
| Week 16 | 98.0 (0.6)∗ | 99.9 (0.5) | 98.3 (0.8)† | 100.7 (0.7) | 97.8 (0.9) | 98.9 (0.7) |
| BMI | ||||||
| Week 0, mean (SEM), kg/m2 | 28.9 (1.1) | 28.5 (1.0) | 26.8 (1.3) | 26.7 (0.8) | 30.6 (1.5) | 30.5 (1.7) |
| Week 4 | 99.4 (0.3) | 99.8 (0.3) | 99.3 (0.5) | 99.4 (0.4) | 99.4 (0.4) | 99.4 (0.4) |
| Week 8 | 98.8 (0.4) | 99.0 (0.4) | 98.8 (0.7) | 99.7 (0.6) | 98.8 (0.5) | 98.3 (0.5) |
| Week 12 | 98.2 (0.5) | 99.4 (0.5) | 98.2 (0.8) | 100.3 (0.7) | 98.3 (0.6) | 98.5 (0.5) |
| Week 16 | 98.0 (0.6) | 99.9 (0.5) | 98.3 (0.8)∗ | 100.7 (0.7) | 97.8 (0.9) | 98.9 (0.7) |
| Waist circumference | ||||||
| Week 0, mean (SEM), cm | 95.4 (2.2) | 94.5 (1.7) | 92.2 (3.1) | 91.0 (2.0) | 97.9 (3.0) | 98.5 (2.3) |
| Week 4 | 99.6 (0.4) | 100.3 (0.4) | 99.8 (0.6) | 100.6 (0.6) | 99.4 (0.6) | 100.0 (0.5) |
| Week 8 | 99.2 (0.5) | 100.1 (0.4) | 99.7 (0.8) | 100.8 (0.5) | 98.9 (0.7) | 99.4 (0.5) |
| Week 12 | 98.8 (0.6) | 99.3 (0.3) | 99.1 (0.9) | 99.6 (0.3) | 98.5 (0.9) | 98.9 (0.4) |
| Week 16 | 98.0 (0.7) | 99.0 (0.4) | 98.3 (1.2) | 99.8 (0.4) | 97.8 (0.9) | 98.3 (0.7) |
| Hip circumference | ||||||
| Week 0, mean (SEM), cm | 100.8 (1.7) | 100.9 (1.4) | 98.4 (1.8) | 98.5 (1.4) | 103.1 (2.6) | 104.6 (2.3) |
| Week 4 | 99.9 (0.2) | 100.1 (0.3) | 99.5 (0.4) | 100.0 (0.5) | 100.1 (0.3) | 100.1 (0.3) |
| Week 8 | 99.4 (0.4) | 99.5 (0.3) | 99.1 (0.8) | 99.3 (0.5) | 99.7 (0.2) | 99.7 (0.3) |
| Week 12 | 99.0 (0.3) | 99.0 (0.3) | 99.1 (0.8) | 99.0 (0.5) | 98.8 (0.2) | 99.0 (0.4) |
| Week 16 | 98.6 (0.4) | 98.9 (0.3) | 99.0 (0.7) | 99.0 (0.5) | 98.2 (0.3) | 98.8 (0.5) |
| WHR | ||||||
| Week 0, mean (SEM) | 0.94 (0.01) | 0.94 (0.01) | 0.94 (0.02) | 0.92 (0.01) | 0.95 (0.01) | 0.94 (0.01) |
| Week 4 | 99.7 (0.4) | 100.2 (0.3) | 100.3 (0.4) | 100.6 (0.5) | 99.3 (0.7) | 99.9 (0.4) |
| Week 8 | 99.8 (0.5) | 100.6 (0.4) | 100.6 (0.6) | 101.4 (0.5) | 99.2 (0.8) | 99.7 (0.4) |
| Week 12 | 99.8 (0.6) | 100.2 (0.3) | 100.0 (0.4) | 100.5 (0.4) | 99.7 (1.0) | 99.9 (0.5) |
| Week 16 | 99.4 (0.6) | 100.1 (0.4) | 99.2 (0.6) | 100.8 (0.5) | 99.6 (1.1) | 99.4 (0.7) |
When comparing the findings at week 12 versus week 16 in the G cambogia group, no significant changes were observed in VFA, SFA, or TFA. Therefore, there were no signs of a rebound effect from week 12 to week 16 in the G cambogia group.
At 12 weeks, both body weight and BMI were numerically but not significantly lower in the G cambogia group than in the placebo group, and were significantly lower in the G cambogia group than in the placebo group at 16 weeks (P = 0.04 and 0.02, respectively, vs placebo). However, these findings were observed only in men, among whom the WHR in the G cambogia group tended to be lower than in the placebo group, although the difference was not significant (Table V). No significant differences in other indices were detected in either sex between the 2 treatment groups.
Clinical laboratory tests
The results of clinical laboratory tests are shown in Table VI. Serum triacylglycerol values tended to decrease over time in the G cambogia group but not significantly. The mean values of the hematologic, hemobiochemical, and endocrinologic data did not change in the G cambogia group.
Table VI.
Effects of Garcinia cambogia on hematologic, hemobiochemical, and endocrinologic parameters in all patients (N = 43). (Values are expressed as mean [SEM].)
| Garcinia cambogia Group | Placebo Group | ||||||
|---|---|---|---|---|---|---|---|
| Parameter | Normal Value | Week 0 (n = 21) | Week 12 (n = 18) | Week 16 (n = 18) | Week 0 (n = 23) | Week 12 (n = 21) | Week 16 (n = 21) |
| Hematology | |||||||
| WBC count, cells/μL | 3500–9700 | 6695 (394) | 6573 (456) | 7011 (494) | 6533 (309) | 6983 (324)∗ | 6867 (417)∗ |
| RBC count, cells×106/μL | Men, 4.38– 5.77; women, 3.76–5.16 | 4.83 (0.01) | 4.79 (0.07) | 4.85 (0.09) | 4.81 (0.10) | 4.85 (0.11)∗ | 4.88 (0.10)† |
| Hb, g/dL | Men, 13.6– 18.3; women, 11.2–15.2 | 14.4 (0.4) | 14.4 (0.4) | 14.5 (0.4) | 14.6 (0.3) | 14.7 (0.3)∗ | 14.8 (0.3)∗ |
| Hematocrit, % | Men, 40.4– 51.9; women, 34.3–45.2 | 45.0 (1.1) | 45.0 (1.1) | 45.0 (1.0) | 45.1 (0.5) | 45.9 (0.7)† | 45.9 (0.6)† |
| Platelet count, cells×103/μL | 140–379 | 270 (12) | 265 (17) | 268 (18) | 255 (13) | 235 (15) | 253 (15) |
| Hemobiochemistry | |||||||
| AST, U/L | 10.0–40.0 | 32.0 (3.0) | 31.2 (3.3) | 34.1 (4.4) | 28.8 (1.9) | 30.4 (2.5) | 30.1 (2.4) |
| ALT, U/L | 5.0–45.0 | 51.9 (8.4) | 43.2 (5.9) | 48.6 (7.8) | 40.9 (4.7) | 42.5 (5.2) | 43.0 (5.4) |
| GGTP, U/L | 16.0–73.0 | 57.9 (7.6) | 62.6 (10.0) | 63.9 (9.4) | 54.7 (7.9) | 55.0 (8.8) | 54.0 (8.8) |
| LDH, U/L | 220.0–430.0 | 344.3 (11.8) | 334.2 (14.8) | 335.7 (11.8) | 354.2 (10.9) | 358.8 (19.5) | 347.9 (10.2) |
| BUN, mg/dL | 8.0–20.0 | 13.0 (0.7) | 12.9 (0.9) | 12.9 (0.8) | 12.8 (0.5) | 12.6 (0.6) | 13.3 (0.5) |
| Creatinine, mg/dL | 0.6–1.3 | 0.97 (0.03) | 0.94 (0.03) | 0.94 (0.03) | 0.99 (0.03) | 0.94 (0.03)† | 0.92 (0.04)† |
| Triacylglycerol, mg/dL | 50.0–149.0 | 169.1 (11.7) | 154.4 (14.1) | 146.2 (15.2) | 177.4 (20.7) | 183.7 (19.0) | 173.7 (19.7) |
| FFA, mEq/L | 0.10–0.81 | 0.73 (0.05) | 0.72 (0.05) | 0.71 (0.07) | 0.73 (0.05) | 0.71 (0.07) | 0.68 (0.06) |
| TC, mg/dL | 150.0–219.0 | 213.4 (5.7) | 208.8 (7.7) | 210.8 (6.7) | 211.8 (8.1) | 213.7 (9.0) | 217.7 (9.1) |
| HDL-C, mg/dL | Men, 41.0– 80.0; women,41.0–90.0 | 48.9 (2.4) | 48.7 (2.4) | 50.7 (1.8) | 47.8 (2.2) | 46.6 (2.1) | 47.9 (2.1) |
| LDL-C, mg/dL | 60–130 | 140.1 (4.9) | 137.3 (6.1) | 139.1 (6.4) | 139.2 (6.6) | 140.2 (7.9) | 143.0 (7.4) |
| FPG, mg/dL | 70–139 | 94.0 (2.2) | 92.1 (1.7) | 94.3 (2.8) | 90.8 (1.7) | 91.3 (1.9) | 90.0 (1.6) |
| Acetoacetic acid, μmol/L | ≤55.0 | 17.2 (2.7) | 20.6 (1.6) | 21.6 (4.3) | 16.8 (1.4) | 17.8 (2.5) | 16.2 (1.6) |
| 3-Hydroxybutyric acid, μmol/L | ≤85 | 38.6 (6.1) | 37.8 (3.2) | 45.1 (9.7) | 33.0 (3.6) | 33.2 (5.5) | 30.0 (3.5) |
| Total ketone bodies, μmol/L | ≤131.0 | 55.8 (8.5) | 58.4 (4.3) | 66.7 (13.9) | 49.8 (4.3) | 51.0 (7.6) | 46.2 (4.4) |
| Endocrinology | |||||||
| Insulin, μU/mL | 3.0–18.0 | 13.3 (2.0) | 9.9 (1.1) | 11.8 (1.6) | 9.8 (1.1) | 11.9 (1.5) | 11.6 (1.5) |
Adverse effects
No subject was removed from the study protocol for treatment-related adverse effects. The following adverse effects occurred in the G cambogia and placebo group, respectively: common cold, 1 (4.8%) and 10 (43.5%); toothache, 3 (14.3%) and 3 (13.0%); diarrhea, 2 (9.5%) and 4 (17.4%); and headache, 0 (0.0%) and 4 (17.4%).
Discussion
The dietary habits of the Japanese have been Westernized rapidly since the end of World War II. With poorer nutrition (ie, higher fat intake), the causes of death in Japan have changed considerably.1 In the early research into obesity in Japan and in Western countries, many studies investigated the relationship between body weight or BMI and lifestyle diseases such as type 2 diabetes, coronary heart disease, and hypertension.14 Recently, attention has focused on the relationship between abdominal fat distribution and lifestyle diseases by CT analysis; in particular, the relationship between VFA and multiple risk factors (type 2 diabetes mellitus, dysglycemia, hypertension, coronary heart disease, hyperuricemia) has been reported.14 According to the Japan Society for the Study of Obesity,14 visceral fat obesity is diagnosed when VFA is ≥100 cm2. The concept of a “visceral fat accumulation” type of obesity is new and very important for the study of obesity as a disease, and it is expected to be useful in studies of the prevention of the aforementioned risk factors.
The present study was designed to assess the efficacy of G cambogia extract in anti–visceral fat accumulation in obese subjects. To account for previsceral fat obesity, inclusion criteria included VFA >90 cm2. The VFA inclusion criterion was set at >90 cm2 because that amount accounted for “previsceral fat obesity.” Compared with the placebo group, the G cambogia group had significant decreases in VFA, SFA, and TFA; no significant differences were observed between male and female subjects. Furthermore, the test results for abdominal fat area had sufficient power (1–ß > 0.8), so the sample size was appropriate. In a previous study,32 we reported on the efficacy of HCA, but the subjects were classified as overweight or obese using BMI, whereas in our study, both BMI and VFA were used to define obesity, and all subjects were classified as obese. Other differences between that study and the present one are that the treatment period was 8 weeks, and there was no detailed dietary intervention. In that previous report, unlike the present one, there was no observed effect of G cambogia on SFA or TFA. However, these differences in outcomes were expected because of the differences in the treatment periods, the VFA levels of the subjects, and the use of dietary intervention. In the present study, subjects in the G cambogia group underwent a 4-week placebo treatment after their 12-week treatment to detect any rebound effect. No such effect was found. This result was expected because the decrease in abdominal fat from weeks 0 to 12 was mild.
A CT scan was performed at 0, 12, and 16 weeks. If these measurements had been conducted every 4 weeks, the effect of G cambogia may have been detected at an earlier period.
Anthropometric indices included body weight, BMI, and WHR. Body weight and BMI tended to be lower in the G cambogia group than in the placebo group at both 12 and 16 weeks but only in men. In their investigation of an antiobesity effect of G cambogia, Heymsfield et al34 reported that body weight change during their 12-week study period did not differ significantly between the G cambogia and placebo groups. In that report, most of the subjects were women. Among the female subjects in our study, body weight and BMI did not differ between the 2 groups, and to that extent our results and those of Heymsfield et al are similar.
The results of clinical laboratory tests did not change significantly, and no adverse effects were observed at any time in the test period. The G cambogia tablet used in this study was well tolerated throughout the 12-week treatment period.
Conclusion
G cambogia reduced abdominal fat accumulation in subjects, regardless of sex, who had the visceral fat accumulation type of obesity, and no rebound effect was observed. It is therefore hypothesized that G cambogia may be useful for the prevention and reduction of accumulation of visceral fat.
Acknowledgements
We thank Shintaro Yano, MD (Maebashi Hirosegawa Clinic, Gunma, Japan) and Nobuhiko Hosokawa, MD (Ono Clinic, Osaka, Japan) for their helpful advice and encouragement in this study.
Footnotes
☆
Reproduction in whole or part is not permitted
References
- 1.The National Nutrition Survey in Japan 2000. Dai-ichi Shuppan Publishing; Tokyo, Japan: 2002. Ministry of Health, Labour and Welfare Japan. 59–60. [Google Scholar]
- 2.Déspres J.P, Lamarche B. Effects of diet and physical activity on adiposity and body fat distribution: Implications for the prevention of cardiovascular disease. Nutr Res Rev. 1993;6:137–159. doi: 10.1079/NRR19930010. [DOI] [PubMed] [Google Scholar]
- 3.Bray G.A. Complications of obesity. Ann Intern Med. 1985;103:1052–1062. doi: 10.7326/0003-4819-103-6-1052. [DOI] [PubMed] [Google Scholar]
- 4.Health implications of obesity. National Institutes of Health Consensus Development Conference Statement. Ann Intern Med. 1985;103:1073–1077. [PubMed] [Google Scholar]
- 5.Kissebah A.H, Freedman D.S, Peiris A.N. Health risks of obesity. Med Clin North Am. 1989;73:111–138. doi: 10.1016/s0025-7125(16)30695-2. [DOI] [PubMed] [Google Scholar]
- 6.Van Itallie T.B. Obesity: Adverse effects on health and longevity. Am J Clin Nutr. 1979;32(Suppl 12):2723–2733. doi: 10.1093/ajcn/32.12.2723. [DOI] [PubMed] [Google Scholar]
- 7.Larsson B, Bjorntorp P, Tibblin G. The health consequences of moderate obesity. Int J Obes. 1981;5:97–116. [PubMed] [Google Scholar]
- 8.Manson J.E, Stampfer M.J, Hennekens C.H, Willett W.C. Body weight and longevity. A reassessment. JAMA. 1987;257:353–358. [PubMed] [Google Scholar]
- 9.Seidell J.C, Verschuren W.M, van Leer E.M, Kromhout D. Overweight, underweight, and mortality. A prospective study of 48,287 men and women. Arch Intern Med. 1996;156:958–963. doi: 10.1001/archinte.156.9.958. [DOI] [PubMed] [Google Scholar]
- 10.Hubert H.B, Feinleib M, McNamara P.M, Castelli W.P. Obesity as an independent risk factor for cardiovascular disease: A 26-year follow-up of participants in the Framingham Heart Study. Circulation. 1983;67:968–977. doi: 10.1161/01.cir.67.5.968. [DOI] [PubMed] [Google Scholar]
- 11.Jousilahti P, Tuomilehto J, Vartiainen E. Body weight, cardiovascular risk factors, and coronary mortality. 15-Year follow-up of middle-aged men and women in eastern Finland. Circulation. 1996;93:1372–1379. doi: 10.1161/01.cir.93.7.1372. [DOI] [PubMed] [Google Scholar]
- 12.Stamler R, Stamler J, Riedlinger W.F. Weight and blood pressure. Findings in hypertension screening of 1 million Americans. JAMA. 1978;240:1607–1610. doi: 10.1001/jama.240.15.1607. [DOI] [PubMed] [Google Scholar]
- 13.Van Itallie T.B. Health implications of overweight and obesity in the United States. Ann Intern Med. 1985;103:983–988. doi: 10.7326/0003-4819-103-6-983. [DOI] [PubMed] [Google Scholar]
- 14.Saito Y, editor. Manual for the Treatment of Obesity. Ishiyaku Publishers; Tokyo, Japan: 2001. pp. 22–28. [Google Scholar]
- 15.Nakamura T, Tokunaga K, Shimomura I. Contribution of visceral fat accumulation to the development of coronary artery disease in non-obese men. Atherosclerosis. 1994;107:239–246. doi: 10.1016/0021-9150(94)90025-6. [DOI] [PubMed] [Google Scholar]
- 16.Matsuzawa Y, Shimomura I, Nakamura T. Pathophysiology and pathogenesis of visceral fat obesity. Obes Res. 1995;3(Suppl 2):187S–194S. doi: 10.1002/j.1550-8528.1995.tb00462.x. [DOI] [PubMed] [Google Scholar]
- 17.Reaven G.M. Banting lecture 1988. Role of insulin resistance in human disease. Diabetes. 1988;37:1595–1607. doi: 10.2337/diab.37.12.1595. [DOI] [PubMed] [Google Scholar]
- 18.Keno Y, Matsuzawa Y, Tokunaga K. High sucrose diet increases visceral fat accumulation in VMH-lesioned obese rats. Int J Obes. 1991;15:205–211. [PubMed] [Google Scholar]
- 19.Lewis Y.S, Neelakantan S. (-)-Hydroxycitric acid—the principal acid in the fruits of Garcinia cambogia desr. Phytochemistry. 1965;4:619–625. [Google Scholar]
- 20.Watson J.A, Lowenstein J.M. Citrate and the conversion of carbohydrate into fat. Fatty acid synthesis by a combination of cytoplasm and mitochondria. J Biol Chem. 1970;245:5993–6002. [PubMed] [Google Scholar]
- 21.Watson J.A, Fang M, Lowenstein J.M. Tricarballylate and hydroxycitrate: Substrate and inhibitor of ATP: Citrate oxaloacetate lyase. Arch Biochem Biophys. 1969;135:209–217. doi: 10.1016/0003-9861(69)90532-3. [DOI] [PubMed] [Google Scholar]
- 22.Sullivan A.C, Singh M, Srere P.A, Glusker J.P. Reactivity and inhibitor potential of hydroxycitrate isomers with citrate synthase, citrate lyase, and ATP citrate lyase. J Biol Chem. 1977;252:7583–7590. [PubMed] [Google Scholar]
- 23.Lowenstein J.M. Effect of (-)-hydroxycitrate on fatty acid synthesis by rat liver in vivo. J Biol Chem. 1971;246:629–632. [PubMed] [Google Scholar]
- 24.Sullivan A.C, Triscari J, Hamilton J.G. Effect of (-)-hydroxycitrate upon the accumulation of lipid in the rat.: I. Lipogenesis. Lipids. 1974;9:121–128. doi: 10.1007/BF02532136. [DOI] [PubMed] [Google Scholar]
- 25.Sullivan A.C, Triscari J, Hamilton J.G, Miller O.N. Effect of (-)-hydroxycitrate upon the accumulation of lipid in the rat.: II. Appetite. Lipids. 1974;9:129–134. doi: 10.1007/BF02532137. [DOI] [PubMed] [Google Scholar]
- 26.Sullivan C, Triscari J. Metabolic regulation as a control for lipid disorders: I. Influence of (-)-hydroxycitrate on experimentally induced obesity in the rodent. Am J Clin Nutr. 1977;30:767–776. doi: 10.1093/ajcn/30.5.767. [DOI] [PubMed] [Google Scholar]
- 27.Berkhout T.A, Havekes L.M, Pearce N.J, Groot P.H. The effect of (-)-hydroxycitrate on the activity of the low-density-lipoprotein receptor and 3-hydroxy-3-methylglutaryl-CoA reductase levels in the human hepatoma cell line Hep G2. Biochem J. 1990;272:181–186. doi: 10.1042/bj2720181. [DOI] [PMC free article] [PubMed] [Google Scholar]
- 28.Conte A.A. A non-prescription alternative in weight reduction therapy. Am J Bariatr Med Summer. 1993:17–19. [Google Scholar]
- 29.Thom E. Hydroxycitrate (HCA) in the treatment of obesity. Int J Obes. 1996;20(Suppl 4):48. [Google Scholar]
- 30.Rothacker D.Q, Waitman B.E. Effectiveness of a Garcinia cambogia and natural caffeine combination in weight loss: A double-blind, placebo-controlled pilot study. Int J Obes. 1997;21(Suppl 2):53. [Google Scholar]
- 31.Sawada H, Tomi H, Tamura K. Effect of liquid Garcinia extract and soluble Garcinia powder on body weight change: A possible material for suppressing fat accumulation. Jpn Oil Chem Soc. 1997;46:1467–1474. [Google Scholar]
- 32.Hayamizu K, Ishii Y, Kaneko I. Effects of long-term administration of Garcinia cambogia extract on visceral fat accumulation in humans: A placebo-controlled double blind trial. J Oleo Sci. 2001;50:805–812. [Google Scholar]
- 33.6th Recommended Dietary Allowances for the Japanese. Dai-ichi Shuppan Publishing; Tokyo, Japan: 1999. The Ministry of Health and Welfare. [Google Scholar]
- 34.Heymsfield S.B, Allison D.B, Vasselli J.R. Garcinia cambogia (hydroxycitric acid) as a potential antiobesity agent: A randomized controlled trial. JAMA. 1998;280:1596–1600. doi: 10.1001/jama.280.18.1596. [DOI] [PubMed] [Google Scholar]