GPU-Based Simulation of Ultrasound Imaging Artifacts for Cryosurgery Training (original) (raw)
Abstract
This study presents an efficient computational technique for the simulation of ultrasound imaging artifacts associated with cryosurgery based on nonlinear ray tracing. This study is part of an ongoing effort to develop computerized training tools for cryosurgery, with prostate cryosurgery as a development model. The capability of performing virtual cryosurgical procedures on a variety of test cases is essential for effective surgical training. Simulated ultrasound imaging artifacts include reverberation and reflection of the cryoprobes in the unfrozen tissue, reflections caused by the freezing front, shadowing caused by the frozen region, and tissue property changes in repeated freeze–thaw cycles procedures. The simulated artifacts appear to preserve the key features observed in a clinical setting. This study displays an example of how training may benefit from toggling between the undisturbed ultrasound image, the simulated temperature field, the simulated imaging artifacts, and an augmented hybrid presentation of the temperature field superimposed on the ultrasound image. The proposed method is demonstrated on a graphic processing unit at 100 frames per second, on a mid-range personal workstation, at two orders of magnitude faster than a typical cryoprocedure. This performance is based on computation with C++ accelerated massive parallelism and its interoperability with the DirectX-rendering application programming interface.
Keywords: cryosurgery, prostate, ultrasound, rendering, ray tracing, training, bioheat simulation, imaging simulation
Introduction
Cryosurgery aims at the destruction of tissues by freezing.1 A key application in cryosurgery is a minimally invasive procedure to destroy cancerous tumors within the prostate.2 Prostate cryosurgery is performed by strategically placing an array of cooling probes (also called cryoprobes) within a prespecified target region.3 Transrectal ultrasound (TRUS) imaging is most frequently used to monitor prostate cryosurgery. Placement of minimally invasive cryoprobes relies on the imaging artifacts created by the cryoprobes, which have the shape of long hypodermic needles with sharp-pointed tips. Monitoring the frozen region formation also relies on ultrasound (US) imaging artifacts, where the tissue becomes opaque upon freezing.4 In order to advance surgical training,5 a virtual cryosurgery setup can be envisioned, where a trainee can practice cryoprobe placement under simulated TRUS imaging. The same virtual cryosurgery setup can be further envisioned to simulate the US image of the frozen region as the cryoprocedure progresses. It is the unmet need for simulating the corresponding US artifacts that motivates the current study. In order to make such a virtual setup, a practical reality in surgical training, simulations of US images must be performed in real time and their outcomes must appear realistic.5
The B-mode US images typically used in cryosurgery are produced by emitting a high-frequency sound wave from the TRUS transducer into the tissue. As the US energy propagates through the tissue, portions of it may be transmitted, absorbed, or reflected, depending on the local material properties. Inhomogeneity in the local acoustic impedance of the tissue may cause some of the acoustic energy to scatter, and some reflect back to the transducer. This reflected portion of the acoustic energy is then processed to reconstruct the US image, whereas the signals are normalized to account for the fainter echoes from tissues further away from the transducer. This normalization process is called time gain compensation (TGC), which is used to create the final image.
A significant body of literature exists on US imaging simulations,6 where simulation approaches are conveniently classified as wave based, interpolation based, or ray based, but mixed approaches have also been reported.7 In general, the wave-based approach attempts to mimic an acoustic wave as it propagates through the tissue. This can be accomplished by either spatial impulse response rendering, applying a K-space method for acoustic propagation, or directly solving the Westervelt equation, with the application of Green functions as one possibility.8–10 Unfortunately, the computational costs typically associated with acoustic field simulations prohibit the use of regular wave-based approaches for real-time applications, and approximation methods must be devised.
The interpolative-based approach for US imaging simulations is probably the most popular approach for real-time applications.7,11 Here, prerecorded volumetric images obtained from magnetic resonance imaging, computerized tomography, or US are sliced along the desired plane to form a 2-dimensional base image. Next, various texturing techniques are used to create the speckle pattern seen in native images. Finally, imaging artifacts are typically added ad hoc, after the speckle pattern has been integrated. As a result of this sequential approach, simple artifacts can be quickly generated, but complex artifacts—such as those originating from multiple reflections—cannot be realistically represented.
Ray tracing methods have proven very successful in the field of optics, when the structures are large in comparison with the wavelength being used for imaging.12 This is not necessarily the case for US imaging, since many small features within the tissue may nonlinearly affect ray propagation. Although smoothing of the material properties, as is often done for seismic simulation, can improve the resulting images under some conditions,13 it is not required for nonlinear ray tracing in biological tissues, as these small scale variations tend to add speckle texture to the image rather than changing the direction of the rays.
The ray tracing approach is based on tracking the position of discrete points on a wave front as it propagates, while being reflected and refracted along the path of propagation. Many state-of-the-art techniques for ray tracing simulations require surface models of the geometry to define the boundaries between the various subregions in the domain.7 In such techniques, each time that a projected ray hits a translucent boundary, the reflected and refracted rays are calculated. Unfortunately, these techniques may not be suitable for tissue freezing in cryosurgery, due to the nondiscrete nature of the medium at the freezing front. An alternative technique that can potentially capture the nonlinear effects at the freezing front uses volumetric ray tracing, which does not require definition of an explicit surface model. Reported volumetric ray tracing algorithms14–16 are based on tracing straight rays with uniform sampling points, which can only produce basic US artifacts such as reflection and shadowing. The available algorithms cannot represent more complex artifacts typical to cryosurgery, such as reverberation by cryoprobes and energy absorption during tissue freezing. Using such approaches would necessitate adding cryoprobes to the image on an ad hoc basis.17
Methods
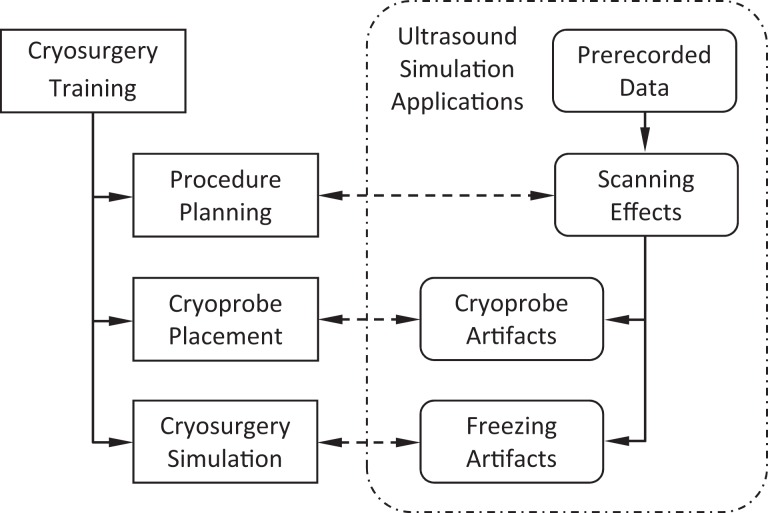
The current study aims at developing means for realistic simulations of US imaging artifacts for cryosurgery training. The conceptual design for integrating US imaging simulations with cryosurgery training is schematically illustrated in Figure 1. Toward this goal, the key building blocks for cryosurgery training have already been developed, including procedure planning methods,18–20 training strategies for cryoprobe placement,5 and bioheat simulation methods for the cryoprocedure.21 Furthermore, the feasibility of a cryosurgery training approach has been presented recently. With reference to Figure 1, prerecorded US data sets of five individuals have already been developed in previous studies and used to reconstruct the prostate shape20,22,23 for computerized training.5,24,26 Furthermore, a realistic US scanning tool has been presented recently to enable intraoperative prostate reconstruction based on partial organ contours.25
Figure 1.
Schematic illustration of the conceptual approach to integrate ultrasound simulations with cryosurgery training, where cryosurgery simulation refers to the full-scale bioheat transfer simulation.
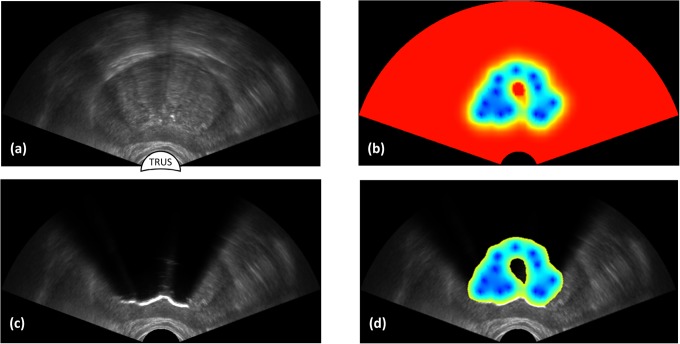
A hybrid method is proposed in the current study to produce realistic US imaging artifacts for cryosurgery training in real time, combining features from the interpolative and ray tracing approaches. This method is designed to (i) display imaging artifacts resulting from cryoprobes insertion and (ii) display the effects of tissue freezing as the cryoprocedure progresses. A general view of the targeted outcome is displayed in Figure 2, where the scanned prostate region (Figure 2a) and bioheat simulation results (Figure 2b) are combined to simulate freezing artifacts (Figure 2c). Figure 2d displays a hybrid US-thermal field presentation to provide the trainees with insight into the thermal process affecting imaging artifacts. With such a presentation, the trainee can correlate the thermal field with criteria for cryosurgery success5 and the location of cancerous tumors.24 Figure 2 was generated using the mathematical formulation and code implementation described in the next two sections.
Figure 2.
Application of ultrasound imaging for cryosurgery planning and training: (a) scanning of a prerecorded ultrasound imaging data set, where the contour of the prostate is highlighted with a dashed line; (b) bioheat transfer simulation results of the cryoprocedure; (c) simulated frozen region effect based on the bioheat transfer simulation results and the artifacts simulation method proposed in the current study; and (d) temperature field within the frozen region overlaid on the simulated ultrasound image as a training means to explain imaging artifacts.
Mathematical Formulation
With reference to Figure 3, the proposed computation scheme for US image generation consists of six steps:
- simulation of bioheat transfer in the target area;
- determination of the acoustic properties within the domain, based on the local material properties and thermal history;
- simulation of the US ray paths from the transducer into the domain (Figure 3a);
- calculation of acoustic energy propagation along the simulated US rays;
- TGC evaluation of the energy returning to the transducer; and
- modifications to the brightness of the previously recorded US texture to account for the TGC results.
Figure 3.
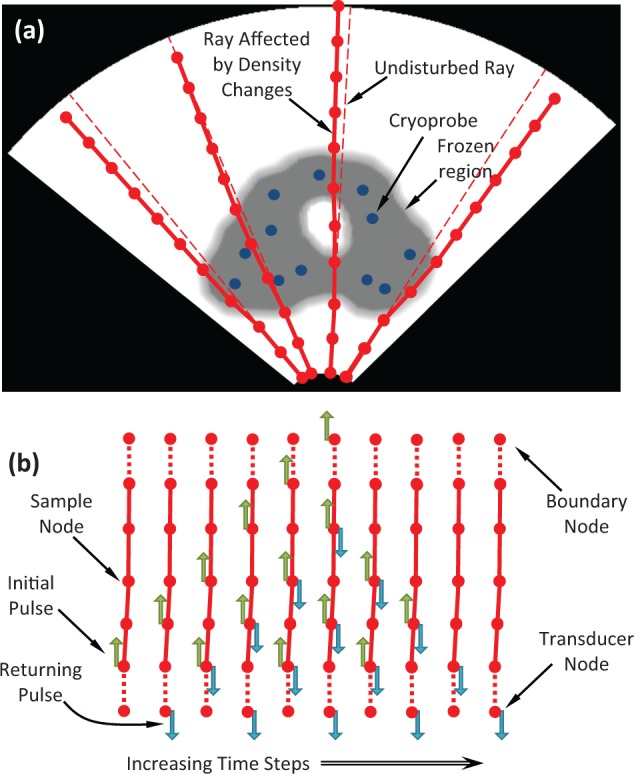
Schematic illustration of the artifact calculation process in a tissue of nonuniform acoustic impedance: (a) nonlinear ray propagation with speed-of-sound dependent sampling in the original polar coordinate system, and (b) wave intensity propagation between sample points along a single ray over consecutive time steps, based on reflection and transmission properties after transformation to a Cartesian coordinate system.
A framework for parallel computation of bioheat transfer during cryosurgery has been established previously and is adopted here as a choice of practice for step I of the proposed method.27,28 Results of this simulation are used to evaluate the local material properties in step II. As appropriate, linear interpolation is used to determine the acoustic properties and their derivatives at the necessary locations within the domain.
The simulation of ray propagation from the transducer in step III requires a set of acoustic properties, including echogenicity, speed of sound, acoustic impedance, and the tissue absorption of wave energy. In the case of prostate cryosurgery, these properties are further dependent upon the presence of cryoprobes and on the thermal history in the tissue. In particular, step III is used to determine the advancement and deflection of the US wave as it propagates through the tissue. The ray’s path of propagation through the domain is calculated by solving the Eikonal equation12:
| ddl(1Vdr→dl)=∇(1V) ⇒ ddl(1Vdxjdl)=∂∂xj(1V) | 1 |
|---|
where l is the distance measured along the ray path, V is the velocity, r→ points to the direction ray propagation, and xj are the principal orthogonal components. Equation 1 represents a generalization of Snell law of refraction for a continuous and nonhomogeneous medium, which is solved in this study with the application of the nonlinear ray tracing scheme described by Seron et al.12 In essence, this equation describes the change in ray direction as a function of the variation in speed of sound as it propagates through the domain. Equation 1 is solved in a Cartesian geometry (Figure 3b), after transformation of the prerecorded imaging data set from the polar coordinate system typical to TRUS imaging (Figure 3a).
Equation 1 is solved using a forward Euler scheme discretization:
| dxji+1dl=(1V)idxjidl+Δli ∂∂xj(1V)i(1V)i+1 | 2 |
|---|
where Δ_l_ is an incremental distance along the ray, and i is the increment index.
For convenience in presentation, the change in direction of the ray, v→i, is defined as:
where the value of x→i+1 can also be approximated using a forward Euler scheme:
| x→i+1=x→i+Δli+1v→i‖v→i‖ | 4 |
|---|
The procedure described by Seron et al12 is modified by applying fixed time intervals through the simulation, while computing the resulting distance of travel, Δ_l_, as the product of the variable wave propagation speed, V, and the time interval. The selection of the time interval length is dictated by the required simulated image resolution. In essence, it is this dependency of the propagation distance on the speed of sound that allows the depiction of imaging artifacts, where objects may appear farther or closer to the US transducer.6
Energy propagation calculations in step IV represent one of the new contributions in the current study. After the path of each ray is identified, the amount of energy transmitted along the ray is calculated—from the simulated transducer into the tissue and back to the transducer. Here, the propagation of acoustic wave energy between the sample points (calculated in step III) along each ray is calculated repeatedly, after being emitted from a simulated transducer. The material properties at each of those sampled points are used to determine the portion of the energy transmitted along the ray and the portion of it that is reflected back along the same ray. The ratio of energy reflected between two sample points is given by:
| ρimp=(Zi+1−Zi)2(Zi+1+Zi)2 | 5 |
|---|
where Zi and Z i + 1 are acoustic impedances at sample points i and i + 1. The acoustic impedance is calculated by:
where V refers to the local and instantaneous speed of sound, and d is the mass density of the tissue at the specific location.
At every sample point, the amount of energy reflected, Eref, absorbed, Eabs, and transmitted, Etrans, along the ray must be calculated from the total acoustic wave energy arriving at that particular point, Etot. Only the portion of the energy reflected due to acoustic impedance mismatches between sample points will be reflected back along the ray. Qualitatively, this is analogous to a ray reflecting off an interface between different media, where the normal of the interface and the incident ray direction are not parallel. This reflection is represented in the current study by modifying the Lambertian model,16 where the energy reflected along the ray is given by:
| Eref=Etot [ρimpcos(θ)+ρecho(1−ρimp)] | 7 |
|---|
where ρecho is the echogenicity reflectance, and the reflection angle, θ, is calculated by:
| θ=cos[xn∂∂x(1V)‖xn‖×‖∂∂x(1V)‖]−1 | 8 |
|---|
Equation 7 represents a modification of the standard Lambertian reflectance model in two ways. The first modification concerns the addition of the echogenicity reflectivity term, ρecho. This term is designed to account for the portion of energy that is not reflected due to Lambertian effects but that is reflected due to small variations within the tissue, which give rise to the speckle US image pattern and to the image’s overall brightness. It follows that the total reflectivity equals the sum of the Lambertian reflection component and the echogenicity component. The second modification is in the use of the gradient vector of the acoustic impedance instead of the normal to surface vector, as is typically the case for the standard reflection model. The gradient application can be viewed as a continuum representation of the discrete and ordinary equation. Conservation of energy dictates that the amount of transmitted energy must be equal to the difference between the total energy and the sum of the reflected and absorbed portions of it:
| Etrans=Etot (1−α) {1−[ρimp+ρecho(1−ρimp)]} | 9 |
|---|
where α is the absorption coefficient.
The above-mentioned equations for calculating the transmission and reflection of wave energy between sample points are applied repeatedly in order to effectively integrate these quantities over time. The repeated calculations of those quantities allow for wave energy to be reflected back and forth multiple times along each ray, thereby providing a realistic simulation of both single and multiple reflection artifacts. Such multiple reflection artifacts may develop around the tissue-embedded cryoprobes, where the wave energy propagates between two highly reflective interfaces multiple times. When N samples are taken along a ray, energy propagation calculations must be repeated 2N times for each sample point in order to allow for the simulated transmitted energy to travel all the way from the transducer to the furthest sample point and back. Figure 3b depicts the propagation of an initial pulse of energy along a single ray, where the pulses of reflected and transmitted components at each sample point are calculated.
In step V of the proposed scheme, the returning US simulated echoes are normalized. This normalization process is performed in order to account for the fainter echoes that arrive from distant portions of the tissue, which underlines the TGC process,6 where the gain applied to the signal is a function of time. In step VI, TGC results are blurred using a Gaussian filter to take into account the finite ability to focus the waves used to facilitate US imaging. Finally, pixel intensity values from the existing US image are modified based on the TGC signal strength compared to a reference value to allow for a realistic representation of imaging artifacts.
Code Implementation
The most computationally expensive aspect of the US simulation is the calculation of the energy propagated along the rays. For example, for M rays and N sampling points along each ray, the number of required operations is proportional to M × N2 (typical values applied in the current study: M = 500, N = 300). Hence, efforts to optimize the number of sampling point calculations are highly warranted in order to achieve real-time US simulations. This challenge is addressed by optimizing code implementation while taking advantage of the graphics processing unit (GPU). Although various optimization steps were taken in order to speed up the simulation, summarized subsequently are the effects of information flow strategies, field decomposition strategies, and memory usage effects, all with reference to a baseline, naive implementation.
Naive implementation
A baseline implementation of the proposed scheme consists of (i) storing all the necessary data for each sample point in global memory; (ii) running a kernel for each sample point that would read the necessary values from global memory, perform the corresponding calculations, and write the result back to the global memory; and (iii) repeating this kernel for 2N cycles to account for acoustic wave propagation back and forth along a ray discretized into N sampling points. In terms of runtime, this naive implementation performs very poorly due to extensive reads and writes to global memory. Furthermore, a considerable amount of application programming interface (API) overhead is associated with running the GPU kernel 2N times, which is inherent to the initialization of a GPU task. Note that it is necessary to call the kernel in a loop, since all sample points from a specific iteration must be calculated before the next iteration can executed, whereas there is no effective means to synchronize simultaneously running threads on different groups of GPU processors.
Information flow strategies
It can be concluded from Figure 3 that the propagation of information along a specific ray exhibits a finite speed. It follows that any numerical node that is farther than the signal information penetration depth, or that information from it cannot reach the transducer in time to contribute to image formation, can be eliminated from calculations with no adverse effect. Those numerical points are said to be outside the signal information envelop in the context of the current study. Eliminating numerical points outside the information envelop accelerates runtime by a factor of 2. Further note that the numerical scheme has an even–odd information flow pattern, in the sense that energy flow calculations switch between even and odd nodes on successive iterations. It follows that energy calculations can alternate between even and odd nodes on successive iterations with no adverse effect, which is expected to accelerate runtime by another factor of 2. Hence, carefully accounting for information flow during code implementation can accelerate simulation runtime by a factor of 4, regardless of the computation platform selected for the task.
Field decomposition strategies
For an instantaneous temperature field, energy calculations along each ray can be performed independently. It follows that decomposition of the simulation domain, such that a single group of processors on the GPU is responsible for energy calculations along a given ray, can improve parallel processing. Following this decomposition, processors synchronization within a specified group can be straightforwardly done with C++ accelerated massive parallelism. This strategy further allows for the outer loop, which is used to call the kernel 2N times, to move into the kernel itself. Such domain decomposition reduces the API overhead to a single kernel invocation.
Memory usage
Domain decomposition and the need to only call the kernel function a single time for a given ray enable the use of the lower latency shared memory instead of the much slower global memory. Once a kernel is invoked, all the necessary data are transferred from global to shared memory. Then, as the processor group performs the corresponding 2N calculation steps, all read and write operations are performed in the shared memory. It is not until the last stage of computation when the calculated results are transferred back to the global memory. As a result, all of the intermediate global memory operations are eliminated. Using the field decomposition strategy in combination with the more efficient memory usage has accelerated US simulations by a factor of 5 in the current study.
Simulation Protocol
The proposed numerical scheme was analyzed based on a 3-dimensional (3D) prostate US data set reported previously.20,22,23 The 3D shape of the prostate was segmented using a previously developed semiautomated method.29 Once the 3D shape of the prostate was reconstructed, an array of cryoprobes was virtually placed at a single insertion depth, using a computer-generated optimized layout based on the bubble packing method.18 Next, a bioheat transfer simulation was executed using a GPU-based embodiment26 of an efficient numerical scheme for the bioheat transfer process.21 This combination of a numerical method and a coding framework is characterized by a typical runtime of 2 seconds for a complete procedure.26
Ultrasound image analysis in the current study is based on a typical case study of 12 identical cryoprobes having a diameter of 1.3 mm and active cooling length of 25 mm. The initial temperature in the entire domain is 37°C, and the domain is large enough such that the bioheat transfer problem can be considered as taking place in an infinite domain for the duration of freezing21 (in practice, a domain volume three times as large as the prostate size satisfies this requirement21). A urethral warmer, 6 mm in diameter, was simulated by maintaining the urethra wall at a constant temperature of 37°C throughout the simulation. The simulated thermal history at the cryoprobes is comprised of an initial cooling from 37°C to −145°C in the first 30 seconds and constant temperature thereafter, until the completion of the simulated cryoprocedure and deactivation of the cryoprobes. The bioheat transfer simulation continued after cryoprobe deactivation, until the treated region returned to its initial temperature.
The cryoprobes were deactivated when the frozen region best matched the prostate contour, using the defect region concept as a measure.19 In broad terms, a defect region represents unfrozen areas internal to the prostate and frozen areas external to the prostate. It follows that the entire prostate is considered a defect at the beginning of simulation, but if the cryoprobes are activated for long enough and the cryoprobes are powerful enough, most of the defect may become external. There is a point in time along this transition from internal to external defect that the overall defect value becomes minimum, which is the point of simulation termination in the current study. The bubble packing planning method referenced previously aims at uniform distribution of the defect along the edge of the target region (ie, the prostate), which also results in a global minimum of the defect when variable cryoprobe layouts are considered. The resulting thermal field along the bioheat transfer simulation was used as input for the US simulation method described in the previous section.
Results and Discussion
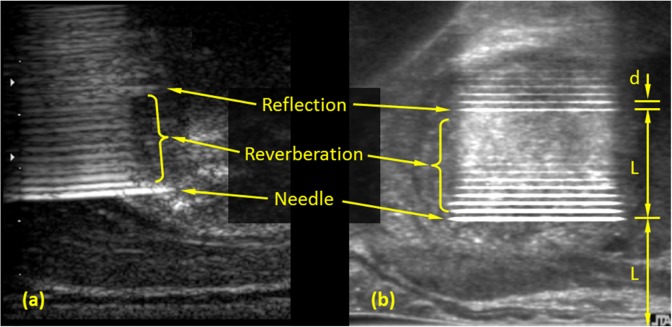
Figures 4 and 5 display typical artifacts due to the presence of cryoprobes in the unfrozen prostate. From a cryosurgery training perspective, these artifacts are associated with the challenges typical to cryoprobe placement according to the preplanning. Figure 4 displays reflection and reverberation artifacts along the cryoprobe in a sagittal plane, which is perpendicular to the transverse plane images displayed in Figures 2 and 3. Figure 4a displays an actual US image of a hypodermic needle in the prostate, having comparable dimensions to the cryoprobes specified previously.21,27 Figure 4b displays simulated cryoprobe artifacts following the mathematical formulation described previously. It can be seen that the simulated artifacts contain the same features as the actual image. The most notable artifact being the periodic hyperechoic regions extending behind the cryoprobe, with a period equals the probe diameter, d. This periodic repetition is marked as reverberation in Figure 4. Additionally, a brightening of the reflection occurs at twice the distance between the US transducer and the cryoprobe, L. The reverberation with the maximum brightness is marked as reflection in Figure 4, at a distance 2_L_. This brightening effect is another multiple reflection artifact, but this time occurring between the highly reflective surface of the cryoprobe and the US transducer. Note that the overall brightness of the cryoprobe and its reverberations may vary among real procedures due to the specific clinical setup and tissue properties and can be adjusted globally between repeated US simulations.
Figure 4.
Sagittal view of cryoprobe artifacts: (a) ultrasound-imaged needle in the prostate and (b) integration of simulated cryoprobe artifacts with an undisturbed image of the prostate.
Figure 5.
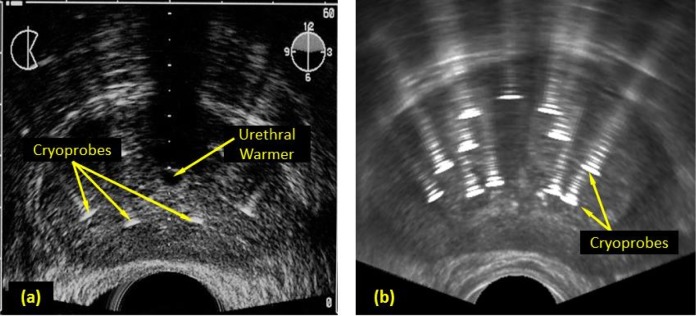
Transverse view of cryoprobe artifacts before the beginning of freezing: (a) ultrasound-imaged cryoprobes placed within a prostate (Adapted with permission from Cooperberg30) and (b) integration of simulated cryoprobe artifacts with an undisturbed image of the prostate.
Figure 5 displays the corresponding artifacts in a transverse view. Similar to the results in Figure 4, cryoprobe reverberations are observed, radiating away from the US transducer with diminishing amplitude. Another feature displays in Figure 5 is the extended width of the cryoprobe image and its reverberations. The width of the imaged cryoprobe is five times its actual size, which is the result of the finite size of the focused US wave. Nevertheless, the same extended width effect is displayed both in the simulated image and the reference image. Note that the source US image used for Figure 5b is of higher resolution and quality with respect to Figure 5a. Further note that the global intensity of each of the figures is adjustable.
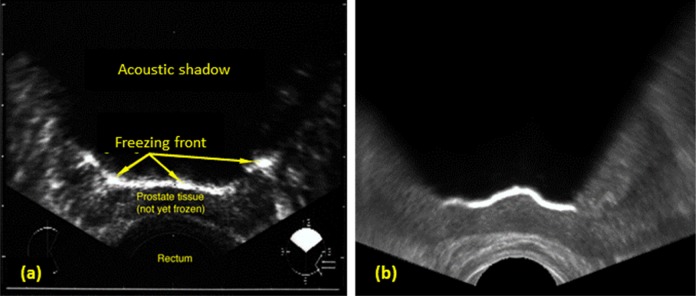
Probably, the most important artifact to simulate for virtual cryosurgery training is the shadowing effect due to freezing.2,4 In practice, this artifact is used to track the progression of the freezing front from the cryoprobes toward the US transducer. This artifact is characterized by a hyperechoic region at the freezing front, where the acoustic wave energy is reflected off due to the sharp change in the acoustic impedance between the unfrozen and frozen regions. This artifact is further characterized by an opaque region behind the freezing front, as only a small portion of the wave energy is able to pass through the frozen region. Figure 6 displays the similarity between an actual transverse US image and a simulated image during cryosurgery. Note the granularity difference between both images displayed in Figure 6, which is due to the different US hardware used to create Figure 6a during cryosurgery, as opposed to the base texture created from an untreated tissue in Figure 6b.
Figure 6.
Transverse view of the frozen region during cryosurgery: (a) ultrasound-imaged frozen region (Adapted with permission from Cooperberg30) and (b) integration of simulated frozen region artifacts with an undisturbed image of the prostate.
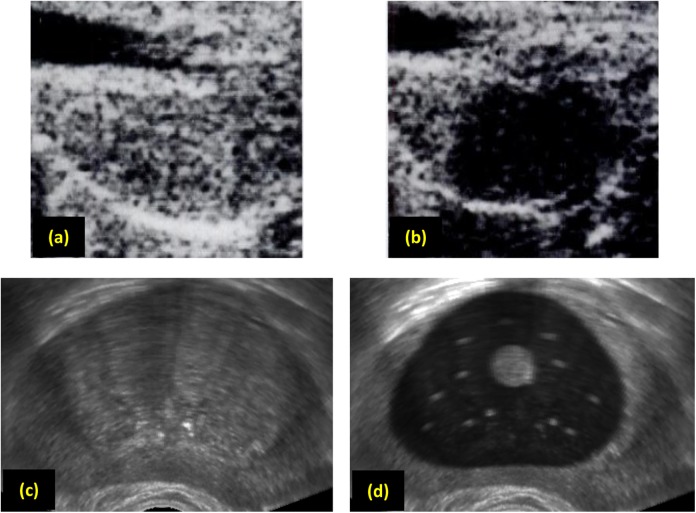
Useful information can further be obtained from US imaging postcryosurgery, which is attributed to a reduction in echogenicity in the frozen–thawed region.2 This artifact can help cryosurgeons track the regions of the tissue that have been frozen during the procedure, especially when multiple freeze–thaw cycles are performed. Figures 7a and 7b display this effect in a dog prostate model, whereas Figures 7c and 7d display a somewhat similar effect in the current study. In order to produce the effect displayed in Figure 7d, the lowest temperature achieved by each node during the heat transfer simulation is saved. Next, the localized echogenicity value is calculated based on the minimum temperature achieved, where frozen–thawed nodes receive an echogenicity value of 20% of that of a material that did not experience freezing at some point throughout the procedure.
Figure 7.
Transverse view of the prostate: (a) dog prostate before freezing, (b) dog prostate after thawing, (c) human prostate before freezing, and (d) human prostate after thawing. Images for the dog prostate were taken before and after a real cryosurgical procedure (Adapted with permission from Onik et al2), whereas the human prostate post-thawing is synthesized from a simulated thermal history of a cryoprocedure and an undisturbed image of the prostate.
Note that Figures 7a and 7b were created with an earlier US device (late 1980s) and a dog prostate model, whereas Figure 7c has been created on a newer generation device (mid 2000s) and a human prostate model. These differences in hardware quality, prostate models, and scanning procedures only permit a qualitative comparison of the postprocedure effects on imaging. Nevertheless, the capability of the US simulation to capture the freezing–thawing effect is important, and calibration of the material properties to create a more realistic presentation of this effect can be straightforwardly performed when comparable data become available. Note that the shadowing effect is not expressed when the entire tissue is unfrozen in between freezing–thawing cycles.
The benchmark cases described previously were performed on a desktop computer (i7 960, 3.2 GHz, 9.0 GB RAM), housing a dedicated Nvidia GTX 580 GPU in real time at a rate of 100 frames per second (fps). Between each two consecutive frames at that rate, the following processes where completed: (i) a complete 3D bioheat transfer simulation, (ii) imaging artifacts calculation for the entire field, and (iii) display of the results on the computer monitor. Toggling between the various presentations displayed in Figure 2 does not slow down those operations, which were performed on the same GPU. This performance makes the proposed mathematical formulation, combined with the proposed code implementation, excellent means for computerized training of cryosurgery. Furthermore, since the GPU implementation of the bioheat transfer alone is already two orders of magnitude faster than real time, with benchmarking data and scaling analysis presented previously,27 and since a complete US imaging artifacts calculations and display is done under 10 milliseconds (leading to a presentation rate of 100 fps), there is no apparent limitation to speed up the integrated bioheat US simulation procedure described previously by two orders of magnitude on the same machine.
Conclusions
As a part of an ongoing project to develop computerized tools for cryosurgical training,5,28 the current study presents a mathematical method for real-time simulations of US imaging artifacts. A six-step scheme is proposed to generate the imaging artifacts, and GPU-based real-time implementation strategies are discussed. The proposed implementation relies on a previously developed scheme for GPU-based bioheat transfer simulations of cryosurgery.26,27,28 The temperature field generated by bioheat transfer simulations is used as an input for US artifacts calculations.
Simulated US imaging artifacts include reverberation and reflection of the cryoprobes in the unfrozen tissue, reflections caused by the freezing front, shadowing caused by the frozen region, and tissue property changes in repeated freeze–thaw cycles procedures. The intensity, brightness, and granulation of the recorded image may vary between clinical procedures, based on the specific US hardware, tissue properties, and scanning technique. Nevertheless, the simulated artifacts in the current study appear to preserve the key features observed in a clinical setting, which makes the proposed scheme suitable for cryosurgery training. It is proposed here that calibration means may further be developed to create a wider trainee exposure to available US hardware and clinical conditions. This calibration is beyond the scope of the current study and requires a survey of commonly available imaging devices.
This study displays an example of how training may benefit from toggling between (i) the undisturbed US image, (ii) the simulated temperature field, (iii) the simulated imaging artifacts, and (iv) a hybrid presentation of the temperature field superimposed on the US image to explain physical effects. The proposed scheme is demonstrated to simulate US-monitored cryoprocedure in real time, at a rate of 100 fps, on a midrange personal workstation. Simple calculations suggest that simulation runtime can exceed real-time cryosurgery operation by two orders of magnitude with no adverse effects.
Acknowledgments
The authors wish to thank Ellen Keelan for her invaluable contribution to the preparation of this manuscript.
Abbreviations
API
application programming interface
3D
3-dimensional
fps
frames per second
GPU
graphics processing unit
TGC
time gain compensation
TRUS
transrectal ultrasound
US
ultrasound
Footnotes
Authors’ Note: The content is solely the responsibility of the authors and does not necessarily represent the official views of the National Cancer Institute or the National Institutes of Health.
Declaration of Conflicting Interests: The author(s) declared no potential conflicts of interest with respect to the research, authorship, and/or publication of this article.
Funding: The author(s) disclosed receipt of the following financial support for the research, authorship, and/or publication of this article: This study was supported by Award Number R01CA134261 from the National Cancer Institute.
References
- 1.Cooper I, Lee A. Cryostatic congelation: a system for producing a limited, controlled region of cooling or freezing of biologic tissues. J Nerv Ment Dis. 1961;133(3):259–266. [PubMed] [Google Scholar]
- 2.Onik G, Cobb C, Cohen J, Zachbar J, Porterfield B. US characteristics of frozen prostate. Radiology. 1988;168(3):629–631. [DOI] [PubMed] [Google Scholar]
- 3.Gage AA. Cryosurgery in the treatment of cancer. Surg Gynecol Obstet. 1992;174(1):73–92. [PubMed] [Google Scholar]
- 4.Korpan NN. Atlas of Cryosurgery. 1st ed New York, NY: Springer; Wien; 2001. [Google Scholar]
- 5.Sehrawat A, Keelan RL, Shimada K, Rabin Y. Developing an intelligent tutoring system for prostate cryosurgery. Cryobiology. 2013;67(3):425–426. [Google Scholar]
- 6.Azhari H. Basics of Biomedical Ultrasound for Engineers. 1st ed Hoboken, NJ: Wiley; 2010. [Google Scholar]
- 7.Burger B, Bettinghausen S, Radle M, Hesser J. Real-time GPU-based ultrasound simulation using deformable mesh models. Med Imaging. 2013;32(3):609–618. [DOI] [PubMed] [Google Scholar]
- 8.Karamalis A, Wein W, Navab N. Fast ultrasound image simulation using the westervelt equation. Med Image Comput Comput Assist Interv. 2010;13(pt 1):243–250. [DOI] [PubMed] [Google Scholar]
- 9.Jensen JA. Field: a program for simulating ultrasound systems. Medical & Biological Engineering & Computing. 1996:351–353.8945858 [Google Scholar]
- 10.Hergum T, Langeland S, Remme E, Torp H. Fast ultrasound imaging simulation in k-space. IEEE Trans Ultrason Ferroelectr Freq Control. 2009;56(6):1159–1167. [DOI] [PubMed] [Google Scholar]
- 11.Dillenseger JL, Laguitton S, Delabrousse É. Fast simulation of ultrasound images from a CT volume. Comput Biol Med. 2009;39(2):180–186. [DOI] [PubMed] [Google Scholar]
- 12.Seron FJ, Gutierrez D, Guitierrez G, Cerezo E. Visualizing sunsets through inhomogeneous atmospheres Proceedings of the Computer Graphics International (CGI2004) Crete, Greece; 2004:349–356. [Google Scholar]
- 13.Hogan CM, Margrave GM. Ray-tracing and eikonal solutions for low-frequency wavefields. CREWES; Technical Report: 2007. [Google Scholar]
- 14.Kutter O, Karamalis A, Wein W, Navab N. A GPU-Based Framework for Simulation of Medical Ultrasound. Princeton, NJ: SPIE Medical Imaging; 2009:726117–726117. [Google Scholar]
- 15.Kutter O, Shams R, Navab N. Visualization and GPU-accelerated simulation of medical ultrasound from CT images. Comput Meth Prog Bio. 2009;94(3):250–266. [DOI] [PubMed] [Google Scholar]
- 16.Karamalis A. GPU Ultrasound Simulation and Volume Reconstruction [master’s thesis] München, Germany: Technischen Universität München; 2009. [Google Scholar]
- 17.Zhu Y, Magee D, Ratnalingam R, Kessel D. A virtual ultrasound imaging system for the simulation of ultrasound-guided needle insertion procedures In: Proceedings of Medical Image Understanding and Analysis 2006: 61–65 [Google Scholar]
- 18.Rossi MR, Tanaka D, Shimada K, Rabin Y. Computerized planning of cryosurgery using bubble packing: an experimental validation on a phantom material. Int J Heat Mass Tran. 2008;51(1):5671–5678. [DOI] [PMC free article] [PubMed] [Google Scholar]
- 19.Lung DC, Stahovich TF, Rabin Y. Computerized planning for multiprobe cryosurgery using a force-field analogy. Comput Method Biomech Biomed Eng. 2004;7(2):101–110. [DOI] [PubMed] [Google Scholar]
- 20.Tanaka D, Shimada K, Rabin Y. Two-phase computerized planning of cryosurgery using bubble-packing and force-field analogy. J Biomech Eng-T Asme. 2006;128(1):49–58. [DOI] [PMC free article] [PubMed] [Google Scholar]
- 21.Rossi MR, Tanaka D, Shimada K, Rabin Y. An efficient numerical technique for bioheat simulations and its application to computerized cryosurgery planning. Comput Meth Prog Bio. 2006;85(1):41–50. [DOI] [PMC free article] [PubMed] [Google Scholar]
- 22.Tanaka D, Shimada K, Rossi MR, Rabin Y. Cryosurgery planning using bubble packing in 3D. Comput Method Biomed. 2008;11(2):113–121. [DOI] [PMC free article] [PubMed] [Google Scholar]
- 23.Tanaka D, Rossi MR, Shimada K, Rabin Y. Towards intra-operative computerized planning of prostate cryosurgery. Int J Med Robot Comp. 2007;3(1):10–19. [DOI] [PMC free article] [PubMed] [Google Scholar]
- 24.Sehrawat A, Shimada K, Rabin Y. Generating prostate models by means of geometric deformation with application to computerized training of cryosurgery. Int J Comp Radiol. 2013;8(2):301–312. [DOI] [PMC free article] [PubMed] [Google Scholar]
- 25.Furuhata T, Song I, Zhang H, Rabin Y, Shimada K. Interactive prostate shape reconstruction from 3D TRUS images. J Comput Des Eng. 2014;1(4):272–288. [DOI] [PMC free article] [PubMed] [Google Scholar]
- 26.Keelan R, Zhang H, Shimada K, Rabin Y. GPU-based bioheat simulation to facilitate rapid decision making associated with cryosurgery training. Technol Cancer Res Treat. 2015. doi:10.1177/1533034615580694. [DOI] [PMC free article] [PubMed] [Google Scholar]
- 27.Keelan RL, Yanakawa S, Shimada K, Rabin Y. Computerized training of cryosurgery—a system approach. Cryo Lett. 2013;34(4):324–337. [PMC free article] [PubMed] [Google Scholar]
- 28.Shimada K, Furuhata T, Sehrawat A, Rabin Y. Generation of 3D prostate models for computerized cryosurgical trainer. Cryobiology. 2011;63(3):315–316. [Google Scholar]
- 29.Sehrawat A, Keelan R, Shimada K, Wilfong DM, McCormick JT, Rabin Y. Simulation-based cryosurgery intelligent tutoring system (ITS) prototype. Technol Cancer Res Treat. 2015. doi:10.1177/1533034615583187. [DOI] [PMC free article] [PubMed] [Google Scholar]
- 30.Cooperberg MR. Medscape[Online]. Web sitehttp://emedicine.medscape.com/article/458187-technique#aw2aab6b4b2, 2015.
