Intercellular mRNA trafficking via membrane nanotube-like extensions in mammalian cells (original) (raw)
Significance
mRNA molecules convey genetic information within cells, beginning from genes in the nucleus to ribosomes in the cell body, where they are translated into proteins. Here we show a mode of transferring genetic information from one cell to another. Contrary to previous publications suggesting that mRNAs transfer via extracellular vesicles, we provide visual and quantitative data showing that mRNAs transfer via membrane nanotubes and direct cell-to-cell contact. We predict that this process has a major role in regulating local cellular environments with respect to tissue development and maintenance and cellular responses to stress, interactions with parasites, tissue transplants, and the tumor microenvironment.
Keywords: membrane nanotubes, MS2, smFISH, β-actin mRNA
Abstract
RNAs have been shown to undergo transfer between mammalian cells, although the mechanism behind this phenomenon and its overall importance to cell physiology is not well understood. Numerous publications have suggested that RNAs (microRNAs and incomplete mRNAs) undergo transfer via extracellular vesicles (e.g., exosomes). However, in contrast to a diffusion-based transfer mechanism, we find that full-length mRNAs undergo direct cell–cell transfer via cytoplasmic extensions characteristic of membrane nanotubes (mNTs), which connect donor and acceptor cells. By employing a simple coculture experimental model and using single-molecule imaging, we provide quantitative data showing that mRNAs are transferred between cells in contact. Examples of mRNAs that undergo transfer include those encoding GFP, mouse β-actin, and human Cyclin D1, BRCA1, MT2A, and HER2. We show that intercellular mRNA transfer occurs in all coculture models tested (e.g., between primary cells, immortalized cells, and in cocultures of immortalized human and murine cells). Rapid mRNA transfer is dependent upon actin but is independent of de novo protein synthesis and is modulated by stress conditions and gene-expression levels. Hence, this work supports the hypothesis that full-length mRNAs undergo transfer between cells through a refined structural connection. Importantly, unlike the transfer of miRNA or RNA fragments, this process of communication transfers genetic information that could potentially alter the acceptor cell proteome. This phenomenon may prove important for the proper development and functioning of tissues as well as for host–parasite or symbiotic interactions.
An essential aspect of multicellular organisms is the ability of cells to communicate with each other over both long and short distances to coordinate cellular and organ processes. Although most studies have focused on small molecule- or protein-based intercellular communication, little is known about whether RNA molecules act by themselves as mediators of communication. Earlier reports suggested that RNAs may undergo transfer from one cell to another (1–3). However, only recently has it become evident that the extracellular fluids of animals (e.g., saliva, plasma, milk, and urine) contain RNAs, including mRNAs (or fragments thereof) and miRNAs. These RNAs are mainly found in extracellular nanovesicles (EVs) such as exosomes (4), although free extracellular ribonucleoprotein (RNP) particles have been identified (5). By using DNA microarrays (4, 6, 7) or RNA-sequencing (RNA-seq) (8), the content of EVs was shown to include a multitude of mRNAs and miRNAs. Thus, it has been proposed that the transfer of RNA between donor and acceptor cells could play an important physiological role.
However, examples of exosome-mediated intercellular mRNA transfer and its effects are few (4, 9–12). Only two studies provide qualitative evidence for the possible translation of transferred mRNA in recipient cells (4, 12), and no follow-up research was performed. In particular, there is a lack of quantitative data regarding the number and fate of transferred mRNA molecules at the single-cell level. Moreover, the existence of multiple types of EVs (e.g., exosomes, microvesicles, and apoptotic bodies) that can contain different kinds of cargo, including DNA (13), complicates the study and understanding of this process. In addition, it has been demonstrated that exosomes are transported into lysosomes upon internalization by recipient cells (13–15), and it is unclear how their RNA content reaches sites of translation within the cytoplasm.
Another consideration is that while the abundance of mRNAs in terms of species per copy number in EVs is unknown, the small volume of exosomes might not allow more than a limited number of mRNA molecules per exosome. The presence of full-length, functional mRNAs in exosomes was demonstrated in a few studies (4, 12), whereas others suggest that exosomes contain mainly RNA fragments (16–18). Indeed, one study found that only short mRNA fragments (<500 nt) are efficiently loaded into EVs, compared with longer transcripts (>1,500 nt) (17). Recent reports also suggest that miRNAs are present in very low abundance in EVs (i.e., individual miRNAs may range between 10−4 and 60 miRNA molecules per exosome in a given extracellular fluid) (19, 20), suggesting that miRNA transfer via EVs might have little influence on recipient cells unless selective mechanisms for uptake exist. Overall, these results suggest that a large number of EVs containing specific mRNAs (or mRNA fragments) or miRNAs might be necessary to significantly affect the physiology of recipient cells. Additionally, other modes of mRNA transfer were not investigated. Thus, an unbiased quantitative approach is needed to determine if mRNA is indeed transferrable and, if so, how it is transferred, and how much is transferred.
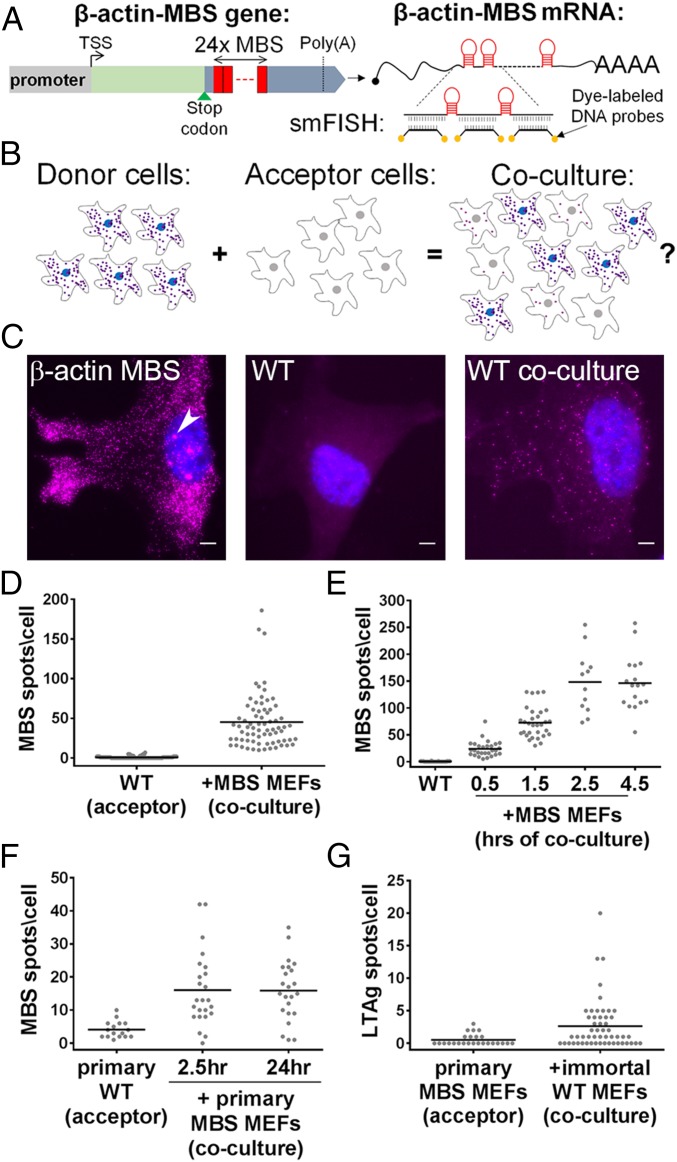
To study intercellular mRNA transfer in a quantitative and unbiased manner, we employed a simple strategy that is depicted in Fig. 1 A and B. In this model, “donor” and “acceptor” cells are cocultured together, and the transfer of specific mRNA species from donors to acceptors is visualized and quantified by single-molecule FISH (smFISH) (21, 22) or live imaging using the MS2 aptamer system (23). Donor and acceptor pairings can consist of cell types from any typical mammalian species (e.g., rat, mouse, human), provided that the query mRNA is expressed only in the donor cells. By using this model, we discovered that mRNAs can transfer between cells, and we provide absolute quantitative data on the number of transferred mRNA molecules per cell under different culture conditions.
Fig. 1.
Detection of β-actin–MBS mRNA transfer by smFISH. (A) A schematic depicting the β-actin–MBS gene (Left) and resulting mRNA (Right). mRNA detection was accomplished using smFISH with fluorescence-labeled DNA probes against the MBS sequence (aka “MBS probes”). Poly(A), polyadenylation site; TSS, transcription start site. (B) A schematic illustrating the basic experimental set-up. Donor cells (Left) that express a unique mRNA (e.g., β-actin–MBS; shown as small purple dots) were cocultured with naive acceptor cells (Middle) that lack this mRNA. If mRNAs undergo transfer from donor to acceptor cells, coculture yields labeling of the acceptor cells (Right). Each cell type was also cultured separately to assess mRNA-expression levels in donor cells or background staining in acceptor cells. (C) smFISH images of an immortalized donor MBS MEF, immortalized acceptor WT MEF, and acceptor WT MEF in coculture. Labels: blue, DAPI staining of the nucleus; magenta, Cy3-tagged MBS probes. The arrowhead indicates a transcription site. (Scale bars: 5 µm.) (D) Distribution of the number of β-actin–MBS mRNA spots observed in immortalized WT MEFs (expressing low levels of GFP) cultured alone or cocultured with donor MBS MEFs for 24 h. Each dot in D_–_G represents the score of the number of mRNAs detected in a single cell as obtained by smFISH. The horizontal bars in D_–_G indicate mean number of spots per acceptor cell. (E) Distribution of the number of β-actin–MBS mRNA spots in WT MEFs as a function of time after coculture with donor MBS MEFs. (F) Distribution of the number of β-actin–MBS mRNA spots in primary WT MEFs cultured alone or cocultured for 2.5 or 24 h with primary donor MBS MEFs. (G) Distribution of the number of LTag mRNA spots in primary MBS MEFs cocultured with LTag-immortalized donor WT MEFs for 24 h. See Dataset S1 for data on the number of cells scored, mean, SEM, and P values for each experiment.
We show that mRNA transfer requires direct cell-to-cell contact and that it appears to occur via membrane nanotubes (mNTs; also known as “tunneling nanotubes”) and not by diffusion. mNTs are long and thin cytoplasmic projections involved in direct contact-dependent intercellular communication between eukaryotic cells. mNTs were shown to be open-ended (24) and seem to allow the direct flow of cytoplasmic content between connected cells (25, 26). Indeed, mNTs support cell-to-cell transfer of small molecules, proteins, prions, viral particles, vesicles, and organelles in a variety of cell types (24–35). Here we demonstrate that mNTs appear to be involved in the transfer of mRNA molecules and identify mRNAs encoding a wide variety of proteins that undergo intercellular transfer in in vitro culture conditions.
Results
mRNA Can Transfer Between Cells.
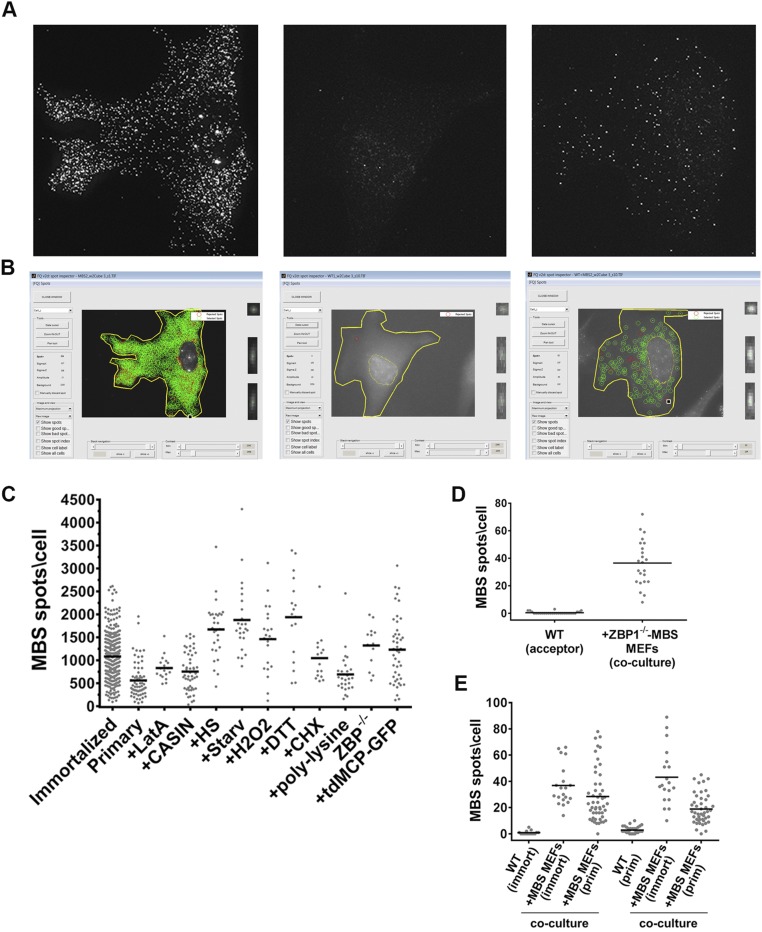
To determine whether cell–cell mRNA transfer occurs, immortalized WT mouse embryonic fibroblasts (MEFs) were cocultured with immortalized MEFs derived from a homozygous transgenic mouse that harbors 24 repeats of the MS2-coat protein (MCP)–binding sequence (MBS) at the 3′ UTR of the endogenous alleles of β-actin (referred to here as “MBS MEFs”) (23). smFISH with MBS-specific probes was used to analyze the number of β-actin–MBS mRNAs detected, and quantitation was performed using in-laboratory programs or FISH-quant (FQ) (SI Materials and Methods and Fig. S1 A and B) (36). MBS MEFs showed up to several thousand distinct FISH spots in each cell as well as bright nuclear foci representing transcription sites (Fig. 1_C_, Left, Fig. S1_C_, and Dataset S1) (23). Immortalized MBS MEFs are tetraploid and have up to four transcription sites (23). As expected, β-actin–MBS mRNAs and transcription sites were not detected in WT MEFs cultured alone (Fig. 1_C_, Center). However, when cocultured with MBS MEFs for 24 h, WT cells acquired MBS-labeled mRNAs (Fig. 1_C_, Right) at an average (± SEM) of 45 ± 4 mRNAs per cell and as many as ∼190 mRNAs per cell (Fig. 1_D_ and Dataset S1).
Fig. S1.
FQ spot analysis, the measurement of β-actin–MBS mRNA-expression levels in donor MBS MEFs, and mRNA transfer between ZBP1−/− and primary MEFs. (A) Use of FQ to score mRNA detection and transfer. The images shown in Fig. 1_C_ were filtered by FQ for analysis. Shown are the maximum projections of the filtered images. (Left) β-Actin–MBS donor cell. (Middle) WT acceptor cell. (Right) WT cell after coculture. (B) Spot detection of mRNAs using FQ. Shown are screen shots of the FQ spot inspector (version 2d) following spot analysis of the images shown in Fig. 1_C_ and in A. (Left) β-Actin–MBS. (Middle) WT cell. (Right) WT cell after coculture. Green circles indicate accepted spots. Red circles indicate rejected spots. (C) Distribution of the number of β-actin–MBS mRNA (MBS) spots in immortalized MBS MEFs, primary MBS MEFs, or immortalized MBS MEFs cultured under the different conditions described in the paper, as scored by smFISH using MBS probes. The horizontal bars indicate the arithmetic mean of MBS spots per donor cell in each experimental condition. Conditions included added Latrunculin A (+LatA), CASIN (+CASIN), heat shock (+HS), serum starvation (+Starv), hydrogen peroxide (+H2O2), DTT (+DTT), cycloheximide (+CHX), polylysine (+polylysine), and the absence of ZBP1 (ZBP1−/−) or the presence of tdMCP–GFP (+tdMCP–GFP). (D) Distribution of the number of β-actin–MBS mRNA spots in acceptor WT MEFs cocultured for 24 h with donor ZBP1−/− MBS MEFs, as scored by smFISH using MBS probes. Horizontal bars indicate the mean of MBS spots per acceptor cell. (E) Distribution of the number of β-actin–MBS mRNA spots in immortalized (immort) or primary (prim) acceptor WT cells cultured alone or cocultured for 2.5 h with donor immortalized MBS or primary MBS MEFs, as scored above. Horizontal bar indicate the mean number of MBS spots per acceptor cell.
To determine the global rate of mRNA transfer, we measured the number of transferred β-actin–MBS mRNAs in WT MEFs at 0.5, 1.5, 2.5, and 4.5 h after adding MBS MEFs to the culture. Under these conditions, MBS MEFs attached to the fibronectin (FN)-coated glass surface within 15–20 min. We detected transferred mRNA within 30 min of coculture (i.e., 10–15 min after MBS MEFs attached to the surface). The number of transferred mRNAs increased with time until reaching a plateau at 2.5 h after coculture (Fig. 1_E_ and Dataset S1).
Zipcode-binding protein 1 (ZBP1) is an RNA-binding protein (RBP) previously shown to be required for β-actin mRNA localization to the leading edge and focal adhesions in fibroblasts (37, 38) and to dendrites in neurons (39, 40). However, the absence of ZBP1 in the donor MBS MEFs (i.e., immortalized β-actin–MBS ZBP1−/− MEFs) did not hinder mRNA transfer to immortalized acceptor WT MEFs (Fig. S1_D_ and Dataset S1).
To determine that mRNA transfer is not due to immortalization, we examined whether it occurs between primary cells. Primary MEFs derived from WT or MBS mice were cocultured for either 2.5 or 24 h, and smFISH was performed to detect β-actin–MBS mRNA transfer. Similar to immortalized MEFs, transferred β-actin–MBS mRNA was detected in cocultured primary WT MEFs (Fig. 1_F_ and Dataset S1). This indicated that intercellular RNA transfer is not unique to immortalized cells. Cocultures of primary MEFs and immortalized MEFs yielded a twofold higher level of mRNA transfer compared with primary coculture (Fig. S1_E_ and Dataset S1). Coculturing primary and immortalized MEFs also allowed us to test the transfer of a second mRNA, SV40 large T antigen (LTag) mRNA, which is expressed only in the immortalized cells (Fig. S2; see Dataset S1 for expression levels in donor cells). By employing LTag-specific smFISH probes, we could detect the transfer of LTag mRNA from immortalized to primary MEFs (Fig. 1_G_ and Dataset S1). This indicates that transfer is not unique to β-actin mRNA or to MBS-labeled mRNAs.
Fig. S2.
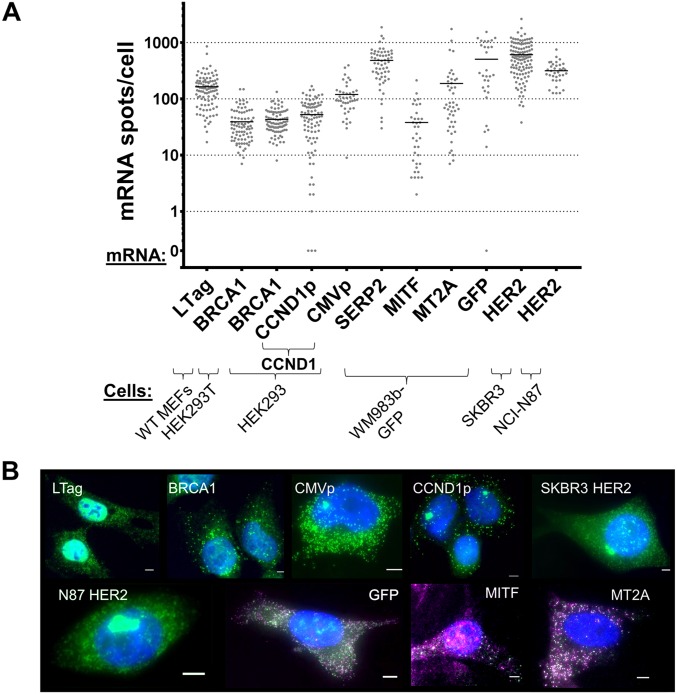
mRNA-expression levels in donor cells. (A) Distribution of the number of mRNA spots of the different studied mRNAs in the various donor cells, as listed. Note that the y axis is logarithmic scale. Scoring was performed using smFISH with the specific probes listed in B. Horizontal bars indicate the mean of mRNA spots per cell. (B) Representative FISH images of donor cells: blue, DAPI labeling of the nucleus; green, tiled FISH probes against LTag, human BRCA1, MBS (CCND1p– or CMVp-CCND1–MBS), and human HER2; green/magenta, evens/odds probe sets against GFP, human MITF, and human MT2A. (Scale bars: 5 µm.)
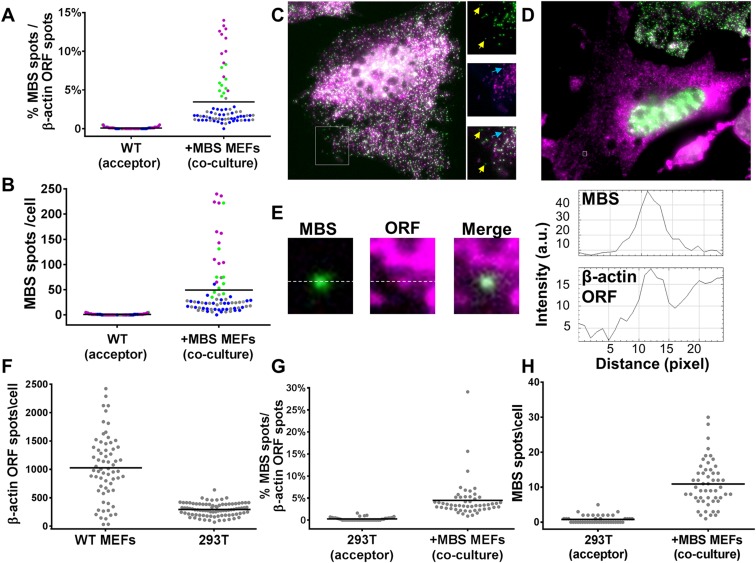
FISH experiments using Cy3-labeled MBS- and Cy5-labeled ORF-specific probes showed that an average of 3.5 ± 0.4% of the total β-actin mRNA found in WT MEFs (as detected by ORF-specific probes) was transferred from donor MBS cells (Fig. S3 A and B and Dataset S1). In these FISH experiments, most of the MBS spots detected in MBS MEFs were colocalized with ORF spots, although there were a few single-color–labeled spots (Fig. S3_C_). It is important to note that many MBS spots detected in WT MEFs also colocalized with ORF spots (Fig. S3 D and E), indicating that the transferred β-actin–MBS mRNAs detected in acceptor cells constituted full-length transcripts and not solely 3′ UTR or MBS fragments.
Fig. S3.
Co-FISH of β-actin–MBS mRNA transfer. (A) Percentage of transferred β-actin–MBS mRNA molecules out of the total β-actin mRNA population in acceptor cells. Transferred β-actin–MBS mRNA (detected with Cy3-labeled MBS probes) was scored in comparison with the total population of β-actin ORF mRNA (detected with Cy5-labeled β-actin ORF probes). Colored dots indicate results from different coculture experiments: WT MEFs and donor MBS MEFs cocultured for 3 h (green), 3.5 h (gray), and 6 h (blue); or APAF-1–KO MEFs and donor MBS MEFs cocultured for 3 h (magenta). Horizontal bars indicate the mean percentage of transferred β-actin–MBS mRNA spots out of the total β-actin ORF mRNA spots in acceptor cells. (B) Distribution of the number of β-actin–MBS mRNA spots in acceptor MEFs following coculture. The amount of transferred β-actin–MBS mRNA (detected with Cy3-labeled MBS probes) in the experiments shown in A was scored. Color-coding of the dots is as described in A. Horizontal bars indicate the mean of transferred MBS mRNA spots per acceptor cell. (C and D) Images of co-FISH with probes against MBS (green) and β-actin ORF (magenta). A colabeled donor MBS MEF is shown in C. Note the numerous MBS spots (green) and ORF spots (magenta). Panels to the right in C show zoomed-in (magnification: 1.5×) images of the boxed area in the main panel. Yellow arrows indicate MBS spots that do not colocalize with ORF probes. Blue arrows indicate ORF spots that do not colocalize with the MBS spots. An acceptor WT MEF in coculture is shown in the center of D. Note the low amounts of MBS spots (green) in comparison with ORF spots (magenta). (E) An example of a transferred β-actin–MBS mRNA spot (MBS; green) colocalized with a β-actin ORF spot (ORF; magenta) from the boxed area (magnification: 19×) in the cell in D. The adjacent graphs show pixel intensity across the white dashed median. (F) Distribution of the number of β-actin mRNA molecules in WT MEFs and HEK293T cells by using the β-actin ORF probe set. (G) Percentage of transferred β-actin–MBS mRNA molecules out of the total β-actin mRNA in acceptor HEK293T cells. Scoring was performed as in A. (H) Distribution of the number of transferred β-actin–MBS mRNA spots in acceptor HEK293T cells following coculture with MBS MEFs. The amount of transferred β-actin–MBS mRNA (detected with Cy3-labeled MBS probes) in the experiment shown in G was scored. Horizontal bars in F_–_H represent the mean number of transferred mRNA spots per acceptor cell.
mRNA Transfer Occurs in Heterologous Human/Murine Cell Cocultures.
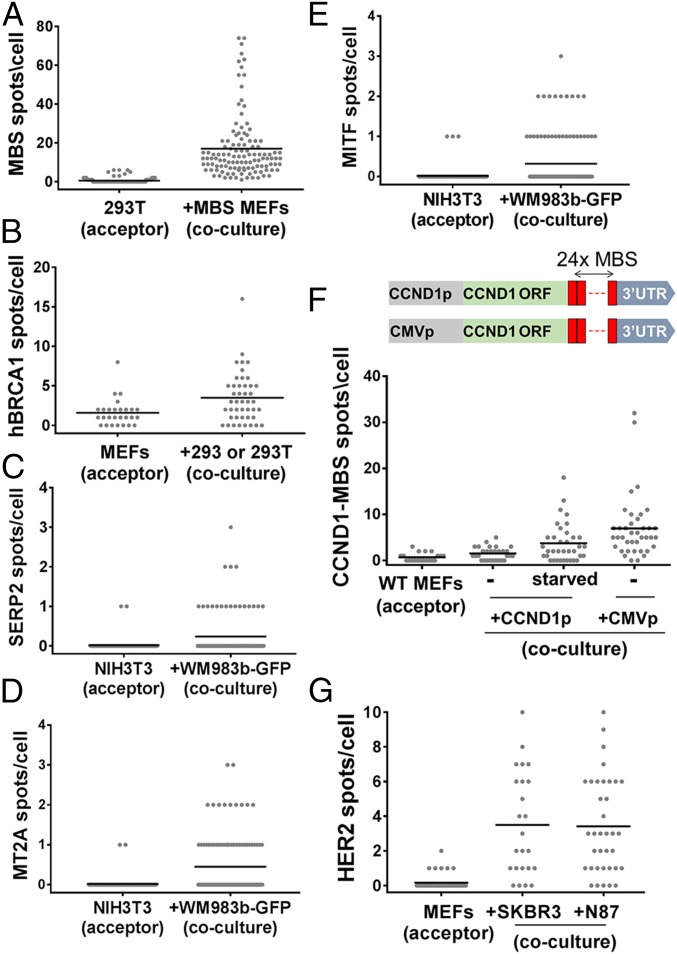
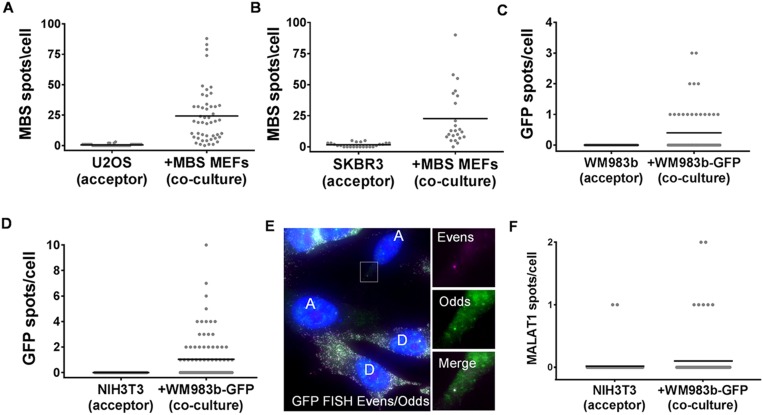
To test the generality of this process, we first determined if β-actin–MBS mRNA from MEFs can transfer to other cell types, including human cells. We therefore cocultured MBS MEFs with a human embryonic kidney cell line (HEK293T) and examined these cells for β-actin–MBS mRNA. Indeed, we found that β-actin–MBS mRNA can transfer from murine to human cells (Fig. 2_A_ and Dataset S1). Although the mean amount of endogenous β-actin mRNA levels in MEFs is about threefold higher than in HEK293T cells (Fig. S3_F_ and Dataset S1), the transferred mRNA constitutes 4.5 ± 0.6% of the β-actin ORF spots in HEK293T cells (Fig. S3 G and H and Dataset S1). This is similar in percentage to the amount of transferred mRNA between MEFs, which suggests that this is either a regulated or a limited process. β-Actin–MBS mRNA transfer was also detected in cocultures of MBS MEFs with the human osteosarcoma (U2OS) or adenocarcinoma (SKBR3) cell lines (Fig. S4 A and B and Dataset S1). This shows that the mechanism of transfer is conserved and confers the murine–human exchange of mRNA. Reciprocal transfer experiments using human-specific probes showed that an endogenous mRNA, such as BRCA1 mRNA (Fig. S2 and Dataset S1), transferred from HEK293T or HEK293 cells to MEFs (Fig. 2_B_ and Dataset S1). Likewise, endogenously expressed SERP2, MITF, and MT2A mRNAs (Fig. S2 and Dataset S1) transferred from human melanoma cells (WM983b–GFP) to murine embryonic fibroblasts (NIH 3T3) in coculture (Fig. 2 C_–_E and Dataset S1). The transfer of the ectopically expressed GFP mRNA (Fig. S2 and Dataset S1) could also be detected both in human–murine and human–human cocultures (Fig. S4 C and D and Dataset S1). For these experiments, we employed smFISH probes that tiled the entire length of the transcript for the non–MBS-labeled mRNAs. In some cases [e.g., GFP (Fig. S4_E_) and SERP2, MITF, and MT2A (Fig. S2_B_)], dual-color probe sets (41) were used to ascertain the specific identification of these mRNAs, since two-color colocalization enhances the probability that the signal is specific. These approaches strongly indicate that full-length mRNAs underwent transfer. To test for transfer of a different type of RNA molecule, we also examined by dual-color smFISH whether a highly expressed (e.g., >2,000 copies per cell) human-specific long noncoding RNA (lncRNA), MALAT1 (41), underwent transfer, but we observed the transfer of only one or two molecules in a small percentage (∼8%) of acceptor cells (Fig. S4_F_ and Dataset S1). At this moment we cannot determine whether the lack of appreciable MALAT1 RNA transfer is due to its localization in the nucleus (41) or its specific function and/or regulation.
Fig. 2.
Transfer of mRNAs in human–murine cocultures. (A) Distribution of the number of β-actin–MBS mRNA spots in HEK293T cells that were cocultured with donor MBS MEFs for 24 h. In all panels, each dot represents the score of a single cell using smFISH, and the horizontal bars indicate the mean number of spots per acceptor cell. (B) Distribution of the number of endogenously expressed human BRCA1 mRNA spots in WT MEFs cocultured for 24 h with donor HEK293T or HEK293 cells, as detected using sequence-specific probes against BRCA1. (C_–_E) Distribution of the number of SERP2 (C), MITF (D), and MT2A (E) mRNA spots in NIH 3T3 cells that were cocultured with donor WM983b–GFP human melanoma cells for 48 h, as detected using sequence-specific probes. Only dual-color spots were considered legitimate mRNA spots. (F) Distribution of the number of CCND1–MBS mRNA spots in WT MEFs cocultured for 7 h with donor HEK293 cells expressing CCND1–MBS mRNA from CCND1p or CMVp. Starved WT MEFs were serum-starved overnight before coculture. MBS probes were used for the detection of CCND1–MBS mRNA. The diagram above the plot illustrates the CCND1–MBS gene under the two different promoters in the HEK293 cell lines. (G) Distribution of the number of endogenously expressed human HER2 mRNA spots in MEFs cocultured for 3 h with donor SKBR3 or NCI-N87 cells, using sequence-specific probes. See Dataset S1 for data on the number of cells scored, mean, SEM, and P values.
Fig. S4.
Transfer of mRNA in a human–murine coculture. (A and B) Distribution of the number of β-actin–MBS mRNA spots in U2OS cells (A) or SKBR3 cells (B) that were cocultured with donor MBS MEFs for 24 h. Horizontal bars indicate the mean of transferred β-actin–MBS mRNA spots per acceptor cell. (C) Distribution of the number of GFP mRNA spots in WM983b human melanoma cells that were cocultured with donor WM983b–GFP cells for 48 h. Horizontal bars indicate the mean of transferred GFP mRNA spots per acceptor cell. Only dual-color spots were considered legitimate mRNA spots. (D) Distribution of the number of GFP mRNA spots in NIH 3T3 cells that were cocultured with donor WM983b–GFP cells for 48 h. Horizontal bars indicate the mean of transferred GFP mRNA spots per acceptor cell. Only dual-color spots were considered legitimate mRNA spots. (E) Image of co-FISH with odds/evens probes against GFP. A, WM983b acceptor cells; D, donor WM983b–GFP cells; magenta label, Alexa594 (evens); green label, Cy3 (odds). Zoomed-in (magnification: 4×) photographs of the boxed area in the main panel are shown at the right. (F) Distribution of the number of MALAT1 RNA spots in NIH 3T3 cells that were cocultured with donor WM983b–GFP cells for 48 h. The horizontal bars indicate the mean of transferred MALAT1 RNA spots per acceptor cell.
Gene Expression in Donor Cells May Influence mRNA Transfer.
In contrast to β-actin–MBS mRNA, which undergoes transfer at tens to hundreds of molecules per cell (Figs. 1 C_–_F and 2_A_ and Figs. S1 D and E, S3 B and H, and S4 A and B), only a small amount of the other RNAs tested were transferred (Figs. 1_G_ and 2 B_–_E and Fig. S4 C and D). Furthermore, primary MBS MEFs, which express less β-actin–MBS mRNA than immortalized MBS MEFs (Fig. S1), also exhibited less transfer (Fig. 1_F_ and Fig. S1_E_). Thus, we hypothesized that mRNA-expression levels in donor cells might affect the absolute number of transferred RNAs.
To test whether gene expression affects mRNA transfer, two HEK293 cell lines that express MBS-labeled cyclin D1 (CCND1–MBS) mRNA from either its endogenous promoter (CCND1p) or a CMV promoter (CMVp) were obtained (42). As expected, CMVp induced higher levels of expression of CCND1–MBS mRNA in donor cells compared with CCND1p (Fig. S2 and Dataset S1). We cocultured WT MEFs with either of these cell lines and compared the level of CCND1–MBS mRNA transfer. In agreement with our hypothesis, more RNA transfer was detected when the MEFs were cocultured with HEK293 cells bearing CMVp–CCND1–MBS (Fig. 2_F_ and Dataset S1).
To explore this issue further, we examined the transfer of HER2 mRNA from human cell lines to MEFs. We used two epithelial cell lines having different expression levels of HER2: gastric carcinoma cells (NCI-N87; 316 ± 22 mRNAs per cell) and SKBR3 cells (611 ± 36 mRNAs per cell) (Fig. S2 and Dataset S1). We observed mRNA transfer in both cases, and, despite the elevated expression of HER2 mRNA in SKBR3 cells, we observed the same low level of transfer (e.g., ∼3.5 mRNAs per cell) (Fig. 2_G_ and Dataset S1). Given that HER2 mRNA is highly expressed in the donor cells, similar to β-actin, this result indicates that factors other than gene-expression level may influence transfer.
Stress Conditions Affect mRNA Transfer.
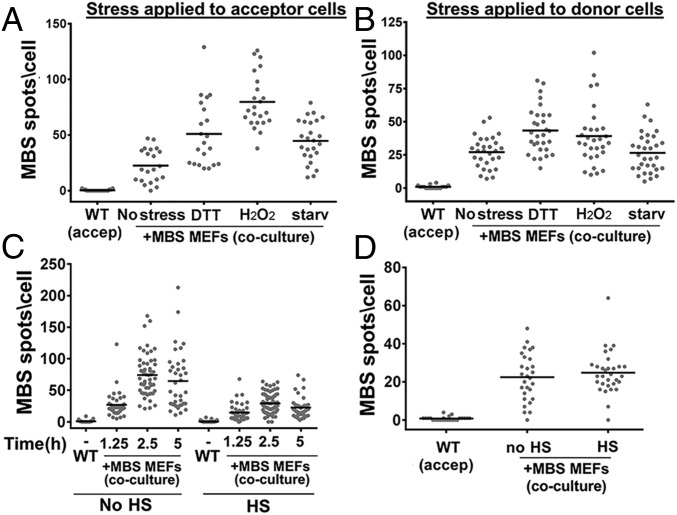
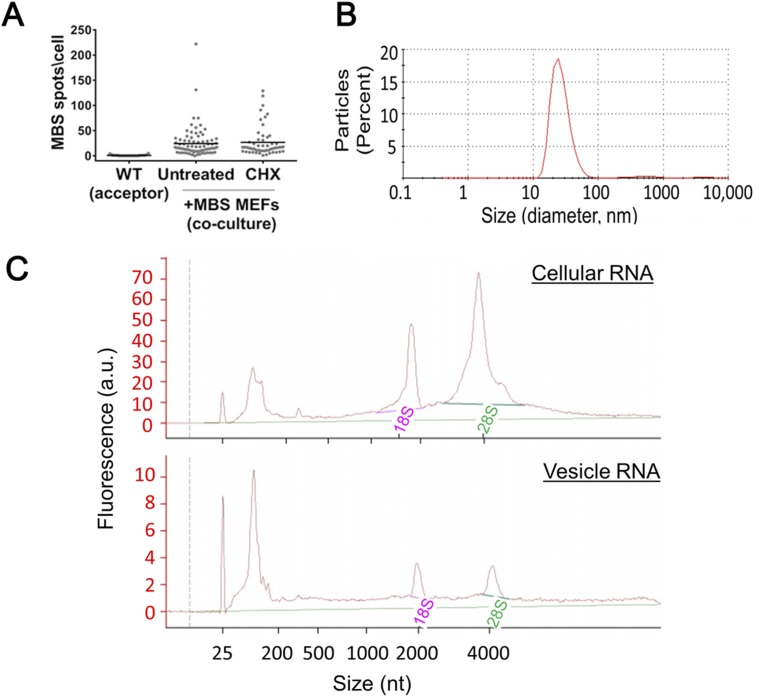
To determine whether intercellular mRNA transfer is affected by external physiological conditions, we examined the effect of stress on mRNA transfer. In these experiments, either donor or acceptor cells were exposed to stress (e.g., heat shock, oxidative stress, protein-folding stress, or serum starvation) before coculture. Cells were relieved from the stress, and the reciprocal cells (i.e., unstressed acceptor or donor cells) were plated on top. Under these conditions, recovery from heat shock inhibited mRNA transfer, whereas recovery from oxidative stress (H2O2 treatment), protein-folding stress (DTT treatment), or serum starvation increased the extent of mRNA transfer (Figs. 2_G_ and 3 and Dataset S1). Interestingly, stress conditions modulated mRNA transfer mostly when applied to the acceptor cells. Thus, different stresses may make cells either less or more receptive to mRNA transfer but have little effect on the capacity of donor cells to transfer mRNA once the stress is relieved. This occurred even though β-actin–MBS mRNA levels increased in the stressed donor cells after they were allowed to recover (Fig. S1). This also implies that mRNA-expression levels alone may not be the only parameter that influences transfer. We next tested whether translational stress inhibits mRNA transfer. We found that β-actin–MBS mRNA transfer was not inhibited by cycloheximide (Fig. S5_A_ and Dataset S1), a translation inhibitor, indicating that this process does not require de novo protein synthesis.
Fig. 3.
Stress affects β-actin–MBS mRNA transfer. (A and B) Acceptor WT MEFs (A) or donor β-actin–MBS MEFs (B) were either left untreated (No stress) or were treated for 1.5 h with 1 mM DTT, 1 mM H2O2, or serum starvation (Starv) before scoring for mRNA transfer by smFISH with MBS probes. (C and D) Acceptor WT MEFs (C) or donor β-actin–MBS MEFs (D) were exposed to heat shock (HS, 42 °C) for 1 h or were left untreated (No HS). Following stress, the reciprocal cell line was plated, and coculture was maintained under stress-free conditions for 2.5 h (A, B, and D) or for the indicated times (C). β-Actin–MBS mRNA transfer was detected by smFISH using MBS probes, as described in Fig. 1. For the heat-shock experiments, we verified the heat-shock response by detecting heat shock-induced expression of HSP70 mRNA by smFISH. In all panels, the horizontal bar indicates the mean number of MBS spots per acceptor cell. See also Dataset S1 for data on the number of cells scored, mean, SEM, and P values.
Fig. S5.
Translation inhibition does not inhibit β-actin–MBS mRNA transfer; isolated exosomes contain primarily small RNAs. (A) Acceptor WT MEFs were first cocultured (0.5 h) with donor MBS MEFs, followed by additional coculture for 2.5 h in the absence (Untreated) or presence of cycloheximide (CHX; 100 µg/mL). FISH analysis of β-actin–MBS mRNA was performed using Cy3-labeled MBS probes. Horizontal bars indicate the mean of transferred MBS mRNA spots per acceptor cell. (B) Exosome size was measured as described in Materials and Methods. (C) RNA isolated from whole-cell lysate (cellular RNA) or exosomes (vesicles RNA) was analyzed using a Bioanalyzer. 18S and 28S indicate peaks of ribosomal RNAs.
mRNA Transfer Requires Direct Cell-to-Cell Contact.
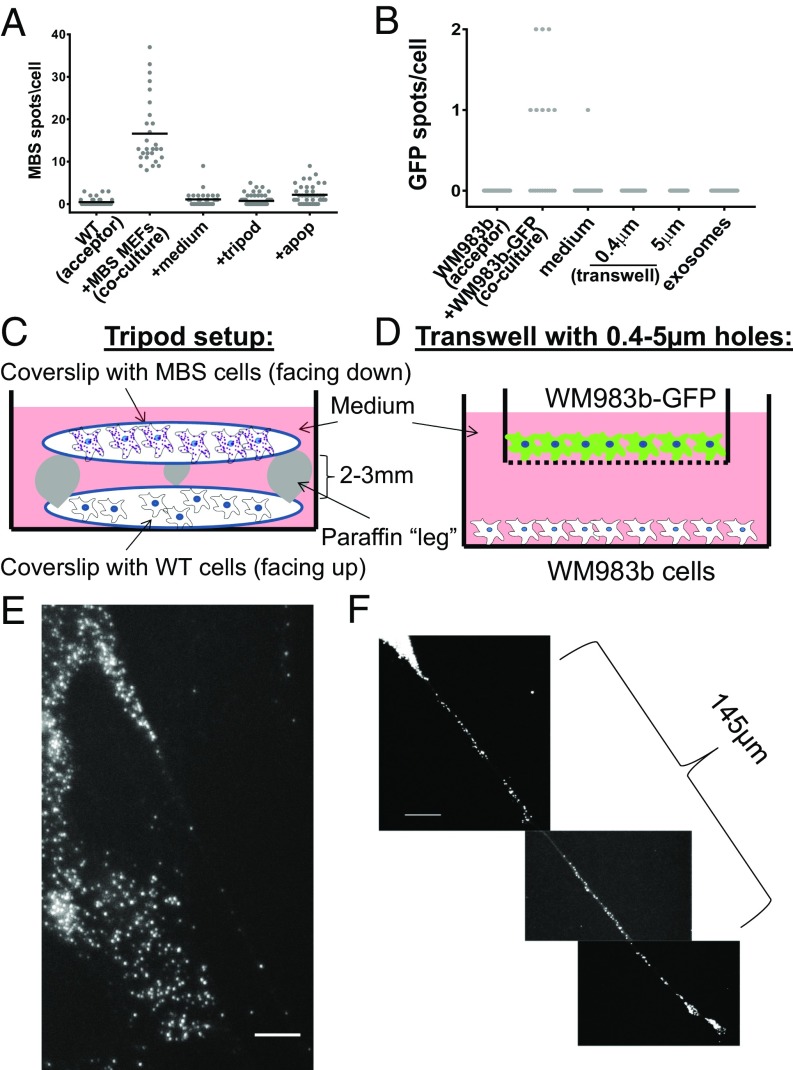
The isolation and characterization of exosomes and other EVs from different cell types has revealed that these vesicles may contain miRNAs and mRNA (or at least mRNA fragments) and therefore could serve as a means of mRNA transfer between cells (4, 12). Thus, we speculated that intercellular mRNA transfer is mediated by EVs that convey their contents by diffusion through the medium and uptake into acceptor cells. To test this hypothesis, we transferred “conditioned” medium from donor-cell cultures (e.g., MBS MEFs or WM983b–GFP cells) to acceptor-cell cultures (e.g., WT MEFs or WM983b cells, respectively) and looked for transferred β-actin–MBS or GFP mRNA in the acceptor cells following 1.5–2.5 or 24 h of incubation. Transferred mRNA molecules were not detected in the acceptor cells (Fig. 4 A and B and Dataset S1), indicating that the mode of transfer is not via the growth medium. Consequently, to determine if mRNA transfer is mediated by physical contact, donor and acceptor cells were cocultured under conditions that prevent contact between cells but allow the sharing of diffusible materials. We used two different approaches. The first approach, which we term “tripod,” is illustrated in Fig. 4_C_. In this system, in which donor- and acceptor-cell layers are physically separated by several millimeters, any type of particle can diffuse across the medium. The second approach, termed “transwell”, utilized a physical barrier to separate the cell layers and exclude the transfer of particles >0.4–5 µm (Fig. 4_D_). In either case, little to no evidence for mRNA transfer was detected, and transfer was observed only under coculture conditions that allowed physical contact (Fig. 4 A and B and Dataset S1). Last, exosomes were directly isolated from WM983b–GFP cells. These exosomes were 40–60 nm in diameter (Fig. S5_B_) and contained primarily small RNAs (<200 nt) (Fig. S5_C_). The isolated exosomes were applied to GFP-negative WM983b cells. After 24 h of incubation with the acceptor cells, no appreciable mRNA transfer was detected (Fig. 4_B_ and Dataset S1). Thus, mRNA transfer appears to require cell–cell contact.
Fig. 4.
Intercellular mRNA transfer requires direct cell-to-cell contact. (A) Distribution of the number of β-actin–MBS mRNA spots in acceptor WT MEFs cocultured with donor β-actin–MBS cells (coculture, as shown in Fig. 1), incubated with medium collected from an overnight culture of MBS MEFs (+medium), as shown in the tripod set-up (+tripod), or as shown in the tripod set-up with dying cells (+apop). Apoptosis was induced in donor MBS cells by pretreatment with 3% H2O2 before coculture in the tripod set-up with WT MEFs. Incubation time was 2 h for each treatment. Horizontal bars indicate the mean number of MBS spots per acceptor cell. (B) Distribution of the number of GFP mRNA spots in acceptor WM983b cells cocultured with donor WM983b–GFP cells (coculture). WM983b cells were incubated with medium collected from an overnight culture of WM983b–GFP cells (medium) in the transwell set-up using either 0.4-μm or 5-μm pores or with exosomes isolated from WM983b–GFP cells. Incubation time was 24 h for each treatment. Detection was performed using GFP-specific probes. (C) A schematic depicting the tripod set-up. Donor and acceptor cells grown separately on glass coverslips were positioned facing each other, but separated by 2–3 mm using paraffin legs. (D) A schematic depicting the transwell set-up. WM983b–GFP cells were cultured in the upper chamber of Transwells of different porosity before being transferred to Transwells containing WM983b cells plated on the bottom chamber. (E) smFISH image of β-actin–MBS mRNA present in a mNT formed by a primary β-actin–MBS MEF. (Scale bar: 5 µm.) (F) smFISH image of β-actin–MBS mRNA along a mNT formed by an immortalized β-actin–MBS MEF. (Scale bar: 10 µm.) See Dataset S1 for data on the number of cells scored, mean, SEM, and P values.
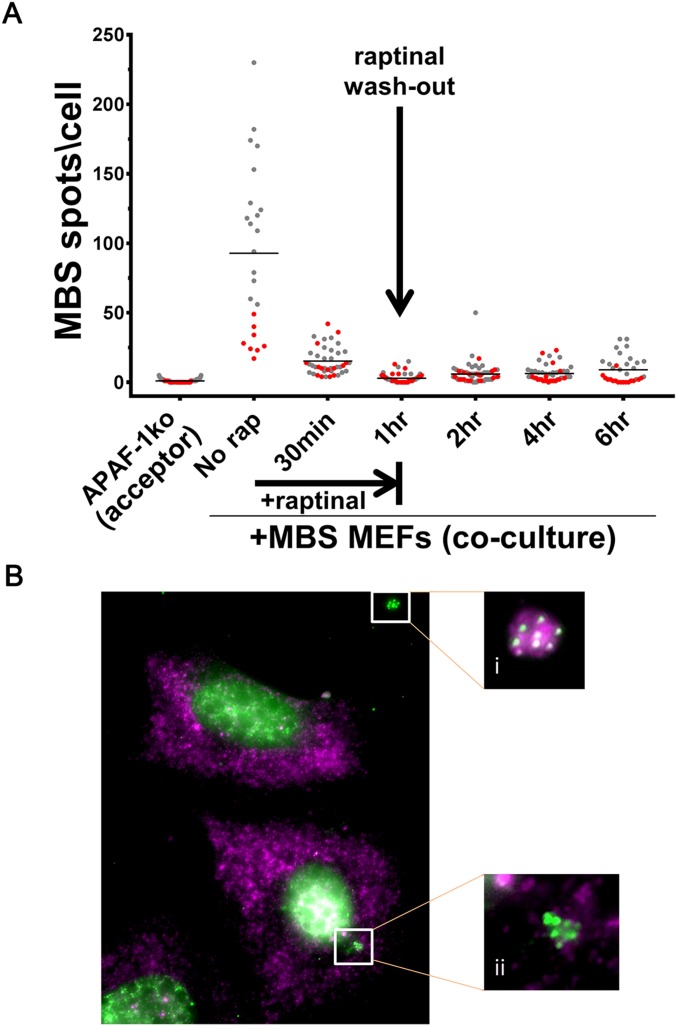
Although the release of mRNAs from dying cells might also allow transfer, we observed little cell death in our MEF coculture experiments (∼3%). Nevertheless, we tested whether cell death contributes to transfer by pretreating donor MBS MEFs with H2O2 (3%, 1.5 h) to induce oxidative stress and apoptosis. This treatment resulted in ∼45% cell death during the subsequent 2.5 h of incubation in cocultures with acceptor MEFs using the tripod approach described above. We observed only a slight increase in transferred β-actin–MBS mRNA levels in acceptor MEFs (Fig. 4_A_ and Dataset S1). This level of transfer is far less than that observed under coculture conditions using healthy cells, indicating that the release of apoptotic bodies cannot account for mRNA transfer under normal growth conditions. In parallel experiments we used an apoptosis-inducing drug, raptinal (43), to selectively kill donor cells during coculture. Raptinal leads to apoptosis within <2 h by inducing cytochrome _c_ release from mitochondria, which in turn activates the apoptotic cascade. Consistent with published results (43), APAF-1–KO (APAF-1−/−) MEFs are resistant to short-term (1-h) treatment with the drug, whereas APAF-1+/+ cells (e.g., MBS MEFs) were highly sensitive and showed >95% cell death within <2 h. We next cocultured MBS MEFs and APAF-1−/− MEFS for 3 or 12 h and then treated the cells with raptinal for 1 h. Transferred mRNA was detected by smFISH after coculture but before treatment (i.e., at time 0) and at different time points during drug treatment (e.g., 30 min, 1 h) or after drug washout (e.g., 2–6 h). Importantly, the amount of transferred β-actin–MBS mRNA was reduced to very low levels upon raptinal treatment (Fig. S6_A_ and Dataset S1). Some MBS MEF cell fragments containing mRNA were detected between cells, suggesting that β-actin–MBS mRNA can be present and remain intact in apoptotic bodies (Fig. S6 B, i). Likewise, we observed clusters of transferred mRNAs in a few acceptor cells (Fig. S6 B, ii), suggesting that apoptotic bodies were engulfed by these cells. Nevertheless, the contribution of apoptotic bodies to mRNA transfer appears to be extremely limited and does not contribute to the mechanism observed in healthy cells (Fig. S6_A_). Thus, mRNA transfer in cocultures is not mediated by apoptotic bodies.
Fig. S6.
Cell death does not contribute significantly to mRNA transfer. (A) APAF-1–KO MEFs were cocultured with donor MBS MEFs. Cells were coplated and cultured together for 12 h (red spots) or MBS MEFs were plated on top of preseeded (overnight) APAF-1–KO MEFs and cocultured for 3 h (gray dots). Following coculture, cells were treated with raptinal for 1 h. smFISH for β-actin–MBS mRNA using Cy3-labeled probes was performed 0.5,1, 2, 4, and 6 h after the addition of raptinal. Horizontal bars indicate the mean of transferred β-actin–MBS mRNA spots per acceptor cell. (B) Image of co-FISH with probes against MBS (Cy3-labeled, green) and β-actin ORF (Cy5-labeled, magenta) in acceptor APAF-1–KO MEFs at 4 h (i.e., 3 h after raptinal washout). White boxes show zoomed-in images (magnification: i, 3×; i i, 4×) of extracellular (i) and intracellular (ii) apoptotic bodies containing MBS spots.
mRNA Transfer Occurs via mNT-Like Structures.
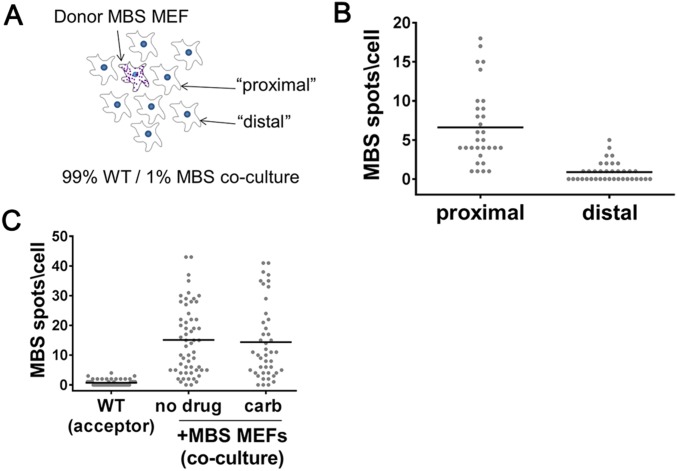
To test if mRNA transfer requires close proximity or direct contact, cells were plated at a 99:1 ratio of WT to MBS MEFs and cocultured for 24 h. smFISH was performed to determine the amount of β-actin MBS mRNA transferred to either the nearest or distant neighbor cells. Nearest neighbors were defined as those directly proximal to the MBS cells (i.e., residing in the adjacent cell layer), while distal cells constituted those in the surrounding second or third layers. We observed that the number of MBS spots was higher in adjacent cells than in cells located further away (Fig. S7 A and B and Dataset S1).
Fig. S7.
mRNA transfer requires proximity between cells but does not occur through gap junctions. (A) Illustration of the 99% WT MEF:1% MBS MEF coculture system. Acceptor cells immediately surrounding the donor MBS MEF (i.e., the first cell layer) are designated as “proximal” cells, and acceptors located beyond the first layer are labeled as “distal” cells. (B) Distribution of the number of β-actin–MBS mRNA spots in 99% WT MEF:1%MBS MEF cocultures. Donor MBS MEFs and acceptor MEFs were plated simultaneously at a 1:99 ratio and were cocultured for 24 h before MBS spots in acceptor cells were scored by smFISH using MBS probes. The number of transferred MBS spots was determined in proximal vs. distal acceptor cells. Horizontal bars indicate the mean number of transferred MBS mRNA spots per proximal or distal acceptor cell. (C) Use of a gap-junction inhibitor does not block mRNA transfer. Acceptor WT MEFs and donor MBS MEFs were cocultured for 2 h in the absence (no drug) or presence of carbenoxolone (carb), followed by smFISH analysis of β-actin–MBS mRNA. Horizontal bars indicate the mean number of transferred MBS mRNA spots per acceptor cell.
Our results indicate that a proximity-based mechanism confers intercellular mRNA transfer. To determine whether mRNAs are transferred directly via known cell–cell contacts (e.g., gap junctions), we treated MBS and WT MEF cocultures with 100 µM carbenoxolone, a gap-junction inhibitor (44), for 60–90 min. However, we found no effect of carbenoxolone upon β-actin–MBS mRNA transfer (Fig. S7_C_ and Dataset S1). By eliminating other possibilities (e.g., diffusion or gap junctions), we suspected that mRNA transfer might occur via mNTs. mNTs are long (up to ∼200 μm), thin (0.05–0.5 μm) cellular protrusions that can transfer many types of components from one cell to another (24, 25, 27–35). Indeed, upon examination of our coculture images, we could detect the presence of mRNAs in mNT-like structures (Fig. 4 E and F and Fig. S8_A_). These images were fairly rare, since the visibility of mNTs (as detected by the background fluorescence of the FISH protocol) was weak. Furthermore, we suspect that many mNTs are destroyed during the FISH process. Indeed, we could detect mNTs more easily by live imaging (see below).
Fig. S8.
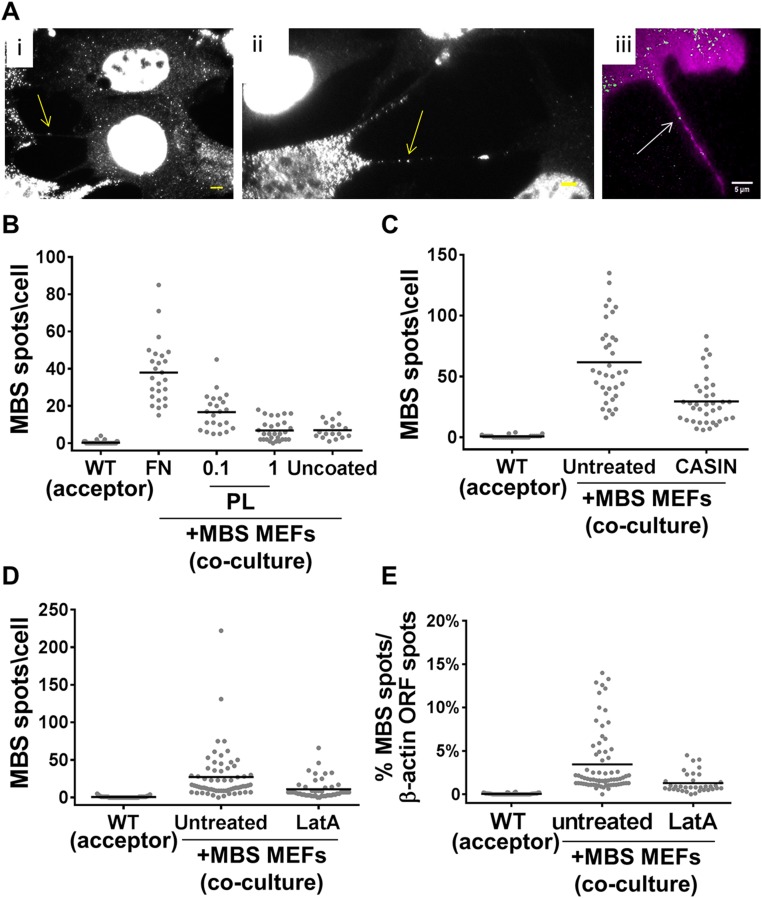
Treatment with mNT inhibitors reduces mRNA transfer. (A) β-Actin–MBS mRNA is present in mNTs. (i) FISH image of a β-actin–MBS mRNA spot present in a mNT formed between two cells. (ii) FISH image of β-actin–MBS mRNAs in a mNT formed by a MBS MEF. (iii) Live image of a β-actin–MBS mRNA in a mNT produced by a MBS MEF. The arrow points to a tdMCP–GFP–labeled mRNA (green). Both cell types were labeled with membrane-targeted TagRFP-T-ps (magenta). TagRFP-T-ps– and tdMCP–GFP–expressing MBS MEFs were plated, cocultured with TagRFP-T-ps–expressing WT MEFs (not shown) for 2–3 h, and then were imaged using a 150× objective, as detailed in Materials and Methods, Live Imaging. Cells were imaged at eight _z_-sections of 0.6 µm each. Exposure time at each wavelength was 100 ms. The 488-nm laser was set at 20% power, and the 561-nm was set at 10% power. (Scale bars: 5 µm.) (B) FN promotes mRNA transfer. WT MEFs were cultured on uncoated glass or on either FN- or PL (0.1 mg/mL or 1 mg/mL)-coated glass before coculture with donor MBS MEFs for 2.5 h and then were analyzed for β-actin–MBS transfer by smFISH with MBS probes. (C) CASIN inhibits the transfer of β-actin–MBS mRNA. Acceptor WT MEFs were first cocultured for 0.5 h with donor MBS MEFs alone, followed by the addition of 1 µM CASIN, and coculture continued for 2.5 h before smFISH analysis using MBS probes. (D) LatA inhibits the transfer of β-actin–MBS mRNA. Acceptor WT MEFs were first cocultured for 0.5 h with donor MBS MEFs alone followed by the addition of LatA (200 nM), and coculture continued for 2.5 h, before smFISH analysis using MBS and β-actin ORF probes. Scoring of β-actin–MBS spots is shown. Horizontal bars in B_–_D indicate the mean of transferred MBS mRNA spots per acceptor cell. (E) Percentage of transferred β-actin–MBS mRNA molecules out of total β-actin mRNA in LatA-treated acceptor cells. Untreated and LatA-treated acceptor WT MEFs from D were scored for the percentage of β-actin–MBS mRNAs (measured using Cy3-labeled MBS probes) out of the total β-actin mRNA pool (measured using Cy5-labeled ORF probes) using smFISH. Horizontal bars indicate the mean percentage of transferred MBS mRNA spots out of total β-actin pool per acceptor cell.
To further substantiate the role of mNTs in mRNA transfer, we employed known mNT inhibitors. It was previously shown that FN-coated glass supports mNT formation better than polylysine (PL)-coated glass (45). Consistent with this finding, we found that cells plated on uncoated or PL-coated glass exhibited much less mRNA transfer than cells plated onto FN-coated glass (Fig. S8_B_ and Dataset S1). An alternative explanation for the reduced transfer on PL-coated glass would be that the mRNA-expression levels in the donor cells were greatly reduced. However, the expression levels of β-actin–MBS mRNA in the donor MBS MEFs were only ∼30% less under these conditions (Fig. S1_C_). Next, we tested the effects of the actin depolymerization drug Latrunculin A (LatA) and the CDC42 inhibitor 2-[(2,3,4,9-Tetrahydro-6-phenyl-1_H_-carbazol-1-yl)amino]ethanol (CASIN), which were previously shown to inhibit mNT formation or the transfer of proteins through mNTs (25, 46). Consistent with the involvement of mNTs, we found that treatment of WT or MBS MEF cocultures with either LatA or CASIN resulted in a twofold reduction in β-actin mRNA transfer (Fig. S8 C and D and Dataset S1). The reduced level of transfer cannot be attributed to decreased mRNA levels in donor cells (Fig. S1_C_), and, furthermore, the percentage of transferred mRNA present in LatA-treated cocultures was greatly reduced (Fig. S8_E_ and Dataset S1). Thus, mRNA transfer through contact-dependent mNTs seems to be the likely mechanism.
Live Imaging of mRNA Transfer.
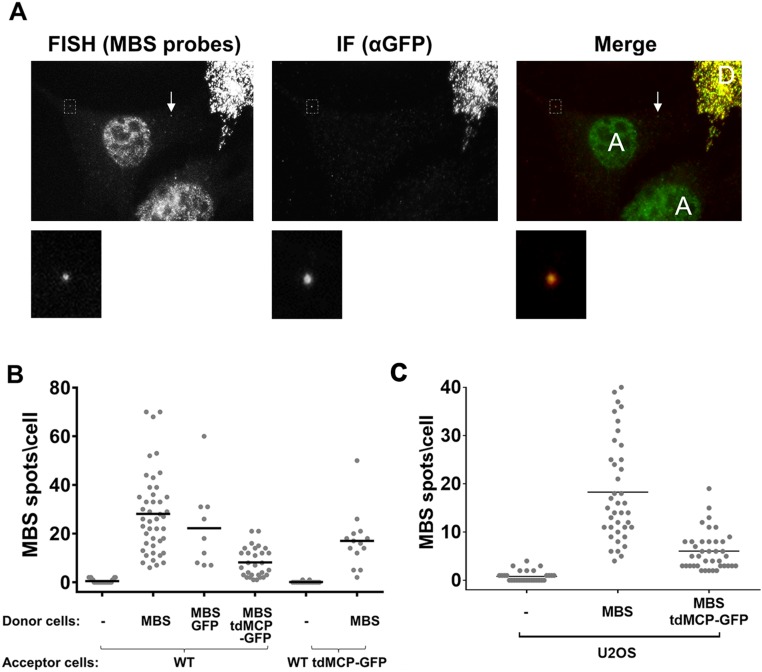
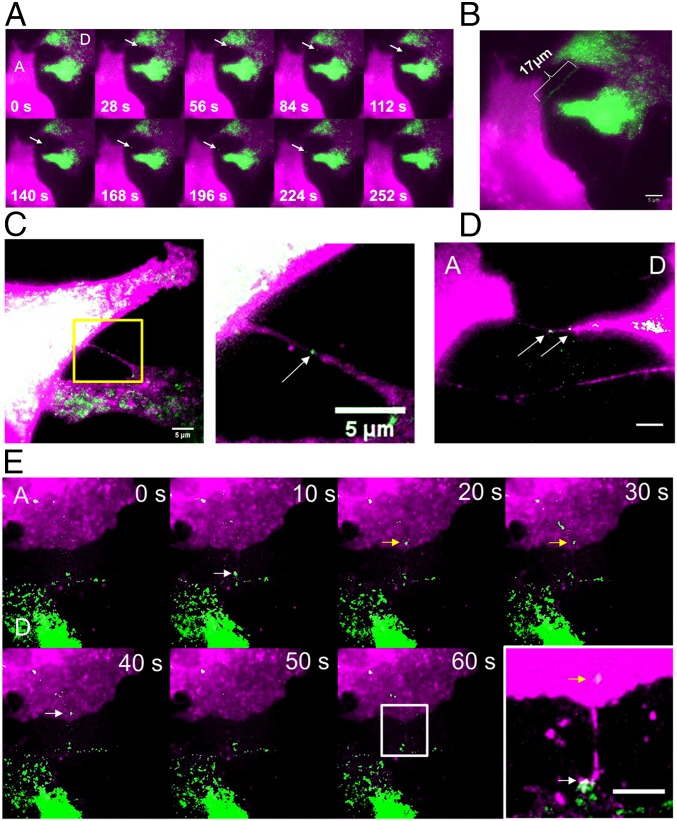
A great advantage of the MS2-labeling system is the ability to follow mRNA movement in real time by live imaging. Although we could detect transferred β-actin–MBS mRNA in acceptor cells after coculture using both smFISH with probes against MBS and immunofluorescence (IF) using anti-GFP antibodies to detect tandem MCP–GFP (tdMCP–GFP) (47), the number of colabeled spots was very low (Fig. S9_A_). Indeed, the expression of tdMCP–GFP in the donor cells greatly reduced the level of transfer in cocultures (Fig. S9 B and C and Dataset S1). In contrast, the expression of either tdMCP–GFP in the acceptor cells or of GFP alone in the donor cells did not lower the level of mRNA transfer. Thus, the binding of tdMCP–GFP to β-actin–MBS mRNA in the donor cells appears to inhibit mNT-mediated delivery of mRNA to acceptor cells. While it was difficult to detect transfer by live-cell imaging, we nevertheless documented one clear event of linear β-actin–MBS mRNA transfer between donor and acceptor cells (Fig. 5 A and B and Movie S1). The rate of β-actin–MBS mRNA movement in Movie S1 was calculated at 4.85 µm/min. This rate is similar to that of other components that transfer via mNTs (48). In addition, we often observed mNTs by live imaging and on rare occasions detected mRNAs moving along the length of mNT-like structures or appearing in acceptor cells using tdMCP–GFP (Fig. 5 C and D and Fig. S8 A, iii and Movies S2–S6).
Fig. S9.
The MS2 coat protein inhibits MBS-labeled mRNA transfer. (A) FISH-IF images of WT and MBS MEFs expressing tdMCP–GFP. Acceptor WT MEFs (A) were cocultured with donor MBS MEFs expressing tdMCP–GFP (D). Cells were cocultured for 2.5 h before FISH-IF using MBS probes to detect β-actin–MBS mRNA (green in merged image) and chicken anti-GFP antibodies to detect tdMCP–GFP (red in merged image). (Upper Row) Images show colocalization of most FISH spots with IF labeling in the donor cell and a single transferred mRNA in the acceptor cell. The arrow indicates a transferred mRNA without tdMCP–GFP labeling. (Lower Row) Images show a zoomed-in (magnification: 7×) view of the boxed FISH- and IF-labeled spot in the upper row. (B and C) β-Actin–MBS mRNA transfer is inhibited by donor cells expressing tdMCP–GFP. (B) Acceptor WT MEFs (WT) or acceptor WT MEFs expressing tdMCP–GFP (WT tdMCP–GFP) were cocultured for 2.5 h with donor MBS MEFs alone (MBS) or with donor MBS MEFs expressing either GFP (MBS–GFP) or tdMCP–GFP (MBS tdMCP–GFP). (C) Acceptor U2OS cells were cocultured for 20 h with donor MBS MEFs alone (MBS) or with donor MBS MEFs expressing tdMCP–GFP (MBS tdMCP–GFP). In B and C, mRNA transfer was scored by smFISH using MBS probes. Horizontal bars indicate the mean number of transferred MBS mRNA spots per acceptor cell.
Fig. 5.
Live imaging of mRNA transfer. (A) Individual time-lapse images from Movie S1 of live imaging of β-actin–MBS mRNA (green) transferring from a donor MBS MEF cell (D) to an acceptor WT MEF cell (A). The membranes of both cells were labeled with TagRFP-T (magenta). The arrow points to a mRNA being transferred. (B) Maximum projection of Movie S1. (Scale bar: 5 µm.) (C) Live image of a β-actin–mRNA in a nanotube connecting donor MBS MEFs. The image was taken from a coculture of WT acceptor MEFs and donor MBS MEFs expressing tdMCP–GFP showing a mNT that connects two MBS cells. Both cells are labeled with membrane targeted-TagRFP-T (magenta); the arrow points to a tdMCP–GFP–labeled mRNA (green). The image is taken from Movie S2. (Scale bars: 5 μm.) (D) Live image of β-actin–MBS mRNAs in a mNT connecting donor and acceptor MEFs. A still image from Movie S4 of cells cultured in A shows a mNT that connects a donor MBS MEF (D) with an acceptor WT MEF (A). Both cell types are labeled with membrane-targeted TagRFP-T (magenta); the arrows point to tdMCP–GFP–labeled mRNAs (green). (Scale bars: 5 μm.) (E) A time-lapse photomontage that may capture β-actin–MBS mRNA transferring from a donor cell to an acceptor. WT acceptor MEFs (A) and donor MBS MEFs expressing tdMCP–GFP (D) from A were cocultured and monitored for mRNA transfer. Images were taken from Movie S5. Arrows point to a tdMCP–GFP–labeled mRNA (green) that appears to transfer between frames (i.e., labeled white in the donor cell and yellow in the acceptor cell). The donor cell is denoted by the green label due to tdMCP–GFP expression but also shows less TagRFP-T label in this case. The image at lower right is a magnified section of a maximum projection of the movie, showing a nanotube-like structure connecting the two cells at the presumed path of the transferring mRNA. Note that in all panels the TagRFP-T (magenta) signal was saturated to enhance the visibility of the nanotube-like structures in the images. (Scale bar: 5 μm.)
SI Materials and Methods
FISH.
Cells cultured on coverslips in 12-well plates were washed three times with PBS supplemented with 5 mM MgCl2 (PBSM) and then were fixed for 10 min with 4% paraformaldehyde in PBSM at room temperature. Cells were washed once in PBSM plus 0.1 M glycine for 10 min and then twice for 10 min in PBSM. In time-course experiments (Figs. 1_C_ and 3_C_ and Fig. S6_A_), samples taken at early time points were maintained at 4 °C until samples had been collected from all time points. Cells were permeabilized with 0.1% Triton X-100 (Surfact-Amps X-100; Thermo Scientific) in PBS for 10 min followed by three 10-min washes in PBSM. Cells were incubated for 30 min with PHB. Coverslips were placed, cells facing down, on a 45-µL cushion of hybridization buffer [2× SSC, 10% dextran sulfate (Sigma), 10% formamide (Sigma), 1 mg/mL Escherichia coli tRNA (Roche), 0.2 mg/mL BSA (Roche), 2 mM vanadyl ribonucleoside complex (VRC; Sigma), and 10 ng of labeled FISH probes per sample] on Parafilm (Bemis) in a humid chamber (e.g., a sealed tissue-culture dish). Samples were incubated in the dark at 37 °C for 3 h or overnight. Following hybridization, coverslips were returned to 12-well plates, cell side facing up, and were incubated twice for 15 min in 1 mL of PHB at 37 °C, rinsed three times with 2× SSC, stained with DAPI (0.5 µg/mL in 2× SSC) for 1 min, and washed for 5 min with 2× SSC. Coverslips were mounted on slides using Prolong Gold mounting medium (Molecular Probes) and were left to dry for at least 2 h before imaging (samples were typically imaged after 12–72 h). Slides were sealed with nail polish (Electron Microscopy Sciences) before imaging and were stored at −20 °C.
Microscopes Used for Imaging.
At Albert Einstein College of Medicine (AECOM) an Olympus BX61 microscope equipped with an X-cite 120 PC lamp (EXFO), Plan Apochromat 100× 1.35 NA oil-immersion objective (Olympus), and a CoolSNAP HQ CCD camera (Photometrics) was used. The 0.2-μm step _z_-stack images were taken with a MS 2000 XYZ automated stage (ASI) using MetaMorph software (Molecular Devices) at 0.0645 µm per pixel. At WIS, three different microscopes were employed: (i) a Delta Vision (DV) system that employed an Olympus IX-71 microscope equipped with a mercury lamp (Olympus), Plan Apochromat 100× 1.35 NA oil-immersion objective (Olympus), and a CoolSNAP HQ CCD camera (Photometrics); 0.2-μm step _z_-stack images were taken with an automated stage (Applied Precision) using DV software at 0.0645 µm per pixel; (ii) a Nikon Ti-E inverted fluorescence microscope equipped with a ×100 oil-immersion objective NA 1.45, a wide-spectrum light source (either Prior Lumen 220Pro or Nikon Intensilight), and a Pixis 1024 CCD camera (Photometrics); 0.2-μm step _z_-stack images were taken with a MS 2000 XYZ automated stage (ASI) using MetaMorph software (Molecular Devices) at 0.130 µm per pixel; and (iii) a Zeiss AxioObserver Z1 DuoLink dual camera imaging system equipped with an Illuminator HXP 120-V light source, Plan Apochromat 100× 1.4 NA oil-immersion objective, and Hamamatsu Flash 4 sCMOS cameras; 0.2-μm step _z_-stack images were taken using a motorized XYZ scanning stage 130 × 100 Piezo, and ZEN2 software at 0.0645 µm per pixel or 0.130 µm per pixel. At the University of Pennsylvania, a Nikon Ti-E inverted fluorescence microscope equipped with a ×100 oil-immersion objective NA 1.4, equipped with Prior Lumen 220Pro and a Pixis 1024BR CCD camera was used. The 0.3-μm step _z_-stack images were taken with a Prior automated stage using MetaMorph software at 0.130 µm per pixel.
Live imaging was performed at AECOM on an Olympus IX-71 TIRF station customized for laser illumination at 488, 561, and 640 nm, equipped with an Olympus 60× 1.45 NA TIRFM or Olympus 150× 1.45 NA TIRFM objectives, an environmental control chamber, and an Andor EMCCD camera. The 0.6-μm step _z_-stack images were taken with a MS 2000 XYZ automated stage (ASI) using MetaMorph software. Imaging was performed in wide-field mode, not in TIRF mode. The duration of imaging, as well as the time interval between frames, number of _z_-sections, exposure times, and laser power were determined empirically for each movie presented (see SI movie legends for details).
Image Analysis Using Fish-Quant, Airlocalize, and Rajlabimagetools.
Acceptor cells were distinguished from donor cells based on the following criteria: (i) Donor cells have significantly more FISH spots (i.e., detected mRNAs) than acceptor cells; (ii) acceptor cells never exhibit transcription sites of the query mRNA; and (iii) physical differences (e.g., cell size, morphology) exist between cell types, i.e., between human cells (e.g., 293, 293T, SKBR3, and N87 cells) and MEFs. In cases of ambiguity, cells were not scored to avoid the inclusion of false positives. In specific experiments, dual labeling with separate probes or markers was performed. First, the β-actin ORF and MBS tag were labeled by separate probes and showed that acceptor WT cells have many more ORF spots than MBS spots (Figs. S2, S6_A_, and S8 C_–_E). Second, probes to the MBS tag and LTag were used in cocultures of immortalized/primary cells (Fig. 1 F and G and Fig. S1_E_). This allowed the easy distinction between immortalized MEFs (expressing high levels of LTag) and primary cells as well as between MBS MEFs and WT MEFs. Third, probes to the MBS tag and HSP70 were used in heat-shock experiments (Fig. 3 C and D). This allowed the easy distinction of cells that underwent a heat-shock response, based on the level of HSP70 mRNA expression. Fourth, experiments in Fig. 1_D_ were performed using WT MEFs expressing GFP. Last, all experiments with WM983b cells were performed using GFP-labeled donors.
Spot characterization in FQ was initially performed on donor cells and later applied to acceptor cells. Briefly, after background subtraction (“filtration”; typical parameters for filtering in FQ were Kernel BGD XY, Z = 6, 5; Kernel SNR XY, Z = 0.5, 1) (Fig. S1_A_ for examples), the FISH spots were fitted to a 3D Gaussian function. The intensity and the width of the 3D Gaussian function were thresholded to exclude nonspecific signals. These values were determined empirically for each experiment or imaging session (i.e., when the same sample was imaged under different microscopes or conditions). These parameters varied between cells, probes, dyes, microscopes, and experiments. Negative controls (i.e., acceptor cells that did not express the tested mRNA) were included in all FISH experiments to facilitate thresholding of FISH analysis parameters. The only case in which a negative control was unavailable was the β-actin ORF. In this case, the threshold was determined so that the number of β-actin ORF spots in MBS MEFs is similar to the number of MBS spots in these same cells.
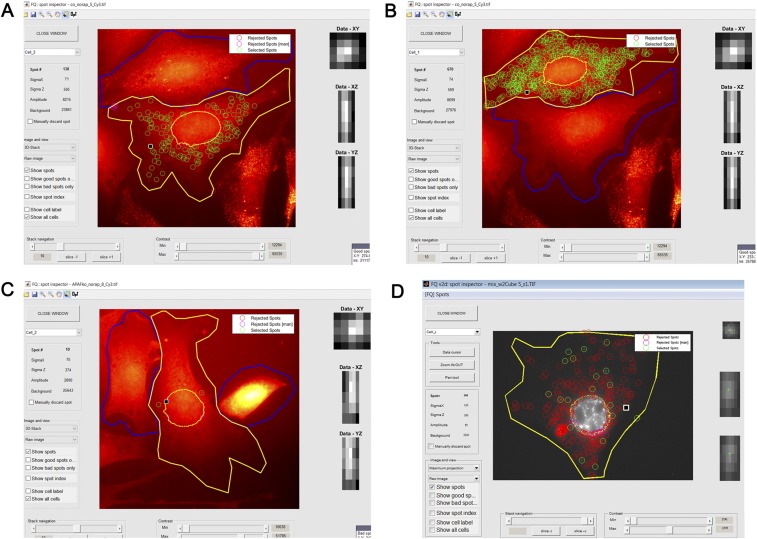
Due to the high background seen with FISH probes in the nuclei of cells (particularly in the nuclei of MEF acceptor cells), nuclei were excluded from the spot analysis in most cases. Since FQ determines the nuclear outline based on the 2D maximum-projection image of the DAPI signal, FISH spots that were in _z_-sections above or below the nucleus were excluded from the analysis. After initial parameter settings and thresholding based on a donor cell, all images belonging to the same experiment were analyzed using the batch analysis tool. Thresholding was optimized after batch analysis, and images were reanalyzed based on the optimized thresholds. Parameters were set to give as close to zero positive spots as possible in negative controls, while still identifying most if not all mRNAs in donor cells. Following automatic batch analysis, each image was examined manually using the Spot Inspector tool to exclude obvious false-positive spots. (See Spot Inspector screenshots shown in Figs. S1_B_ and S10; images used for the screenshots in Fig. S10 are derived from Movies S7–S9). These are shown for the comparison of acceptor WT MEFs alone, acceptor WT MEFs with either a low or high number of transferred mRNAs, and donor MBS MEFs. Examples of false-positive spots include those at the contact sites between donor and acceptor cells (i.e., if cell outlining was inaccurate), spots surrounding the nucleus (as the nuclear outline was not always perfectly drawn), and spots at obvious regions of high autofluorescence. For these reasons, our analysis is generally an underestimation of the actual number of transferred mRNAs. In particular, highly abundant mRNAs (e.g., β-actin and HER2) are underestimated in donor cells due to areas of crowding that do not allow single-molecule resolution under our imaging conditions.
Fig. S10.
Screen-shots of FQ image analysis. Depicted are screen-shots of the FQ spot inspector FQ version 3 (A_–_C) and FQ version 2d (D). A_–_C are from the same experiment and depict a single z section image; D depicts a maximum-projection image. Analyzed cells are outlined in yellow: shown are acceptor cells after coculture bearing either a high number of transferred mRNAs (A) or a low number of transferred mRNAs (D), acceptor cells cultured alone (C), and donor MBS MEFs in coculture (B). Green circles represent selected spots; red circles represent automatically rejected spots based on FQ analysis parameters; magenta circles represent manually rejected spots (as explained in Materials and Methods). Also shown are the data for parameters SigmaXY, SigmaZ, Amplitude, and Background of a single selected accepted (A, B, and D) or rejected (C) spot (note: selected spots are marked by a black square in the image). The data are shown on the left of the image, and a visual representation of the selected spots on the x,y, x,z, or y,z axes is shown to the right of the image. The individual images are derived from Movies S7–S9.
Spot analysis using Airlocalize was performed as previously described (22). Briefly, high-intensity pixels were detected by 3D bandpass filtering of the image. A threshold was applied so that negative control samples (i.e., WT MEFs alone) showed near-zero detected spots, with a minimal loss of observable spots in donor MBS MEFs.
Spot analysis using rajlabimagetools software package (available at https://bitbucket.org/arjunrajlaboratory/rajlabimagetools/wiki/Home) was performed as previously described (39). Spot detection consisted of first applying a threshold across both of the channels with which the RNA was labeled. Then colocalization analysis was performed to find spots that colocalized across both channels, providing an extra layer of specificity. Finally, every colocalized RNA spot corresponding to a putative RNA transfer event was examined manually and annotated to exclude any artifacts.
Exosome Purification.
To isolate exosomes from WM983b–GFP cells, medium was collected from two cultures in T75 flasks (70–90% confluence, 48-h culture), and exosome isolation was performed, as previously described (71). Briefly, cells were cultured in medium supplemented with exosome-free serum (i.e., serum depletion of exosomes was first generated by ultracentrifugation of the serum overnight at 120,000 × g at 4 °C followed by decanting of the liquid phase). Medium was collected after 48 h of cell culture and centrifuged at 300 × g for 10 min at 4 °C to remove cells and debris. The supernatant was centrifuged at 16,500 × g for 20 min at 4 °C, and the resulting supernatant was filtered through a 0.2-µm membrane filter (Steriflip; EMD Millipore) and then ultracentrifuged at 120,000 × g for 70 min at 4 °C to pellet the exosomes. The exosome pellet was resuspended in 250 µL of PBS. Alternatively, exosomes were isolated using Total Exosome Isolation Reagent (Thermo Fisher, catalog no. 4478359). The particle size of isolated exosomes was measured using a Zetasizer instrument (Malvern). RNA extracted from whole cells and isolated exosomes (miRNeasy; Qiagen) was analyzed using a Bioanalyzer 2100 system (Agilent). Exosomes were applied directly onto WM983b cells cultured on a two-well glass-bottomed plate (Lab-Tek, catalog no. 155379). Cells were incubated with the exosomes for 24 h before FISH.
Mycoplasma Infections.
DAPI staining in FISH experiments was used to routinely check for mycoplasma infections. Infection was detected only once in the U2OS cell line, and the cells were treated for 3 wk with 25 µg/mL Plasmocin (InvivoGen) until curing was observed.
Discussion
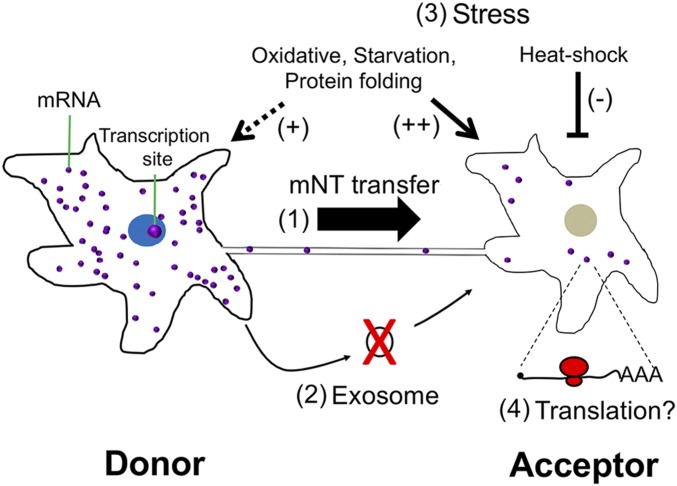
Current research suggests that cells secrete RNA molecules into extracellular fluids, which are then taken up by downstream acceptor cells to alter gene expression and, ultimately, cell physiology. Although the evidence for miRNA transfer via EVs or RNP particles is compelling, the evidence for EV-mediated transfer of mRNA is lacking both in qualitative and quantitative terms. Here, we took an unbiased approach to ask whether intact mRNA molecules are transferred between cells. We provide visual evidence and quantitative data showing that mRNA molecules undergo intercellular transfer and that this transfer occurs via mNTs between adjacent cells and not by diffusion (see the model in Fig. 6). This work presents the results of independent studies performed and validated by different research teams.
Fig. 6.
A schematic representation of intercellular mRNA transfer. (1) A donor cell (Left) that expresses a given mRNA can transfer mRNA molecules to an acceptor cell (Right) through a mNT. (2) This process appears to be actin-myosin regulated, requires direct physical contact, and does not occur via exosomes. (3) Stress conditions appear to affect mRNA transfer, whereby oxidative, protein-folding, and nutrient stresses on both donor and acceptor cells favor transfer, whereas heat shock of acceptor cells inhibits transfer. (4) Transferred mRNAs are likely to undergo translation, although this has not yet been proven.
Do All mRNAs Transfer?
The data presented in this study show that essentially all mRNAs tested can undergo transfer between mammalian cells (Figs. 1 and 2 and Fig. S4). This list includes native endogenously expressed mRNAs (e.g., β-actin–MBS, MITF, SERP2, MT2A, BRCA1, and HER2), ectopically expressed mRNAs (e.g., GFP, LTag, CCND1–MBS), as well as MS2 aptamer-tagged mRNAs. These different mRNAs share no known sequence commonalities, nor do their encoded proteins localize and/or function on the same cellular processes or pathways. Moreover, the list includes both nonmammalian (GFP) and viral (LTag) proteins. Overall, the results suggest that perhaps all mRNAs are amenable to transfer. Thus, far, the only exception we have identified is MALAT1, a lncRNA that resides primarily in the nucleus. However, it is unclear whether the lack of MALAT1 transfer is due to its localization or because it is a noncoding RNA. Since use of smFISH has limited our analysis to only a small number of genes, nonbiased genome-wide transfer experiments that necessitate high-throughput approaches, such as RNA-seq or MERFISH (49), are needed to allow the detection of large numbers of individual transcripts. This will allow us to define and quantitate the extent of the RNA transferome via the large-scale identification of transferrable versus nontransferable mRNAs and lncRNAs. Such an approach may help identify cis elements or epi-transcriptomic changes that recruit proteins involved in RNA transfer. This may allow us to predict which RBPs associate with transferred mRNAs and thereby facilitate the transfer process. Importantly, our FISH-IF experiment indicates that the tdMCP–GFP protein is not removed from β-actin–MBS mRNA upon transfer (Fig. S9). Thus, cellular proteins involved in transfer might remain bound to the transferred mRNA in acceptor cells, and pulldown of these mRNAs could reveal the identity of these RBPs. Another aspect of selectivity is how, out of the total pool for any given mRNA species, specific mRNA molecules are chosen for transfer. Furthermore, our results suggest that translation does not play a role, since translation inhibition did not affect β-actin–MBS mRNA transfer (Fig. S6).
Is mRNA Transfer Solely Expression Dependent?
Two single-cell approaches are used to quantify the number of mRNA transcripts in cells: single-cell RNA sequencing (scRNA-seq) and smFISH. The detection level of scRNA-seq depends upon the methods of single-cell isolation, RNA extraction, and depth of sequencing but may suffer from amplification biases and transcript underestimation compared with spike-in controls (50). Thus, scRNA-seq may not be sensitive enough for accurate detection of <10 mRNA molecules per cell (50). In contrast, mRNA visualization by smFISH allows unbiased measurements at single-molecule resolution while maintaining the integrity of cell structure and conferring spatial resolution of the detected mRNA molecules. By using smFISH as our method of choice, we detected low numbers of transferred mRNA molecules in acceptor cells, the average for many being <10 molecules per cell. In contrast, β-actin–MBS mRNA was exceptional in that hundreds of mRNA molecules per cell could undergo transfer in coculture experiments.
What makes β-actin–MBS mRNA so effective at transfer? One possible explanation is that high levels of β-actin–MBS mRNA expression in donor cells increase the likelihood for transfer. The idea that mRNA transfer correlates with gene expression is further supported by the finding that elevation of CCND1–MBS mRNA, using the CMVp, increased the number of transferred molecules (Fig. 2_F_). However, high gene-expression levels alone may not guarantee higher levels of transfer. For example, we observed similar levels of HER2 mRNA transfer from two different donor lines that had very different levels of expression (Fig. 2_G_ and Fig. S2). Likewise, the expression of MITF, MT2A, and SERP mRNAs were differentially expressed in the same donor cells but had an equally low level of transfer (Fig. 2 C_–_E and Fig. S2). We do note, however, that the low levels of transfer in these experiments might have been caused by plating the cells on uncoated glass, which reduces the efficiency of mRNA transfer compared with plating cells on FN-coated glass. This reduces the efficiency of mRNA transfer in comparison with cells plated on FN-coated glass (Fig. S8_B_). That said, the transfer of CCND1–MBS, LTag, BRCA1, and HER2 mRNAs was also relatively low in comparison with β-actin–MBS mRNA, and these cells were plated on FN-coated glass. Therefore, gene expression may be only one factor that determines mRNA transfer.
Aside from gene expression, other factors influence the propensity of a given mRNA to be transferred. These include cell-culture conditions (Fig. S8_B_), acceptor cell stress (Fig. 3), cell-type specificity (e.g., N87 cells vs. SKBR3) (Fig. 2_G_ and Fig. S2), sequence elements or epi-transcriptomic modifications, and RBPs specific to the mRNA in question. Other factors may also be considered; for example, promoter elements are known to affect the cytoplasmic fate of mRNAs (51). Hence, it is possible that elements at the CMVp are responsible for the elevated rate of CCND1–MBS mRNA transfer, rather than its elevated expression per se (Fig. 2_F_ and Fig. S2). Organellar localization of an mRNA (e.g., nuclear retention) could also affect availability. Furthermore, it is possible that mRNAs involved in mNT formation (e.g., β-actin) or those spatially distributed near mNTs might show a greater propensity for transfer. These issues will have to be resolved in future studies.
MCP–GFP Inhibits mRNA Transfer.
The MS2 system has been widely used to image mRNAs within many organisms and cell types (52) and has not been shown to have deleterious effects upon mRNA movement. Furthermore, a mouse model that expresses both β-actin–MBS and MCP–GFP in all cells did not show physiological, developmental, or behavioral defects (53). However, we found that the expression of tdMCP–GFP in donor MBS MEFs inhibited the transfer of β-actin–MBS mRNA (Fig. S9 B and C). The reduction in RNA transfer cannot be explained by a reduced expression level of β-actin–MBS mRNA, since tdMCP–GFP did not affect steady-state levels (Fig. S1_C_). Time-lapse imaging of hundreds of live cells for varying durations and at various intervals between frames led to only a single clear example of mRNA transfer (Fig. 5 A and B and Movie S1) and only a few examples of mRNAs residing in mNTs (Fig. 5 C and D and Fig. S8 A, iii and Movies S2, S4, and S6). This might explain why transfer was not detected earlier in other studies employing MS2-labeled mRNAs for single-molecule imaging.
While the cause of tdMCP–GFP–mediated inhibition of β-actin–MBS mRNA transfer is not known, we presume that the larger size/mass of the mRNP particle impedes interactions with the transport machinery and/or recruitment into mNTs. Formation of this complex may invariably slow the anterograde movement of mRNA through mNTs in comparison with retrograde transport, leading to a net movement back to the donor cells (Movie S6). Another possibility is that tdMCP–GFP binding to the mRNA results in structural changes in the RNA that interfere with the binding of factors essential for transfer.
Clearly, inhibition of β-actin mRNA transfer between cells is not deleterious at the organismal level, since β-actin–MBS × MCP–GFP crosses are fully viable (53). This is probably because β-actin is ubiquitously expressed in all cell types and therefore is not expected to be limiting. We predict, however, that the inhibition of transfer of other mRNA species might yield more obvious and deleterious effects at both the cellular and organismal levels. The loss of transfer of cell type-specific mRNAs may alter the physiology of downstream acceptor cells, although this will have to be determined on a case-by-case basis.
What Is the Mechanism of mRNA Transfer?
Our work demonstrates that mRNA transfer between cells likely occurs via mNT-based contacts and not via diffusion-based mechanisms. However, the mechanisms that regulate mNT formation and maintenance are not well understood. Likewise, even less is known about how mRNAs are recruited to mNTs and undergo trafficking therein.
mNTs are thought to be actin filament-based, but microtubules may also be present and possibly exist as the sole cytoskeletal structure (54). In our study, the inhibition of actin polymerization was found to reduce β-actin–MBS mRNA transfer in cocultured cells (Fig. S8_D_), which implies at least a partial role for actin. The CDC42 small GTPase, which regulates actin filament formation, has also been implicated in mNT formation (25, 55), perhaps in the elongation rather than the initiation phase (56). Nevertheless, the inhibition of CDC42 reduced mRNA transfer (Fig. S8_C_), strengthening our hypothesis that mRNAs transfer via actin-based mNTs.
Other proteins have been shown to modulate mNT formation. For example, TNFaip2/M-Sec utilizes the RalA GTPase and exocyst complex to initiate mNT formation (55, 56) and is recruited along with filamin and myosin to the plasma membrane by the MHC class III protein LST1 (46) to initiate mNT formation. Although it is yet unclear which cytoskeletal motors are responsible for mNT-mediated mRNA transfer, the velocity of the RNP particle shown in Movie S1 strongly resembles that of myosin motors (57, 58). In particular, Myosin Va is involved in RNA trafficking (59) and is probably a good candidate to explore, given that earlier work suggested a role for this motor in the distribution of Schwann cell-synthesized RNA to neuronal cell bodies and axons after lesioning (60). Future experiments employing the knockdown/knockout of specific myosin motors should elucidate which motor confers mNT-mediated mRNA transfer. Although most evidence suggests that mNTs are open-ended and facilitate free cytoplasmic transfer (24–26), an alternative model in which the acceptor cell phagocytoses the tip of the mNT was put forth (30). In that case, the transferred mRNA is expected to initially reside in endosomes after entering the acceptor cells. While we have no clear answer which model is correct, it should be noted that both the open-ended and tip-phagocytosis models require direct cell-to-cell contact by mNTs.
Finally, the question arises of whether mRNAs are transferred in free RNP particles or in particles bound to cellular membranes. Organelles such as intact mitochondria, as well as lysosomes, endosomes, Golgi vesicles, and endoplasmic reticulum (ER), have been shown to transfer via mNTs (24, 31, 61, 62). Likewise, mRNAs are known to associate with and undergo intracellular cotrafficking with organelles (e.g., ER, mitochondria, and peroxisomes) (63–66). Thus, we speculate that organelle-localized mRNAs may undergo transfer along with the organelle. Live imaging of mNT-mediated mRNA transfer using cells expressing labeled organelles should help resolve this issue.
Why Do mRNAs Transfer Between Cells?
The biological importance of mRNA transfer between cells is still unknown. Clearly, mRNAs or their fragments are found in EVs and are presumably taken up by the surrounding cell layers in tissues. Our discovery of mNT-mediated mRNA transfer suggests that full-length mRNAs can also be exchanged between cells through contact. Although we cannot rule out the possibility that this phenomenon occurs only under in vitro culture conditions, it would seem unlikely given the existence of mNTs in tissues and their known ability to transfer intracellular material. Thus, we assume that the process of intercellular mRNA transfer is active (i.e., is cytoskeleton- and motor-dependent), is responsive to environmental cues (e.g., stress), and affects downstream cellular responses.
mNTs have been characterized primarily in cell and tissue cultures. However, they were also detected in patient-derived solid tumors (67). This suggests a role for mNTs in cancer biology and the tumor microenvironment. The finding that primary MEFs can be mRNA donors as well as acceptors (Fig. 1 F and G and Fig. S2_B_) indicates that mRNA transfer is not a consequence of immortalization or tumorigenesis per se. Therefore, this process is expected to occur in embryonic and/or normal adult tissues and may affect development, maintenance, or both. Future studies employing human xenografts in rodents may help resolve this question.
Given that mNT-mediated mRNA transfer occurs in animals, the main biological question is impact the transfer of a few mRNA molecules has upon downstream acceptor cells. The answer depends on the mRNA in question and hinges on whether the transferred mRNA is translated and at what efficiency. For instance, cancer cells that transfer a few mRNA molecules encoding a key transcription factor not normally expressed in untransformed neighbor cells might induce or repress the transcription of genes that regulate responses to extracellular signals elicited from the cancerous cells and thereby facilitate cancer cell motility or the supportive nature of tumor local microenvironment. It is reasonable to speculate that mRNAs with transforming potential (i.e., oncogenes) could induce carcinogenesis in neighboring cells upon transfer. Likewise, the transfer of mRNAs involved in cell differentiation during embryonic development might act as means to induce or repress neighboring cells. Determining the scope of this process and deciphering the mechanism and physiological outcome of mRNA transfer will be the goal of future studies.
Materials and Methods
Cells and Cell Lines.
Primary MEFs from WT (C57BL/6) or β-actin–MBS mice were isolated from E14.5 embryos and cultured as is or were immortalized by transfection with SV40 LTag, as previously described (23). Immortalized ZBP1-KO (ZBP1−/−)–MBS MEFs were described earlier (38). HEK293T, U2OS, NIH 3T3, and SKBR3 cells were purchased from ATCC. The following cell lines were received as gifts: SKBR3 from M. Oren, Weizmann Institute of Science (hereafter, “WIS”), Rehovot, Israel; U2OS from Z. Livneh, WIS; N87 from Y. Yarden, WIS; WM983b from M. Herlyn, The Wistar Institute, Philadelphia; HEK293 cells expressing PCCND1–CCND1–MBS or PCMV–CCND1–MBS (42) from Y. Shav-Tal, Bar Ilan University, Ramat Gan, Israel; and SV40-immortalized APAF-1–KO MEFs and isogenic WT MEFs (68) from M. Orzáez, Centro de Investigación Príncipe Felipe (CIPF), Valencia, Spain.
MEFs expressing EGFP, NLS–HA–tdMCP–GFP (referred to herein as “tdMCP–GFP”) or palmitoylated TagRFP-T (TagRFP-T-ps) were created by infection with the appropriate lentivirus followed by sorting by flow cytometry to isolate only infected cells. Cells were sorted for low expression levels of EGFP and tdMCP–GFP and for high expression levels of TagRFP-T-ps. WM983b–GFP cells were created by clonal selection, as previously described (69).
Plasmids and Lentivirus Generation.
A lentivirus vector (pHAGE-UBC-RIG) carrying tdMCP–GFP (Addgene plasmid no. 40649) was previously described (47). DNA sequences encoding EGFP and TagRFP-T-ps were cloned into the same viral backbone vector. Plasma membrane (inner leaflet)-associated TagRFP-T-ps was generated by the addition of a sequence encoding 20 amino acids of rat GAP-43 (MLCCMRRTKQVEKNDEDQKI) (70) to the 5′ end of the TagRFP-T gene.
Lentivirus particles were produced by transfecting the expression vector along with plasmids for ENV (pMD2.VSVG), packaging (pMDLg/pRRE), and REV (pRSV-Rev) (Addgene plasmids nos.12259, 12251, and 12253, respectively) into HEK293T cells using calcium phosphate (71). The virus-containing supernatant was harvested and concentrated using a Lenti-X concentrator (Clontech) per the manufacturer’s instructions. Virus particles were resuspended in DMEM containing 10% FBS, aliquoted, and stored at −80 °C for subsequent infection of cells in culture.
Cell-Culture Conditions.
MEFs, HEK293, HEK293T, and U2OS cells were cultured routinely in 10-cm dishes in DMEM (4.5 g/L glucose) supplemented with 10% FBS, 1 mM sodium pyruvate, and antibiotics (0.1 mg/mL streptomycin and 10 U/mL penicillin) at 37 °C with 5% CO2. Primary MEFs were cultured in the same medium at 37 °C with 10% CO2 and 3% O2. SKBR3 and N87 cells were cultured in RPMI 1640 medium supplemented with 10% FBS, 1 mM sodium pyruvate, and antibiotics. RPMI 1640 medium was also used for the coculture of either SKBR3 or N87 cells with MEFs that were preconditioned to RPMI 1640. WM983b cells were cultured in Tu 2% medium (78.4% MCDB153 medium, 19.6% Leibovitz’s l-15 medium, 2% FBS, and 1.68 mM CaCl2).
FN (10 µg/mL in PBS; Sigma) was used to coat round 18-mm no. 1 glass coverslips for FISH experiments and the glass-bottomed dishes (MatTek catalog no. P35G-1.5–14-C) for live imaging. For some experiments, poly-d-lysine (Sigma) was used to coat coverslips at 1 mg/mL or 0.1 mg/mL, as indicated. Cells were dissociated from the dishes using 0.25% trypsin-EDTA and were plated on freshly coated coverslips. We found that the coculturing of donor and acceptor cells immediately after dissociation tends to reduce the transfer efficiency of β-actin–MBS mRNA. Therefore, acceptor cells were typically plated the day before coculture (i.e., in the afternoon/evening), and donor cells then were plated on top the next morning, unless otherwise indicated. The acceptor:donor ratio was 1:1 unless otherwise indicated. Coculture was performed for 30 min to 24 h, as indicated, before fixation and FISH analysis as detailed below. For live imaging, cells were cultured on fibronectin-coated glass-bottomed dishes, as described above, using DMEM/10%FBS medium. The coculture was maintained for 1–2 h in the incubator. During that time, the microscope’s environmental control chamber was warmed to 37 °C with humidity control and normal atmosphere. The medium was then replaced with prewarmed Leibovitz’s l-15 medium lacking phenol red and containing 10% FBS, and the cells were taken for imaging. Imaging sessions of live cells lasted between 1 and 10 h. Experiments using WM983b cells were performed using uncoated glass, and cocultures (plated at a ratio of 1:1) were incubated for 48 h before FISH analysis. In all cases, cell density upon plating in coculture was calculated to achieve ∼80 ± 10% confluence at the time of fixation or live imaging.
For tripod experiments, paraffin was heated to ∼110 °C. By using a glass pipette, paraffin drops (2–3 mm in height) were placed in a triangular arrangement at three points on the coverslip edges. Once the paraffin solidified, coverslips were exposed to UV light (using the tissue-culture hood lamp) for 30 min. Tripods were stored under sterile conditions at room temperature until used. For transwell experiments, Corning Transwell multiple-well plates with permeable polycarbonate 0.4-µm or 5-µm membrane inserts (Fisher Scientific catalog no. 07–200-147 or 07-200-149) were used.
The following drugs were added directly to the culture medium: 100 µg/mL cycloheximide (CHX) (Sigma), 1 µM CASIN (a gift of V. Krizhanovsky, WIS), 200 nM LatA (Santa Cruz Biotechnology), 100 µM carbenoxolone (Sigma), and 10 µM raptinal (gift of P. Hergenrother, University of Illinois Urbana–Champaign, Urbana–Champaign, IL). Drugs were added 20–30 min after plating of the donor cells (i.e., after MBS MEFs have attached). For the induction of protein folding or oxidative stress, 0.1 mM DTT (Sigma) or 1 mM H2O2 was added directly to the medium, and cells were further incubated for 1.5 h. Serum starvation was induced by replacing the medium with DMEM lacking FBS, and the cells were further incubated for the indicated times. Heat shock was induced by submerging cells that were precultured on coverslips in a sealed 12-well plate for 1 h in a 42-°C water bath. Following incubation under stress conditions, the stressed cells were washed with prewarmed medium; then the other (nonstressed) cell type was added, and the cells were cocultured for the indicated times under stress-free conditions. For the apoptosis-tripod experiment, cells grown on tripod coverslips were first treated with 3 mM H2O2 for 1.5 h before coculture. After an additional 2.5 h of culture in medium lacking H2O2, ∼45% of MBS MEFs were dead. The percentage of cell death was determined using trypan blue staining.
FISH and FISH-IF.
Tiled FISH probes (20-mers) against the MBS sequence (comprising three oligos with amino-allyl moieties on both the 5′ and 3′ ends) and the β-actin ORF (comprising 35 5′ and 3′ amino-allyl oligos) (23) were end-labeled with Cy3 or Cy5 (GE Healthcare), as previously described (72). Tiled FISH probes (20-mers) against human BRCA1-Quasar (Q)570 (ShipReady catalog no. SMF-2028-1), human HER2-Q570 (DesignReady catalog no. VSMF-2102-5), and custom probe sets against HSP70 (73) and LTag-Q670 mRNAs were obtained from Biosearch Technologies. Tiled odds/evens dual-color 20-mer probes against GFP and human MITF, SERP2, MT2A, and MALAT1 were purchased as 3′-amine oligos from Biosearch Technologies. These oligos were coupled to Cy3 or Alexa Fluor 594 (Life Technologies) fluorophores and purified by HPLC, as previously described (41).
FISH was performed at the R.H.S./J.E.G. laboratories as previously described (22), with slight modifications (a detailed protocol is given in SI Materials and Methods). FISH at the A.R. laboratory was performed on WM983b cells according to the Biosearch Stellaris RNA FISH protocol.
For FISH-IF experiments, cell fixation and permeabilization were performed as described for FISH. Prehybridization was performed in prehybridization buffer (PHB) (10% formamide in 2× SSC) supplemented with 3% BSA (Sigma) and RNase inhibitor [10 U/mL SUPERase (Ambion) or RNasin (Promega)]. For hybridization, 20 U/mL SUPERase or RNasin and primary chicken (IgY) anti-GFP antibody (GFP-1010) (1:5,000) (Aves Labs), as well as the FISH probes, were added to the hybridization mix. Samples were incubated in a humid chamber in the dark at 37 °C for exactly 3 h. Following hybridization, coverslips were rinsed twice in PHB and then incubated twice for 30 min at 37 °C in PHB supplemented with 3% BSA and secondary goat anti-chicken IgY antibody conjugated with Alexa Fluor 647 (A21449) (1:1,000) (Life Technologies ). Samples were further washed, DAPI stained, and mounted on slides as for FISH.
Imaging.
FISH and FISH-IF images were taken using different microscopes, as detailed in SI Materials and Methods. Exposure times for imaging varied among different cell cultures, probes, dyes, and microscopes and were determined empirically per experiment. All slides from the same experiment were imaged using the same illumination parameters. Examples of _z_-stacked FISH images of donor, acceptor, and cocultured cells are provided in Movies S7–S9). Live imaging was performed on an Olympus IX-71 total internal reflection fluorescence (TIRF) station customized for laser illumination as detailed in SI Materials and Methods.
Image Analysis and Data Presentation.
Microscope images presented in the figures and movies were minimally processed for brightness and contrast using the FIJI program (74). The plots depicted in Fig. S3_E_ were generated in FIJI by using the “straight line” tool to measure pixel intensity. Analysis of smFISH images to quantify FISH spots was performed using either in-house–developed MATLAB programs or FQ (36). Airlocalize (23) was used at the R.H.S. laboratory for the experiments depicted in Figs. 1 D and E and 4_A_ and Fig. S7_B_. All experiments involving WM983b cells were analyzed at the A.R. laboratory with Rajlabimagetools (75). FQ was used in the analysis of all other experiments. For more details, see SI Materials and Methods. Examples of images that were analyzed by FQ are provided in Figs. S1 A and B and S10. The data presented in all graphs and in Dataset S1 represent data collected from two or more experiments. In a few cases that showed distinct subpopulations (i.e., Figs. S3 A and B and S6_A_) the different experiments were color-coded. The immortalized data in Fig. S1_C_ were pooled from all experiments with MBS MEFs.
Statistical Analysis.
Unpaired t tests were used to calculate P values (depicted in Dataset S1) for each two sets of compared results. All calculations of average, SEM, and P values were performed using GraphPad Prism software (GraphPad Software, Inc.).
Supplementary Material
Supplementary File
Supplementary File
Supplementary File
Supplementary File
Supplementary File
Supplementary File
Supplementary File
Supplementary File
Supplementary File
Supplementary File
Supplementary File
Supplementary File
Supplementary File
Supplementary File
Acknowledgments
We thank Xiuhua Meng and Bin Wu for plasmids; Yaron Shav-Tal, Moshe Oren, Yosef Yarden, Meenhard Herlyn, and Maria Orzáez for cell lines; Paul Hergenrother for raptinal; Valery Krizhanovsky for CASIN; Shalev Itzkovitz for use of his microscopes; and Florian Mueller for excellent technical support for FISH-quant. G.H. is a recipient of a Gruss Lipper Family Post-Doctoral Fellowship from the EGL Charitable Foundation, Dean of Faculty (Weizmann Institute of Science) and Sir Charles Clore Post-Doctoral Fellowships, and Koshland Foundation and McDonald-Leapman Grant Senior Post-Doctoral Fellowships. This research was funded by grants from the Joel and Mady Dukler Fund for Cancer Research (Weizmann Institute of Science) (to J.E.G.); US-Israel Binational Science Foundation-National Science Foundation Grant 2015846 (to J.E.G. and R.H.S.); NIH New Innovator Grant 1DP2OD008514 (to A.R.); and NIH Grant NS083085 (to R.H.S.).
Footnotes
The authors declare no conflict of interest.
References
- 1.Kolodny GM. Evidence for transfer of macromolecular RNA between mammalian cells in culture. Exp Cell Res. 1971;65:313–324. doi: 10.1016/0014-4827(71)90007-3. [DOI] [PubMed] [Google Scholar]
- 2.Kolodny GM. Cell to cell transfer of RNA into transformed cells. J Cell Physiol. 1972;79:147–150. doi: 10.1002/jcp.1040790117. [DOI] [PubMed] [Google Scholar]
- 3.Kolodny GM, Culp LA, Rosenthal LJ. Secretion of RNA by normal and transformed cells. Exp Cell Res. 1972;73:65–72. doi: 10.1016/0014-4827(72)90102-4. [DOI] [PubMed] [Google Scholar]
- 4.Valadi H, et al. Exosome-mediated transfer of mRNAs and microRNAs is a novel mechanism of genetic exchange between cells. Nat Cell Biol. 2007;9:654–659. doi: 10.1038/ncb1596. [DOI] [PubMed] [Google Scholar]
- 5.Arroyo JD, et al. Argonaute2 complexes carry a population of circulating microRNAs independent of vesicles in human plasma. Proc Natl Acad Sci USA. 2011;108:5003–5008. doi: 10.1073/pnas.1019055108. [DOI] [PMC free article] [PubMed] [Google Scholar]
- 6.Eldh M, et al. Exosomes communicate protective messages during oxidative stress; possible role of exosomal shuttle RNA. PLoS One. 2010;5:e15353. doi: 10.1371/journal.pone.0015353. [DOI] [PMC free article] [PubMed] [Google Scholar]
- 7.Xiao D, et al. Identifying mRNA, microRNA and protein profiles of melanoma exosomes. PLoS One. 2012;7:e46874. doi: 10.1371/journal.pone.0046874. [DOI] [PMC free article] [PubMed] [Google Scholar]
- 8.Eirin A, et al. MicroRNA and mRNA cargo of extracellular vesicles from porcine adipose tissue-derived mesenchymal stem cells. Gene. 2014;551:55–64. doi: 10.1016/j.gene.2014.08.041. [DOI] [PMC free article] [PubMed] [Google Scholar]
- 9.Jiang H, Li Z, Li X, Xia J. Intercellular transfer of messenger RNAs in multiorgan tumorigenesis by tumor cell-derived exosomes. Mol Med Rep. 2015;11:4657–4663. doi: 10.3892/mmr.2015.3312. [DOI] [PubMed] [Google Scholar]
- 10.Lee C, et al. Exosomes mediate the cytoprotective action of mesenchymal stromal cells on hypoxia-induced pulmonary hypertension. Circulation. 2012;126:2601–2611. doi: 10.1161/CIRCULATIONAHA.112.114173. [DOI] [PMC free article] [PubMed] [Google Scholar]
- 11.Lopez-Verrilli MA, Picou F, Court FA. Schwann cell-derived exosomes enhance axonal regeneration in the peripheral nervous system. Glia. 2013;61:1795–1806. doi: 10.1002/glia.22558. [DOI] [PubMed] [Google Scholar]
- 12.Tomasoni S, et al. Transfer of growth factor receptor mRNA via exosomes unravels the regenerative effect of mesenchymal stem cells. Stem Cells Dev. 2013;22:772–780. doi: 10.1089/scd.2012.0266. [DOI] [PMC free article] [PubMed] [Google Scholar]
- 13.Kanada M, et al. Differential fates of biomolecules delivered to target cells via extracellular vesicles. Proc Natl Acad Sci USA. 2015;112:E1433–E1442. doi: 10.1073/pnas.1418401112. [DOI] [PMC free article] [PubMed] [Google Scholar]
- 14.Tian T, et al. Dynamics of exosome internalization and trafficking. J Cell Physiol. 2013;228:1487–1495. doi: 10.1002/jcp.24304. [DOI] [PubMed] [Google Scholar]
- 15.Heusermann W, et al. Exosomes surf on filopodia to enter cells at endocytic hot spots, traffic within endosomes, and are targeted to the ER. J Cell Biol. 2016;213:173–184. doi: 10.1083/jcb.201506084. [DOI] [PMC free article] [PubMed] [Google Scholar]
- 16.Batagov AO, Kurochkin IV. Exosomes secreted by human cells transport largely mRNA fragments that are enriched in the 3′-untranslated regions. Biol Direct. 2013;8:12. doi: 10.1186/1745-6150-8-12. [DOI] [PMC free article] [PubMed] [Google Scholar]
- 17.Hung ME, Leonard JN. A platform for actively loading cargo RNA to elucidate limiting steps in EV-mediated delivery. J Extracell Vesicles. 2016;5:31027. doi: 10.3402/jev.v5.31027. [DOI] [PMC free article] [PubMed] [Google Scholar]
- 18.Shurtleff MJ, et al. A broad role for YBX1 in defining the small non-coding RNA composition of exosomes. bioRxiv. 2017 doi: 10.1101/160556. [DOI] [PMC free article] [PubMed] [Google Scholar]
- 19.Chevillet JR, et al. Quantitative and stoichiometric analysis of the microRNA content of exosomes. Proc Natl Acad Sci USA. 2014;111:14888–14893. doi: 10.1073/pnas.1408301111. [DOI] [PMC free article] [PubMed] [Google Scholar]
- 20.Stevanato L, Thanabalasundaram L, Vysokov N, Sinden JD. Investigation of content, stoichiometry and transfer of miRNA from human neural stem cell line derived exosomes. PLoS One. 2016;11:e0146353. doi: 10.1371/journal.pone.0146353. [DOI] [PMC free article] [PubMed] [Google Scholar]
- 21.Raj A, van den Bogaard P, Rifkin SA, van Oudenaarden A, Tyagi S. Imaging individual mRNA molecules using multiple singly labeled probes. Nat Methods. 2008;5:877–879. doi: 10.1038/nmeth.1253. [DOI] [PMC free article] [PubMed] [Google Scholar]
- 22.Femino AM, Fay FS, Fogarty K, Singer RH. Visualization of single RNA transcripts in situ. Science. 1998;280:585–590. doi: 10.1126/science.280.5363.585. [DOI] [PubMed] [Google Scholar]
- 23.Lionnet T, et al. A transgenic mouse for in vivo detection of endogenous labeled mRNA. Nat Methods. 2011;8:165–170. doi: 10.1038/nmeth.1551. [DOI] [PMC free article] [PubMed] [Google Scholar]
- 24.Rustom A, Saffrich R, Markovic I, Walther P, Gerdes HH. Nanotubular highways for intercellular organelle transport. Science. 2004;303:1007–1010. doi: 10.1126/science.1093133. [DOI] [PubMed] [Google Scholar]
- 25.Biran A, et al. Senescent cells communicate via intercellular protein transfer. Genes Dev. 2015;29:791–802. doi: 10.1101/gad.259341.115. [DOI] [PMC free article] [PubMed] [Google Scholar]
- 26.Wang ZG, et al. Myosin-driven intercellular transportation of wheat germ agglutinin mediated by membrane nanotubes between human lung cancer cells. ACS Nano. 2012;6:10033–10041. doi: 10.1021/nn303729r. [DOI] [PubMed] [Google Scholar]
- 27.Abounit S, Zurzolo C. Wiring through tunneling nanotubes–From electrical signals to organelle transfer. J Cell Sci. 2012;125:1089–1098. doi: 10.1242/jcs.083279. [DOI] [PubMed] [Google Scholar]
- 28.Roberts KL, Manicassamy B, Lamb RA. Influenza A virus uses intercellular connections to spread to neighboring cells. J Virol. 2015;89:1537–1549. doi: 10.1128/JVI.03306-14. [DOI] [PMC free article] [PubMed] [Google Scholar]
- 29.Thayanithy V, Dickson EL, Steer C, Subramanian S, Lou E. Tumor-stromal cross talk: Direct cell-to-cell transfer of oncogenic microRNAs via tunneling nanotubes. Transl Res. 2014;164:359–365. doi: 10.1016/j.trsl.2014.05.011. [DOI] [PMC free article] [PubMed] [Google Scholar]
- 30.Wang X, Gerdes HH. Long-distance electrical coupling via tunneling nanotubes. Biochim Biophys Acta. 2012;1818:2082–2086. doi: 10.1016/j.bbamem.2011.09.002. [DOI] [PubMed] [Google Scholar]
- 31.Wang X, Gerdes HH. Transfer of mitochondria via tunneling nanotubes rescues apoptotic PC12 cells. Cell Death Differ. 2015;22:1181–1191. doi: 10.1038/cdd.2014.211. [DOI] [PMC free article] [PubMed] [Google Scholar]
- 32.Wang X, Veruki ML, Bukoreshtliev NV, Hartveit E, Gerdes HH. Animal cells connected by nanotubes can be electrically coupled through interposed gap-junction channels. Proc Natl Acad Sci USA. 2010;107:17194–17199. doi: 10.1073/pnas.1006785107. [DOI] [PMC free article] [PubMed] [Google Scholar]
- 33.Wang X, et al. Rescue of brain function using tunneling nanotubes between neural stem cells and brain microvascular endothelial cells. Mol Neurobiol. 2016;53:2480–2488. doi: 10.1007/s12035-015-9225-z. [DOI] [PubMed] [Google Scholar]
- 34.Wang Y, Cui J, Sun X, Zhang Y. Tunneling-nanotube development in astrocytes depends on p53 activation. Cell Death Differ. 2011;18:732–742. doi: 10.1038/cdd.2010.147. [DOI] [PMC free article] [PubMed] [Google Scholar]
- 35.Zhu S, Victoria GS, Marzo L, Ghosh R, Zurzolo C. Prion aggregates transfer through tunneling nanotubes in endocytic vesicles. Prion. 2015;9:125–135. doi: 10.1080/19336896.2015.1025189. [DOI] [PMC free article] [PubMed] [Google Scholar]
- 36.Mueller F, et al. FISH-quant: Automatic counting of transcripts in 3D FISH images. Nat Methods. 2013;10:277–278. doi: 10.1038/nmeth.2406. [DOI] [PubMed] [Google Scholar]
- 37.Hüttelmaier S, et al. Spatial regulation of beta-actin translation by Src-dependent phosphorylation of ZBP1. Nature. 2005;438:512–515. doi: 10.1038/nature04115. [DOI] [PubMed] [Google Scholar]
- 38.Katz ZB, et al. β-Actin mRNA compartmentalization enhances focal adhesion stability and directs cell migration. Genes Dev. 2012;26:1885–1890. doi: 10.1101/gad.190413.112. [DOI] [PMC free article] [PubMed] [Google Scholar]
- 39.Buxbaum AR, Wu B, Singer RH. Single β-actin mRNA detection in neurons reveals a mechanism for regulating its translatability. Science. 2014;343:419–422. doi: 10.1126/science.1242939. [DOI] [PMC free article] [PubMed] [Google Scholar]
- 40.Yoon YJ, et al. Glutamate-induced RNA localization and translation in neurons. Proc Natl Acad Sci USA. 2016;113:E6877–E6886. doi: 10.1073/pnas.1614267113. [DOI] [PMC free article] [PubMed] [Google Scholar]
- 41.Cabili MN, et al. Localization and abundance analysis of human lncRNAs at single-cell and single-molecule resolution. Genome Biol. 2015;16:20. doi: 10.1186/s13059-015-0586-4. [DOI] [PMC free article] [PubMed] [Google Scholar]
- 42.Yunger S, Rosenfeld L, Garini Y, Shav-Tal Y. Single-allele analysis of transcription kinetics in living mammalian cells. Nat Methods. 2010;7:631–633. doi: 10.1038/nmeth.1482. [DOI] [PubMed] [Google Scholar]
- 43.Palchaudhuri R, et al. A small molecule that induces intrinsic pathway apoptosis with unparalleled speed. Cell Rep. 2015;13:2027–2036. doi: 10.1016/j.celrep.2015.10.042. [DOI] [PMC free article] [PubMed] [Google Scholar]
- 44.Tang EH, Vanhoutte PM. Gap junction inhibitors reduce endothelium-dependent contractions in the aorta of spontaneously hypertensive rats. J Pharmacol Exp Ther. 2008;327:148–153. doi: 10.1124/jpet.108.140046. [DOI] [PubMed] [Google Scholar]
- 45.Sowinski S, Alakoskela JM, Jolly C, Davis DM. Optimized methods for imaging membrane nanotubes between T cells and trafficking of HIV-1. Methods. 2011;53:27–33. doi: 10.1016/j.ymeth.2010.04.002. [DOI] [PubMed] [Google Scholar]
- 46.Schiller C, et al. LST1 promotes the assembly of a molecular machinery responsible for tunneling nanotube formation. J Cell Sci. 2013;126:767–777. doi: 10.1242/jcs.114033. [DOI] [PubMed] [Google Scholar]
- 47.Wu B, Chao JA, Singer RH. Fluorescence fluctuation spectroscopy enables quantitative imaging of single mRNAs in living cells. Biophys J. 2012;102:2936–2944. doi: 10.1016/j.bpj.2012.05.017. [DOI] [PMC free article] [PubMed] [Google Scholar]
- 48.Davis DM, Sowinski S. Membrane nanotubes: Dynamic long-distance connections between animal cells. Nat Rev Mol Cell Biol. 2008;9:431–436. doi: 10.1038/nrm2399. [DOI] [PubMed] [Google Scholar]
- 49.Moffitt JR, et al. High-throughput single-cell gene-expression profiling with multiplexed error-robust fluorescence in situ hybridization. Proc Natl Acad Sci USA. 2016;113:11046–11051. doi: 10.1073/pnas.1612826113. [DOI] [PMC free article] [PubMed] [Google Scholar]
- 50.Svensson V, et al. Power analysis of single-cell RNA-sequencing experiments. Nat Methods. 2017;14:381–387. doi: 10.1038/nmeth.4220. [DOI] [PMC free article] [PubMed] [Google Scholar]
- 51.Haimovich G, Choder M, Singer RH, Trcek T. The fate of the messenger is pre-determined: A new model for regulation of gene expression. Biochim Biophys Acta. 2013;1829:643–653. doi: 10.1016/j.bbagrm.2013.01.004. [DOI] [PMC free article] [PubMed] [Google Scholar]
- 52.Buxbaum AR, Haimovich G, Singer RH. In the right place at the right time: Visualizing and understanding mRNA localization. Nat Rev Mol Cell Biol. 2015;16:95–109. doi: 10.1038/nrm3918. [DOI] [PMC free article] [PubMed] [Google Scholar]
- 53.Park HY, et al. Visualization of dynamics of single endogenous mRNA labeled in live mouse. Science. 2014;343:422–424. doi: 10.1126/science.1239200. [DOI] [PMC free article] [PubMed] [Google Scholar]
- 54.Austefjord MW, Gerdes HH, Wang X. Tunneling nanotubes: Diversity in morphology and structure. Commun Integr Biol. 2014;7:e27934. doi: 10.4161/cib.27934. [DOI] [PMC free article] [PubMed] [Google Scholar]
- 55.Hase K, et al. M-Sec promotes membrane nanotube formation by interacting with Ral and the exocyst complex. Nat Cell Biol. 2009;11:1427–1432. doi: 10.1038/ncb1990. [DOI] [PubMed] [Google Scholar]
- 56.Ohno H, Hase K, Kimura S. M-Sec: Emerging secrets of tunneling nanotube formation. Commun Integr Biol. 2010;3:231–233. doi: 10.4161/cib.3.3.11242. [DOI] [PMC free article] [PubMed] [Google Scholar]
- 57.Ropars V, et al. The myosin X motor is optimized for movement on actin bundles. Nat Commun. 2016;7:12456. doi: 10.1038/ncomms12456. [DOI] [PMC free article] [PubMed] [Google Scholar]
- 58.Milo R, Phillips R. Cell Biology by the Numbers. Garland Science, Taylor & Francis Group LLC; New York: 2016. [Google Scholar]
- 59.McCaffrey MW, Lindsay AJ. Roles for myosin Va in RNA transport and turnover. Biochem Soc Trans. 2012;40:1416–1420. doi: 10.1042/BST20120172. [DOI] [PubMed] [Google Scholar]
- 60.Sotelo JR, et al. Myosin-Va-dependent cell-to-cell transfer of RNA from Schwann cells to axons. PLoS One. 2013;8:e61905. doi: 10.1371/journal.pone.0061905. [DOI] [PMC free article] [PubMed] [Google Scholar]
- 61.Pasquier J, et al. Preferential transfer of mitochondria from endothelial to cancer cells through tunneling nanotubes modulates chemoresistance. J Transl Med. 2013;11:94. doi: 10.1186/1479-5876-11-94. [DOI] [PMC free article] [PubMed] [Google Scholar]
- 62.Rogers RS, Bhattacharya J. When cells become organelle donors. Physiology (Bethesda) 2013;28:414–422. doi: 10.1152/physiol.00032.2013. [DOI] [PubMed] [Google Scholar]
- 63.Haimovich G, Cohen-Zontag O, Gerst JE. A role for mRNA trafficking and localized translation in peroxisome biogenesis and function? Biochim Biophys Acta. 2016;1863:911–921. doi: 10.1016/j.bbamcr.2015.09.007. [DOI] [PubMed] [Google Scholar]
- 64.Kraut-Cohen J, Gerst JE. Addressing mRNAs to the ER: Cis sequences act up! Trends Biochem Sci. 2010;35:459–469. doi: 10.1016/j.tibs.2010.02.006. [DOI] [PubMed] [Google Scholar]
- 65.Lesnik C, Golani-Armon A, Arava Y. Localized translation near the mitochondrial outer membrane: An update. RNA Biol. 2015;12:801–809. doi: 10.1080/15476286.2015.1058686. [DOI] [PMC free article] [PubMed] [Google Scholar]
- 66.Weis BL, Schleiff E, Zerges W. Protein targeting to subcellular organelles via MRNA localization. Biochim Biophys Acta. 2013;1833:260–273. doi: 10.1016/j.bbamcr.2012.04.004. [DOI] [PubMed] [Google Scholar]
- 67.Lou E, et al. Tunneling nanotubes provide a unique conduit for intercellular transfer of cellular contents in human malignant pleural mesothelioma. PLoS One. 2012;7:e33093. doi: 10.1371/journal.pone.0033093. [DOI] [PMC free article] [PubMed] [Google Scholar]
- 68.Sancho M, et al. Altered mitochondria morphology and cell metabolism in Apaf1-deficient cells. PLoS One. 2014;9:e84666. doi: 10.1371/journal.pone.0084666. [DOI] [PMC free article] [PubMed] [Google Scholar]
- 69.Padovan-Merhar O, et al. Single mammalian cells compensate for differences in cellular volume and DNA copy number through independent global transcriptional mechanisms. Mol Cell. 2015;58:339–352. doi: 10.1016/j.molcel.2015.03.005. [DOI] [PMC free article] [PubMed] [Google Scholar]
- 70.Sanders TA, Llagostera E, Barna M. Specialized filopodia direct long-range transport of SHH during vertebrate tissue patterning. Nature. 2013;497:628–632. doi: 10.1038/nature12157. [DOI] [PMC free article] [PubMed] [Google Scholar]
- 71.Follenzi A, Naldini L. Generation of HIV-1 derived lentiviral vectors. Methods Enzymol. 2002;346:454–465. doi: 10.1016/s0076-6879(02)46071-5. [DOI] [PubMed] [Google Scholar]
- 72.Zenklusen D, Singer RH. Analyzing mRNA expression using single mRNA resolution fluorescent in situ hybridization. Methods Enzymol. 2010;470:641–659. doi: 10.1016/S0076-6879(10)70026-4. [DOI] [PMC free article] [PubMed] [Google Scholar]
- 73.Vera M, et al. The translation elongation factor eEF1A1 couples transcription to translation during heat shock response. Elife. 2014;3:e03164. doi: 10.7554/eLife.03164. [DOI] [PMC free article] [PubMed] [Google Scholar]
- 74.Schindelin J, et al. Fiji: An open-source platform for biological-image analysis. Nat Methods. 2012;9:676–682. doi: 10.1038/nmeth.2019. [DOI] [PMC free article] [PubMed] [Google Scholar]
- Rajlabimagetools. Available at https://bitbucket.org/arjunrajlaboratory/rajlabimagetools/wiki/Home. Accessed October 1, 2015.
Associated Data
This section collects any data citations, data availability statements, or supplementary materials included in this article.
Supplementary Materials
Supplementary File
Supplementary File
Supplementary File
Supplementary File
Supplementary File
Supplementary File
Supplementary File
Supplementary File
Supplementary File
Supplementary File
Supplementary File
Supplementary File
Supplementary File
Supplementary File
