Chromosomal instability drives metastasis through a cytosolic DNA response (original) (raw)
. Author manuscript; available in PMC: 2018 Jul 17.
Published in final edited form as: Nature. 2018 Jan 17;553(7689):467–472. doi: 10.1038/nature25432
Abstract
Chromosomal instability (CIN) is a hallmark of cancer and it results from ongoing errors in chromosome segregation during mitosis. While CIN is a major driver of tumor evolution, its role in metastasis has not been established. Here we show that CIN promotes metastasis by sustaining a tumor-cell autonomous response to cytosolic DNA. Errors in chromosome segregation create a preponderance of micronuclei whose rupture spills genomic DNA into the cytosol. This leads to the activation of the cGAS-STING cytosolic DNA-sensing pathway and downstream noncanonical NF-κB signaling. Genetic suppression of CIN significantly delays metastasis even in highly aneuploid tumor models, whereas inducing continuous chromosome segregation errors promotes cellular invasion and metastasis in a STING-dependent manner. By subverting lethal epithelial responses to cytosolic DNA, chromosomally unstable tumor cells co-opt chronic activation of innate immune pathways to spread to distant organs.
Chromosomal instability (CIN) correlates with tumor metastasis1,2, yet it remains unclear whether it is a mere bystander or a driver of metastatic progression. Chromosomally unstable cells exhibit evidence of chromosome missegregation during anaphase3,4, offering an attractive bottleneck to target CIN and probe its selective contribution in metastasis. Destabilization of microtubule attachments to chromosomes at the kinetochores, through overexpression of the non-motile microtubule depolymerizing kinesin-13 proteins, Kif2b or MCAK/Kif2c, directly suppresses CIN in otherwise chromosomally unstable cells5–7. Cells overexpressing Kif2b or MCAK continue to propagate abnormal aneuploid karyotypes albeit in a stable manner7. As such, this approach permits direct experimental interrogation of CIN, as defined by the rate of ongoing chromosome missegregation, independently of aneuploidy, which is defined as a state of abnormal chromosome numbers.
Increased CIN in human metastases
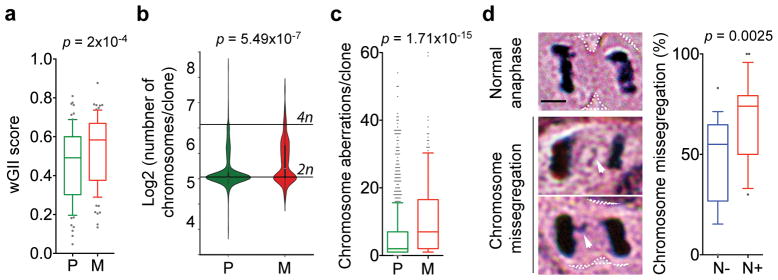
First, to determine whether CIN is associated with human metastases, we applied the weighted-genomic integrity index (wGII) as a proxy for CIN8 on 79 primary tumor-brain metastases matched pairs from a recently published cohort9. Metastases exhibited increased wGII compared to primary tumors (Fig. 1a, Extended Data Fig. 1a–b).
Figure 1. Human metastases enrich for CIN.
a, wGII of matched primary tumors (P) and brain metastases (M), n = 79 patients. b–c, Karyotype probability density (b) and chromosomal aberrations (c) in 983 primary tumor and 186 metastatic breast cancer clones. d, Images of a head and neck squamous cell carcinoma cells undergoing anaphase. Arrows point to chromosome missegregation, scale bar 5-μm. Right, Chromosome missegregation in tumors from patients with (N+, n = 22 patients) or without (N-, n = 18 patients) clinically detectable lymph node metastases. Boxes represent median ± interquartile range, confidence intervals denote 10th–90th percentile (a, c–d), significance tested using two-sided Wilcoxon matched-pairs signed rank test (a) and two-sided Mann Whitney test (b–d).
Next, karyotype analysis of primary breast tumors and metastases archived in the Mitelman Database of chromosomal translocations10 revealed a predilection for near-diploid (2n) karyotypes in primary tumors. Conversely, metastases were enriched for cells with near-triploid (3n) karyotypes and had twice as many structural or numerical chromosomal aberrations per clone. The number of chromosomal aberrations was highest in tumor samples with karyotypes ranging between the diploid and tetraploid (4n) range (Fig. 1b–c and Extended Data Fig. 1c–d).
Finally, histologic analysis of primary tumors from patients with locally advanced head and neck squamous cell carcinoma11 revealed a significant association between anaphase chromosome missegregation and the incidence of lymph node metastasis (Fig. 1d, Extended Data Fig. 1e).
CIN is a driver of metastasis
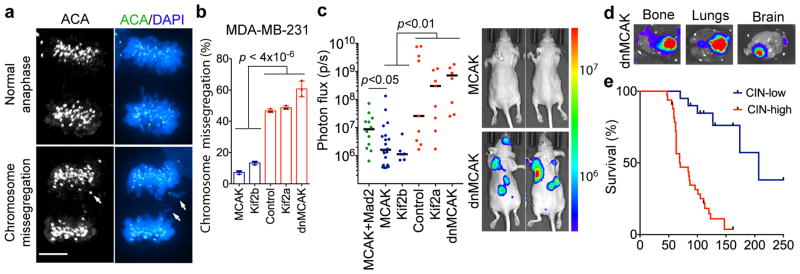
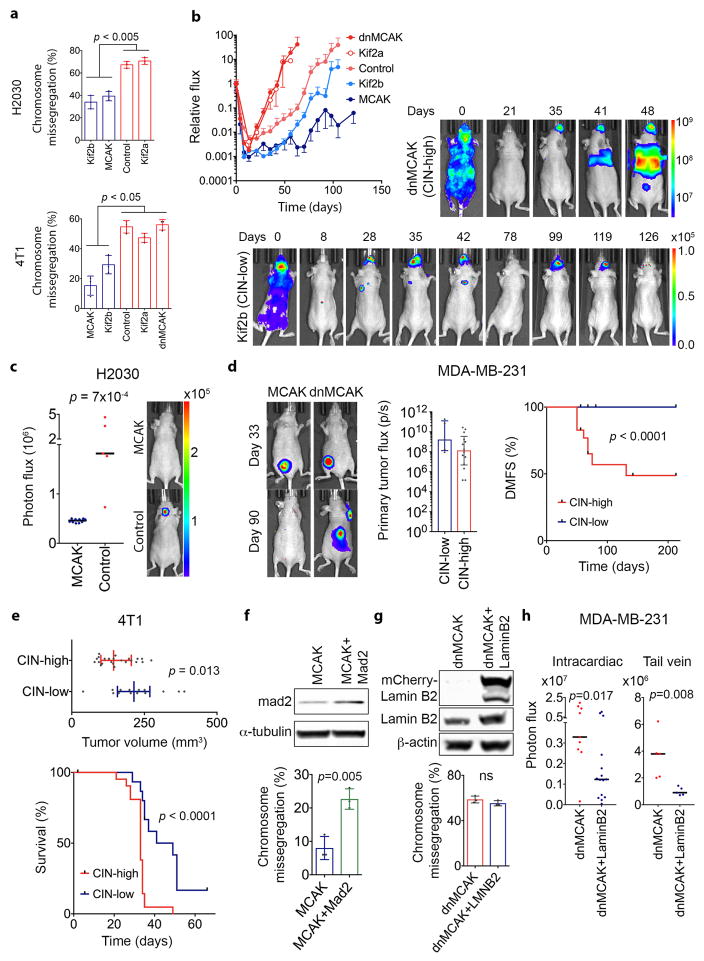
To determine whether CIN is causally involved in metastasis, we used transplantable metastatic tumor models of human (MDA-MB-231) or murine (4T1) triple-negative breast cancer and human lung adenocarcinoma (H2030), in which 47%, 55%, and 67% of anaphase cells, respectively, show evidence of chromosome missegregation. Overexpression of Kif2b or MCAK suppressed chromosome missegregation, whereas overexpression of a dominant negative MCAK mutant12 (dnMCAK) led to a modest increase in chromosome missegregation in MDA-MB-231 cells. Kinesin-13 overexpression did not alter cellular proliferation or the number of centrosomes per cell (Fig. 2a–b, Extended Data Figs. 1f–h and 3a). As a control, we overexpressed Kif2a, a third member of the kinesin-13 proteins that lacks kinetochore and centromere localization domains13, and observed no effect on CIN despite exhibiting microtubule-depolymerizing activity on interphase microtubules (Fig. 2b, Extended Data Fig. 1i–j). We ruled out a direct role for kinesin-13-mediated microtubule depolymerization in activating small GTPases14 by performing RhoA and Rac1 pull-down assays, which revealed low basal levels of activity and no correlation with kinesin-13 overexpression (Extended Data Fig. 2a–b). Hereafter, we refer to MCAK and Kif2b-expressing cells as CIN-low while denoting control, Kif2a, and dnMCAK-expressing cells as CIN-high.
Figure 2. CIN is a driver of metastasis.
a, Anaphase cells stained for centromeres and DNA, scale bar 5-μm. b, Chromosome missegregation in cells expressing kinesin-13 proteins. Bars represent mean ± SD, n = 150 cells. c, Whole animal bioluminescence (BLI) 7 weeks after intracardiac injection of MDA-MB-231 cells. Bars represent the median, n = 12 (MCAK+Mad2), 20 (MCAK), 7 (Kif2b), 9 (control), 9 (Kif2a), 8 (dnMCAK) mice. d, Ex-vivo BLI of organs with metastases from MDA-MB-231 cells expressing dnMCAK. e, Disease-specific survival of mice injected with CIN-high (n = 33) or CIN-low (n = 20) MDA-MB-231. Significance tested using two-sided t-test (b), two-sided Mann Whitney test (c), and two-sided log-rank test (e) n = 3 (a–b) and 5 (d) independent experiments. Throughout the manuscript, pairwise comparisons between individual CIN-low and CIN-high conditions are smaller than the stated p value.
Karyotyping of the parental MDA-MB-231 cells revealed a widely aneuploid (~3n) chromosome content with widespread karyotypic heterogeneity (Extended Data Fig. 2c). Suppression of CIN reduced both numerical and structural karyotypic heterogeneity in single-cell derived clones as supported by the presence of fewer chromosomes exhibiting non-clonal structural abnormalities and decreased numerical chromosome heterogeneity in CIN-low cells (Extended Data Fig. 2c–h). Importantly, CIN-low cells maintained highly aneuploid karyotypes, yet they faithfully propagated them in a stable manner. Thus, by comparing chromosomally stable aneuploid cells to their chromosomally unstable aneuploid counterparts, we can experimentally examine the role of CIN, independently of aneuploidy, in metastasis.
We injected MDA-MB-231 cells into the left cardiac ventricles of athymic mice to enable systemic dissemination while tracking metastatic colonization using a bioluminescence reporter. Altering chromosome missegregation rates had a dramatic effect on colonization, whereby mice harboring CIN-high cells rapidly succumbed to metastatic disease with a median survival of 70 days. Conversely, mice injected with CIN-low cells exhibited lower metastatic burden and a median survival of 207 days. Many metastases from CIN-low cells waxed-and-waned and, at times, spontaneously resolved, whereas metastases from CIN-high cells involved multiple organs and rapidly progressed leading to death. Similar results were obtained after injection of lung adenocarcinoma H2030 cells (Fig. 2c–e and Extended Data Fig. 3b–c). Overexpression of the spindle assembly checkpoint protein, Mad2 in MCAK-expressing cells partially rescued chromosome missegregation15, and correspondingly augmented metastasis (Fig. 2c and Extended Data Fig. 3f).
We performed orthotopic injections of MDA-MB-231 or 4T1 cells into the mammary fat pad of athymic or immune competent BALB/c mice, respectively, followed by surgical excision of the primary tumor. Suppression of CIN had no effect on primary tumor implantation efficiency and even enhanced primary tumor growth in the 4T1 model. Yet, in both models, suppression of CIN significantly reduced spontaneous metastasis and prolonged survival (Extended Data Fig. 3d–e).
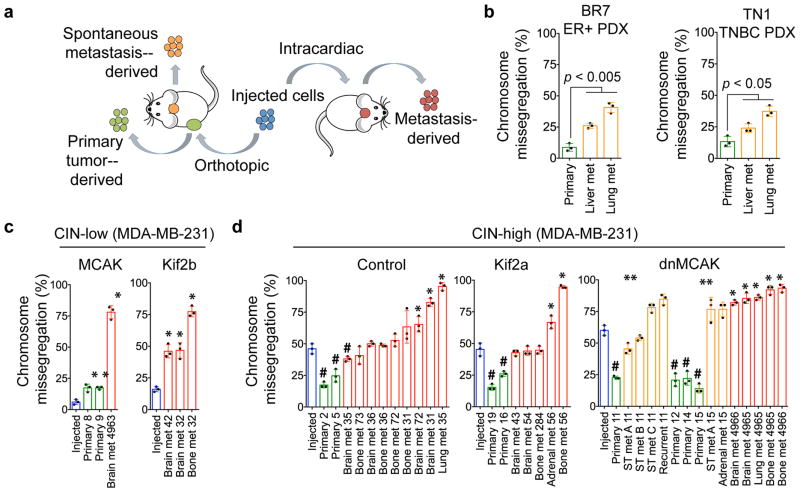
We then assessed chromosome missegregation in the injected cells as well as cells derived from primary tumors and metastatic colonies (Fig. 3a). We performed this analysis using MDA-MB-231 cells and two metastasis-competent xenografts (PDX) derived from patients with ER+ and TNBC. Regardless of the CIN status of the injected cells, the majority of metastases enriched for higher rates of chromosome missegregation, whereas cells derived from most primary tumors had significantly lower rates of CIN (Fig. 3b–d). For instance, when CIN-high cells (Fig. 3d, dnMCAK, blue bars) were injected in the mammary fat pad, chromosome missegregation rates decreased in the primary tumors (green bars) before increasing once more in metastases spontaneously arising within the same animal (orange bars).
Figure 3. Opposing roles for CIN in primary tumors and metastases.
a, Experimental schema. b–d, Chromosome missegregation in injected cells (blue), cells derived from primary tumors (green), metastases (met) arising spontaneously (orange) or after intracardiac injection (red). ST, soft tissue. Bars represent mean ± SD, n = 150 cells, 3 independent experiments, *p < 0.05, #p < 0.05, **p < 0.05 denote samples with higher or lower chromosome missegregation than the injected lines, and spontaneous metastases with higher missegregation than matched primary tumors, respectively. Significance tested using two-sided t-test (b–d).
CIN enriches for mesenchymal traits
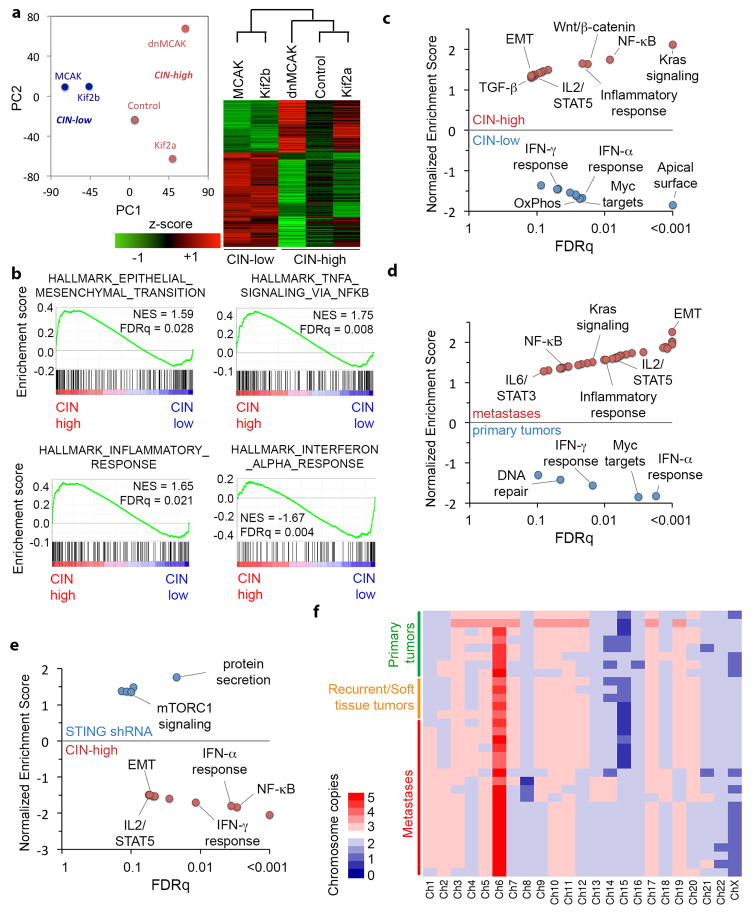
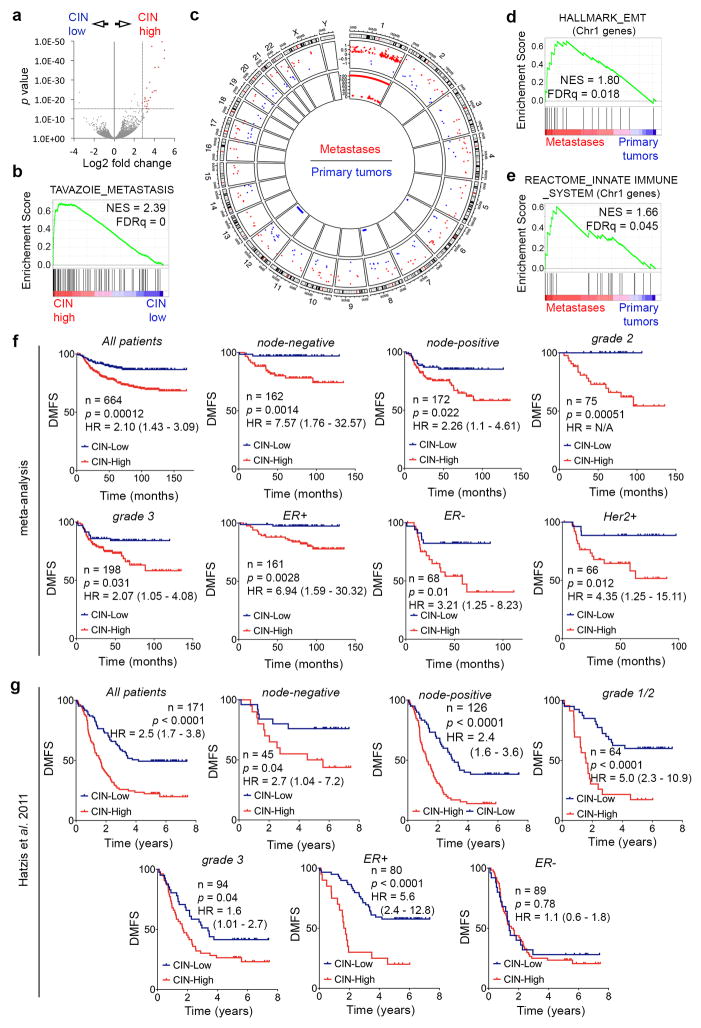
Bulk RNA sequencing (RNA-seq) of CIN-low and CIN-high MDA-MB-231 cells revealed 1,584 differentially expressed genes. Principle component analysis (PCA) and unsupervised clustering accurately separated samples according to their CIN status. Metastasis-related and epithelial-to-mesenchymal (EMT) gene sets were relatively enriched in CIN-high cells. The top 23 differentially expressed genes in CIN-high cells (referred to as CIN signature) predicted distant-metastasis-free survival (DMFS) in a meta-analysis16 as well as a validation cohort17 of patients with breast cancer, irrespective of tumor subtype, grade, or lymph node status (Extended Data Figs. 4 and 5).
RNA-seq of primary tumor-derived and metastasis-derived cells revealed pathways that were shared among metastases and CIN-high cells. Yet, metastases contained a large number of differentially upregulated EMT and inflammation-related genes that were disproportionately clustered on chromosome 1, signifying chromosome 1-specific selection. Karyotype analysis revealed that the injected cell lines and most metastases had three copies of chromosome 1, whereas primary tumors consistently had 2 copies. Thus chromosome 1 loss is a recurrent event during primary tumor growth in this model (Extended Data Figs. 4c–f and 5a–e).
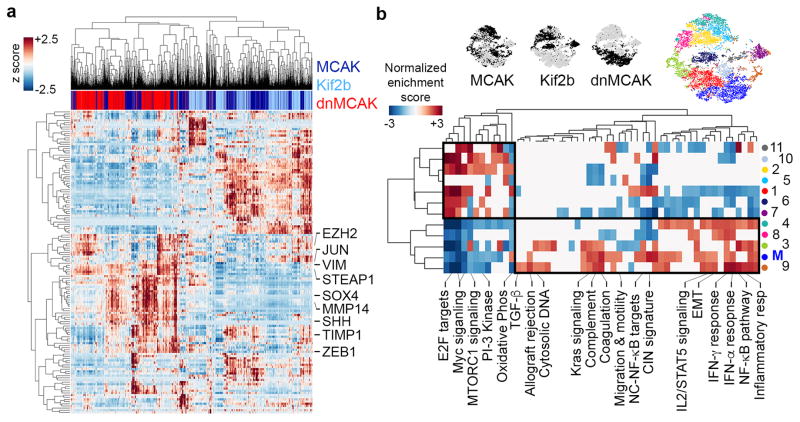
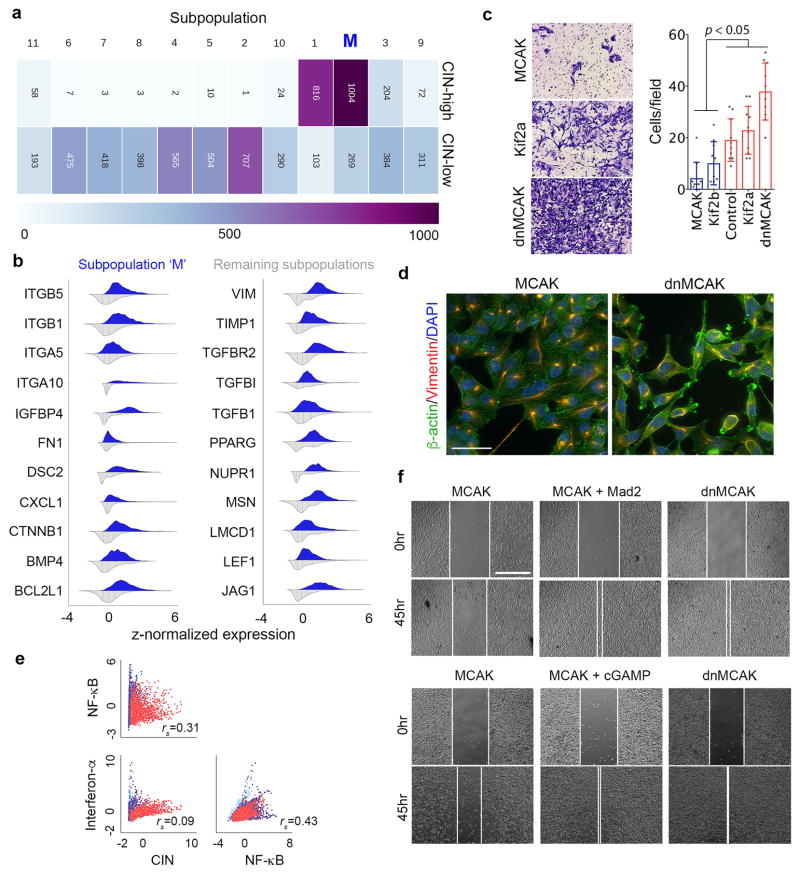
We then performed single-cell RNA sequencing (scRNA-seq) on two CIN-low (Kif2b and MCAK) and one CIN-high (dnMCAK) MDA-MB-231 cell lines comprising a total of 6,821 cells. Clustering of single cells using EMT genes successfully classified most cells based on their CIN-status and revealed a fraction of cells (primarily CIN-high) that was highly enriched in mesenchymal markers (Fig. 4a). Unsupervised graph-based clustering, based on all expressed genes, identified 12 phenotypically distinct subpopulations. One subpopulation was defined by increased expression of genes involved in EMT and metastasis (referred to as subpopulation ‘M’) and was concomitantly enriched for CIN signature genes. This subpopulation comprised 45% of dnMCAK expressing cells compared to 6% of the CIN-low cells (Fig. 4b and Extended Data Fig. 6a–b).
Figure 4. CIN enriches for mesenchymal cell traits.
a, Heatmap showing expression of EMT genes in 6,821 MCAK, Kif2b, and dnMCAK expressing MDA-MB-231 cells. b, Above, t-stochastic neighbor embedding (tSNE) projection of all cells in a. Below, Heatmap of normalized enrichment score (NES) for pathways with an FDRq < 0.05 based on GSEA using one-sided Weighted Smirnov-Kolmogorov test on subpopulations identified using Phenograph. Boxes outline populations with mutually exclusive transcriptional profiles.
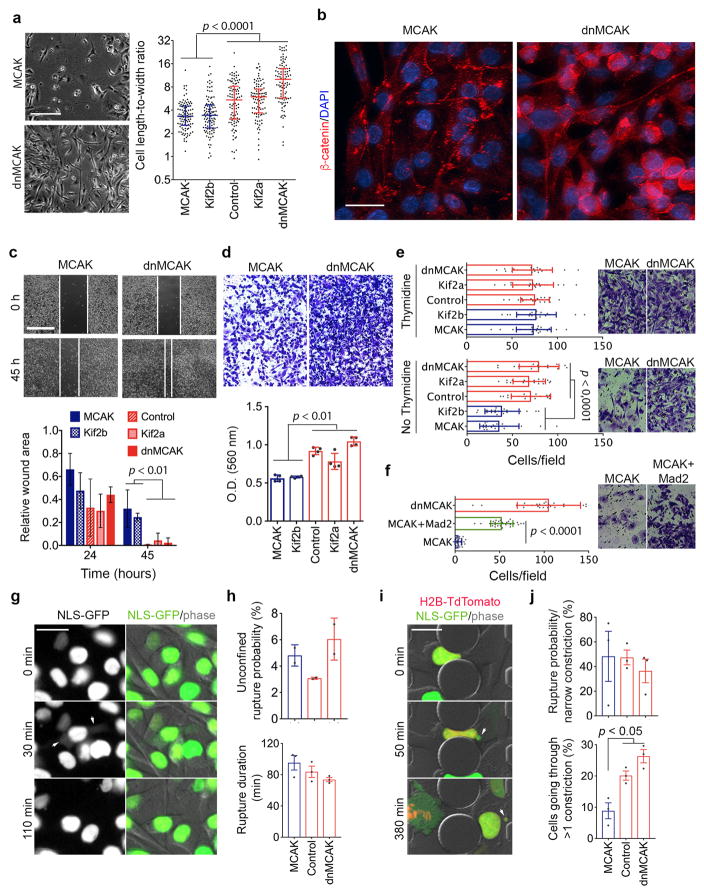
In line with the scRNA-seq data, CIN-high cells exhibited increased migratory and invasive behavior in vitro, and displayed evidence of actin cytoskeletal reorganization, diffuse vimentin staining, and increased cytoplasmic and nuclear localization of β-catenin (Extended Data Figs. 6c–d and 7a–d). Expectedly, Mad2 overexpression rescued invasion and migration of MCAK expressing cells. Furthermore, the ability of Kif2b or MCAK overexpression to suppress invasion in vitro was dependent on the cell cycle, as the addition of thymidine after transient transfection of either proteins abrogated this phenotype (Extended Data Figs. 6f, 7e–f and Supplementary Fig. 2).
CIN generates cytosolic DNA
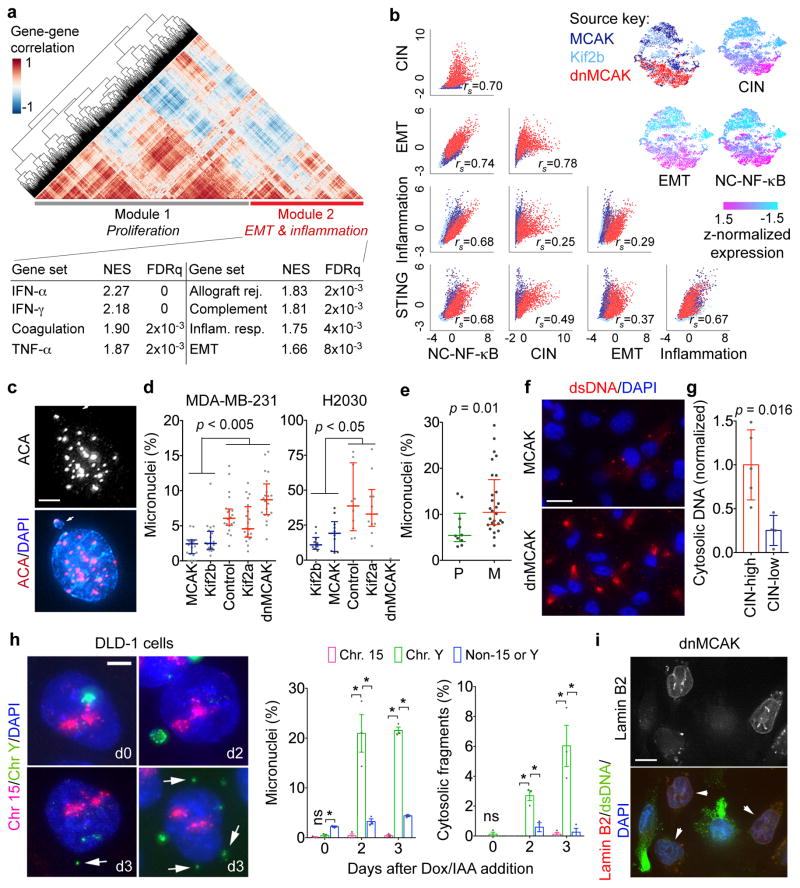
To better define CIN-responsive pathways, we performed a gene-gene Pearson correlation analysis using scRNA-seq data and identified two large gene modules: module 1 was characterized by proliferative and metabolic pathways, whereas module 2 comprised EMT and inflammation gene sets (Fig. 5a). There was a strong positive correlation between inflammation-related, CIN signature, and EMT genes in the scRNA-seq and bulk RNA-seq data (Figs. 4b, 5b, and Extended Data Fig. 4b–c).
Figure 5. CIN generates cytosolic DNA.
a, Heatmap showing gene-gene correlations in 6,821 cells and HALLMARK gene sets significantly enriched in Module 2, one-sided Weighted Smirnov-Kolmogorov test. b, Top right, normalized expression level of key gene signatures in 6,821 MCAK, Kif2b, and dnMCAK expressing MDA-MB-231 cells. Bottom left, Correlation plots for key gene signatures. c, A primary nucleus and a micronucleus stained for centromeres and DNA, scale bar 5-μm. d–e, Percentage of micronuclei cells expressing various kinesin-13 proteins (d) or in cells derived from 10 primary tumors and 28 metastases (e). n = 20 high-power fields per sample (d) or average values derived from 10 high-power fields per sample (e). f, MCAK and dnMCAK expressing MDA-MB-231 cells stained using DAPI and anti-dsDNA antibody, scale bar 20-μm. g, Cytosolic-to-nuclear DNA ratios in CIN-high (n = 5) and CIN-low (n = 4) MDA-MB-231 (n = 5) and H2030 (n = 4) cells. h, Left, DLD-1 cells stained for DNA and hybridized to chromosome-specific FISH probes, scale bar 5-μm. Right, Percentage of cells containing micronuclei or small cytosolic DNA fragments (n >500 cells per condition). i, MDA-MB-231 cells stained using DAPI, anti-dsDNA antibody, or mCherry-Lamin B2 (arrow), scale bar 10-μm. Bars represent median ± inter-quartile range (d–e), mean ± SD (g), mean ± sem (h). n = 6 (c–d), 3 (e–f, h), 1 (g) and 2 (i) independent experiments. Significance tested using two-sided Mann-Whitney test (d–e) or two-sided t-test (g–h), * p <0.05.
Induction of inflammatory pathways in response to CIN was unexpected and was reminiscent of a viral infection. We asked whether CIN might introduce genomic DNA into the cytosol, thereby eliciting cellular responses normally reserved for anti-viral immunity18,19. Exposure of genomic DNA to the cytosol can result from either primary nuclear or micronuclear envelope ruptures20–24. We performed live-cell imaging using a NLS-GFP reporter25 and found no correlation between CIN and the frequency of NLS-GFP leakage into the cytosol in unconfined conditions. There was even a trend for more efficient primary nucleus repair in CIN-high cells. CIN-high nuclei ruptured more frequently only during confined migration, and this was primarily attributed to their increased ability to go through a larger number of small constrictions (Extended Data Fig. 7g–j) that mimic confined migration during metastasis25.
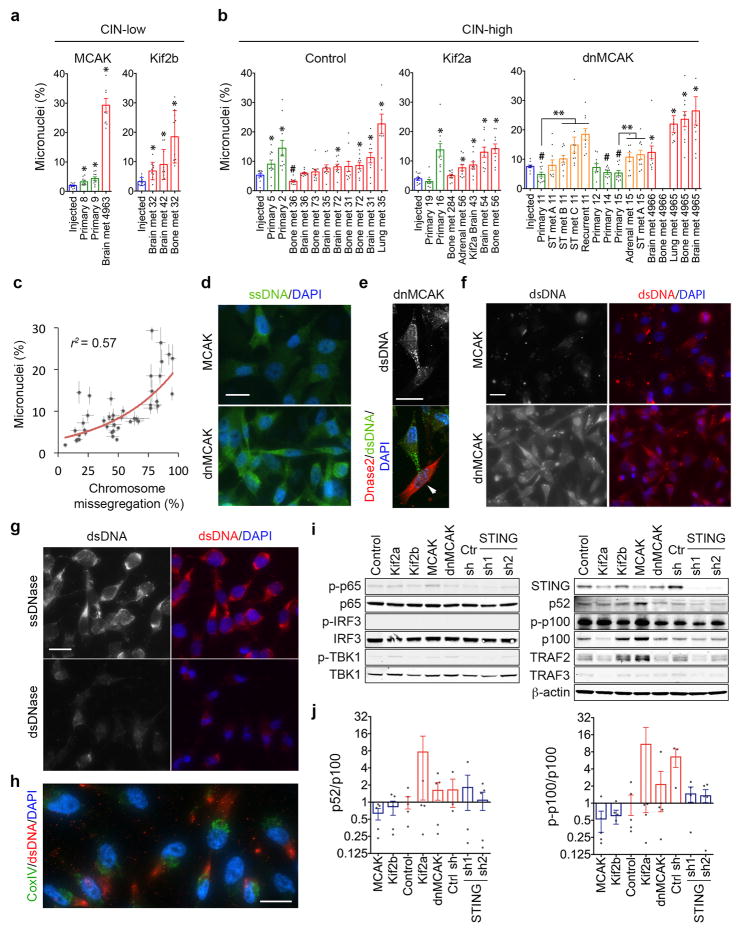
Instead, CIN-high cells and those derived from metastases exhibited a higher preponderance of micronuclei compared with CIN-low or primary tumor-derived cells, respectively (Fig. 5c–e, Extended Data Fig. 8a–c). To examine if rupture-prone20 micronuclei correlated with increased cytosolic DNA, we stained cells using two different anti-dsDNA antibodies after selective plasma membrane permeabilization and found increased cytosolic dsDNA and single-stranded DNA (ssDNA) in CIN-high cells. The dsDNA signal, which was distinct from mitochondrial staining, disappeared after treatment with double-strand-specific – but not single-strand-specific – nuclease and after overexpression of Dnase2, confirming the specificity of these antibodies (Fig. 5f, Extended Data Fig. 8d–h). Quantification of dsDNA levels after subcellular fractionation revealed a four-fold reduction in cytosolic DNA in CIN-low compared to CIN-high cells (Fig. 5g). Whole-genome sequencing of subcellular fractions at 30x coverage confirmed the genomic origin of cytosolic DNA (not shown).
To determine whether missegregated chromosomes provide a source of cytosolic DNA, we employed an inducible Y chromosome-specific missegregation system established in chromosomally stable DLD-1 colorectal cancer cells26. Whole-chromosome FISH probes targeting the Y chromosome or an independent autosome (chr15) revealed selective incorporation of the Y chromosome into micronuclei two days following chromosome missegregation induced by doxycycline and auxin (Dox/IAA) treatment. Strikingly, Y chromosome-specific fragments were found dispersed within the cytosol 2–3 days after Dox/IAA addition, whereas the control autosome remained confined to the nucleus (Fig. 5h), demonstrating that cytosolic DNA is generated from chromosomes undergoing high rates of missegregation
Suppressing micronuclear envelope rupture through mCherry-Lamin B2 overexpression20 reduced cytosolic dsDNA staining without influencing chromosome segregation errors. Accordingly, it reduced metastasis after intracardiac or tail vein injections (Fig. 5i and Extended Data Fig. 3g–h).
Metastasis from cytosolic DNA response
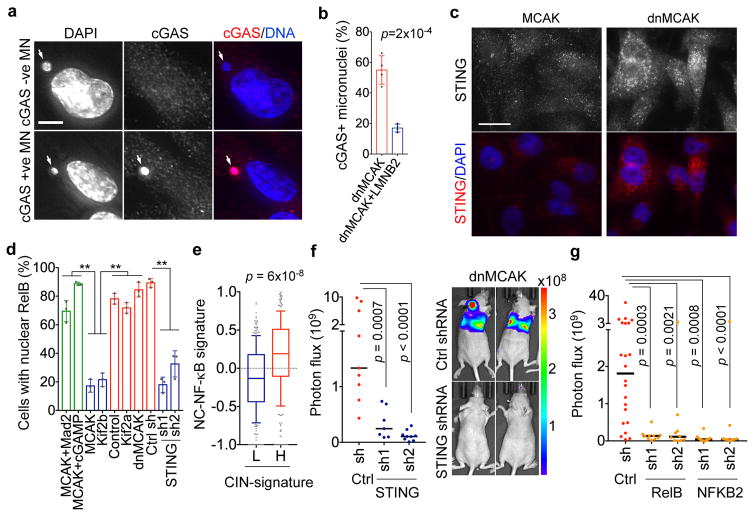
In chromosomally stable cells, cytosolic dsDNA is scarce and is sensed by the cGAS-STING pathway19, leading to induction of type I interferon stimulated genes (ISGs)22,23,27. Indeed, induced missegregation of the Y chromosome led to the upregulation of OAS2, an ISG, and increased interferon-β production by DLD-1 cells (Extended Data Fig. 9f–g). It is unclear how chromosomally unstable cancer cells cope with the constant presence of cytosolic DNA. We found a striking localization of cGAS to approximately half of all micronuclei as previously observed22,23. Impeding micronuclear rupture through Lamin B2 overexpression20 significantly diminished the relative fraction of cGAS+ micronuclei (Fig. 6a–b). Furthermore, CIN-high cells exhibited increased levels and perinuclear localization of STING congruent with pathway activation (Fig. 6c).
Figure 6. Metastasis from a cytosolic DNA response.
a, MDA-MB-231 cells stained for DNA and cGAS, scale bar 5-μm. b, Percentage of micronuclei with (cGAS+) or without (cGAS-) cGAS localization, n = 200 cells. c, Cells stained for DNA and STING, scale bar 20-μm. d, Percentage of MDA-MB-231 cells with nuclear RelB, n = 150 cells. e, Average z-normalized expression of CIN-responsive noncanonical NF-κB target genes in breast cancer patients with low (<30th percentile, _n_ = 330) or high (>30th percentile, n = 332) CIN gene expression signature. f–g, Photon flux (p/s) of whole animals after intracardiac injection with MDA-MB-231 cells expressing control shRNA, STING shRNA (f), RelB shRNA (g) or NFKB2 shRNA (g), n = 9, 7, and 9 mice for the control, STING shRNA1, and STING shRNA2 groups, respectively (f), n = 22, 10, 10, 10, and 9 mice for the control, RelB shRNA1, RelB shRNA2, NFKB2 shRNA1, and NFKB2 shRNA2 groups, respectively (g). Bars represent mean ± SD (b, d), median ± interquartile range with bars spanning 10th–90th percentile (e), median (f–g), significance tested using two-sided t-test (b, d), two-sided Mann Whitney test (e–g), n = 4 (a–b), and 3 (c–d) independent experiments.
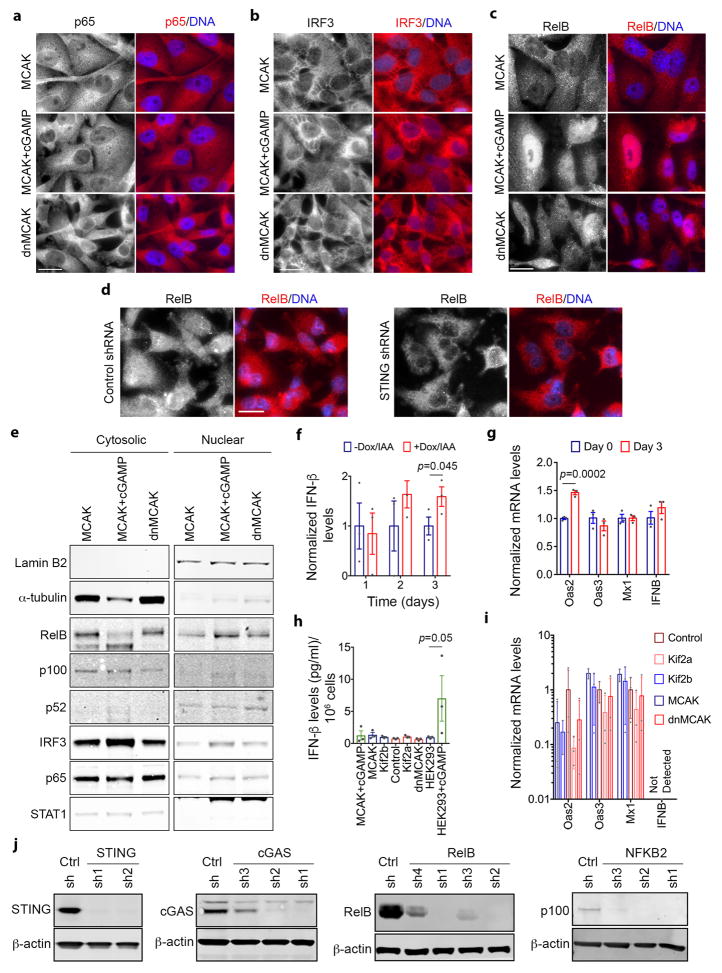
Interestingly, there was no evidence for robust activation of downstream canonical NF-κB or type I interferon signaling in CIN-high cells as evidenced by the lack of a significant increase in p65 or IRF3 phosphorylation, absence of p65 or IRF3 nuclear translocation, undetectable levels of interferon-β, and failure to induce ISGs (Extended Data Figs. 8i–j and 9), in line with previous observavtions28–30.
Cytosolic DNA, however, can activate the noncanonical NF-κB pathway in a STING-dependent and TBK1-independent manner18. We found evidence for noncanonical NF-κB activation in CIN-high cells as revealed by lower levels of the precursor protein, p100, a trend toward higher ratios of p52 and phosphorylated p100 relative to total p100, as well as lower levels of the noncanonical NF-κB pathway inhibitor, TRAF231 (Extended Data Fig. 8i–j). Given the subtle differences seen on the protein level, we assessed the nuclear localization of RelB, the binding partner of p52, and observed increased nuclear localization in CIN-high cells. This was often accompanied by cytosolic staining, indicative of chronic pathway activation. STING depletion reduced RelB nuclear localization and led to downregulation of EMT and inflammatory pathways, whereas the addition of cGAMP or overexpression of Mad2 increased nuclear RelB in MCAK-expressing cells (Fig. 6d, Extended Data Figs. 4e and 9c–e).
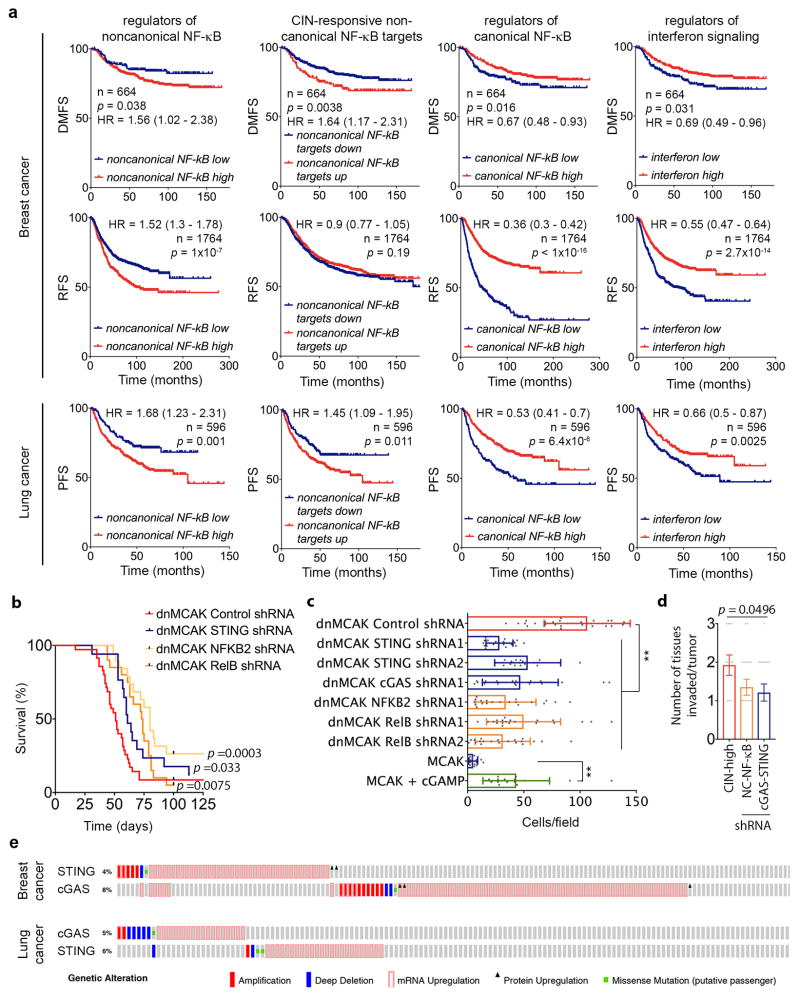
Bulk RNA-seq data revealed a number of noncanonical NF-κB target genes that were upregulated in response to CIN (CIN-responsive NC-NF-κB genes). There was a robust correlation between the CIN signature, STING, and the CIN-responsive NC-NF-κB genes in scRNA-seq data, in contrast to a weaker correlation between CIN and type I interferon targets (Fig. 5b, Extended Data Fig. 6e). Similarly, RNA-seq data from primary breast cancer in the TCGA database demonstrated increased expression of CIN-responsive NC-NF-κB genes in tumors with higher CIN signature genes (Fig. 6e) and higher expression of key regulators of the noncanonical NF-κB pathway or its CIN responsive target genes was associated with shorter DMFS and disease-free survival in breast and lung cancers. Conversely, increased canonical NF-κB or type I interferon regulatory factors were associated with an improved prognosis (Extended Data Fig. 10a).
cGAS activation by cancer cells has been invoked in brain metastasis through a non-tumor cell-autonomous manner32. We found that STING and downstream noncanonical NF-κB activity are mediators of metastasis in a tumor cell-autonomous fashion as evidenced by reduction in metastatic dissemination, lifespan extension, and reduction in in vitro and in vivo invasion in CIN-high cells depleted of STING, RelB, or p100 (NFKB2). Conversely, the addition of cGAMP increased invasion and migration of CIN-low cells (Fig. 6f–g, Extended Data Figs. 6f, 9j, and 10b-d). These findings are in line with reported roles for the noncanonical NF-κB pathway in EMT, cellular invasion, and metastasis33–35.
DISCUSSION
Our work reveals an unexpected link between CIN, chronic activation of cytosolic DNA sensing pathways, and metastasis. In addition to fueling karyotypic heterogeneity that serves as a substrate for natural selection, ongoing chromosome missegregation is required to replenish cytosolic DNA pools and to maintain cells in a pro-metastatic state. Consequently, suppressing CIN reduces metastasis even in highly aneuploid cells. The repercussions of STING activation are context-dependent and range from senescence to tumorigenesis21,27,28,30. Given that chromosomally unstable cells are awash with cytosolic DNA, we raise the interesting possibility that by suppressing downstream type I interferon signaling30 and instead upregulating the alternative NF-κB pathway, they have substituted a lethal epithelial response to inflammation with that of myeloid-derived cells36,37, thereby engaging in some form of immune mimicry. Restoring normal responses to inflammation would constitute a viable therapeutic strategy to target chromosomally unstable cells. The evolutionary benefits of the noncanonical pathway would justify the scarcity of inactivating mutations in cGAS and STING among breast and lung cancers (Extended Data Fig. 10e).
The emergence, and subsequent tolerance, of CIN represents an important bottleneck during tumor evolution38–40. We found that CIN induces a transcriptional shift from a proliferative and highly metabolic state, ideally suited for primary tumor growth, to a mesenchymal state associated with upregulation of inflammatory pathways (Figs. 4b and 5a). These two mutually exclusive states, which were recently observed in a pan-cancer genomic analysis of metastatic tumors41, likely account for the reversibility in chromosome missegregation rates seen in primary tumors and metastases, and provide an explanation for the negative effect of aneuploidy during early tumorigenesis40,42. It also leads us to suggest that CIN drives the subset of human metastases characterized by EMT and inflammation41.
METHODS
Genomic analysis of Primary-metastasis matched pairs
Whole exome DNA sequence data from 79 brain metastases with matched primary tumor and normal9 was downloaded from the database of Genotypes and Phenotypes (dbGAP) and processed as described43 to derive allele specific segmented DNA copy number data for each sample. The weighted Genome Instability Index (wGII), describing the proportion of the genome that was classified as aberrant relative to tumor ploidy, was determined as described8.
Mitelman Database analysis
All available breast adenocarcinoma cases in the Mitelman database10 were analyzed. Primary literature was reviewed to determine the source of the sample (primary tumor or metastasis). When clonal karyotype was reported as a range, the average value was used for that given clone. Karyotype aberrations included structural aberrations as well as numerical deviations from the overall karyotype of the clone.
Analysis of chromosome segregation in HNSCC
We analyzed primary tumor specimens for 60 patients with head and neck squamous cell carcinoma (HNSCC)11. 40 patients had Hematoxylin and Eosin-stained (H&E) primary tumor samples of sufficient quality for high-resolution microscopy analysis. Analysis was restricted to cells fixed while undergoing anaphase as previously described44,45. Chromosome missegregation was defined by hematoxylin staining presence in between the remaining segregating chromosomes during anaphase and it was reported as the percentage of cells undergoing anaphase with evidence of chromosome missegregation as previously described44. Clinical lymph node status was defined on the basis of clinical examination or radiographic evidence of lymph node tumor involvement11.
Single-cell karyotyping
Cultures were treated with colcemid at a final concentration of 0.1μg ml−1. Following 45 min incubation at 37°C, the cultures were trypsinized, resuspended in pre-warmed 0.075M KCl, incubated for an additional 10 minutes at 37°C and fixed in methanol-acetic acid (3:1). The fixed cell suspension was then dropped onto slides, stained in 0.08μg/ml DAPI in 2xSSC for 5 minutes and mounted in antifade solution (Vectashield, Vector Labs). Metaphase spreads were captured using the Nikon Eclipse E800 epifluorescence microscope equipped with GenASI Cytogenetic suite (Applied Spectral Imaging, Carlsbad). For each sample a minimum of 20 inverted DAPI-stained metaphases were fully karyotyped and analyzed according to the International System of Human Cytogenetic Nomenclature (ISCN) 2013.
Fluorescence in situ hybridization (FISH) analysis
FISH analysis was performed on fixed-cells prepared for single-cell karyotyping. Based on karyotype data, a total of four chromosomes were selected to further evaluate numerical instability. Probes specific for Centromere 3 (Red), Centromere 4 (Orange), and Centromere 9 (Green) were purchased form Abbott-Vysis (Des Plaines, IL). Chromosome 6 centromeric probe was home-brew (PAC clone P308; labeled with Green dUTP, MSKCC Molecular Cytogenetics Core Facility. Probe labeling, hybridization, post-hybridization washing, and fluorescence detection were performed according to standard laboratory procedures. For each probe, three normal peripheral blood samples (GM07535, GM06875 and GM00558), obtained from Coriell Institute (Camden, New Jersey) were also analyzed to derive cut-off values (false-positive).
RhoA and Rac1 pull-down assays
The activity of RhoA and Rac1 was determined according to the bead-based pull-down assay kits (Cytoskeleton Inc., RhoA: BK036S, Rac1: BK035S). Cells were lysed on the tissue culture dish and rapidly snap frozen until further processing. cGAMP was added for 18 hours prior to lysis. In addition to His-tagged RhoA and Rac1, the positive and negative controls were total cell lysates supplanted with non-hydrolysable GTP or GDP, respectively.
Cell culture
Cell lines were purchased from the American Type Culture Collection (ATCC). Tumor (MDA-MB-231, 4T1, HEK293, and H2030), cells were cultured in DMEM or RPMI (4T1) supplemented with 10% FBS and 2mM of L-Glutamine in the presence of penicillin (50 Uml−1) and streptomycin (50 μgml−1). All cells tested negative for mycoplasma. Cell confluence was measured using IncuCyte live-cell analysis system (Essen Bioscience).
Immunofluorescence microscopy
Cell fixation and antibody staining were performed as previously described7. Briefly, cells were fixed with ice-cold (−30 C) methanol for 15 minutes – when staining for centromeres, centrosomes, cGAS, Vimentin, β-actin, IRF3, or a-tubulin – or 4% paraformaldehyde – when staining for RelB, p65, STING, ssDNA, dsDNA, CoxIV, or β-catenin. Subsequently, cells were permeabilized using 1% triton for 4 minutes. See supplementary Table 1 for antibody information. For selective plasma membrane permeabilization used for cytosolic dsDNA and ssDNA staining, cells were treated with 0.02% saponin for 5 minutes after fixation. For single-stranded (Thermo Fisher FEREN0321) and double stranded (Life Technologies – EN0771)-specific nuclease treatment, cells were also permeabilized with 0.02% saponin for 2 minutes and treated with either nucleases for 10 minutes before fixation using 4% paraformaldehyde. TBS-BSA was used as a blocking agent during antibody staining. DAPI was added together with secondary antibodies. Cells were mounted with Prolong Diamond Antifade Mountant (Life Technologies – P36961). cGAMP (Invivogen – tlrl-nacga23) was transfected into cells at a concentration of 4μg/ml using lipofectamine2000 that was added for 3–4 hours and then replaced with regular serum containing medium.
Immunoblotting
Cells were pelleted and lysed using RIPA buffer. Protein concentration was determined using BCA protein assay and 20–30μg of total protein were loaded in each lane. Proteins were separated by gradient SDS-PAGE and transferred to PVDF or nitrocellulose membranes. Full blots are shown in Supplementary Fig. 1. See Supplementary Table 2 for antibody information. Band intensities on immunoblots were obtained using ImageJ (www.imagej.nih.gov/ij) or the LI-COR Odyssey software, normalized to loading control and background was subtracted. Ratios were normalized to control cells. Interferon-β levels from conditioned media were measured using the Human IFN beta Array 1-plex (Eve Technologies – HIFNB-01-31).
Y chromosome missegregation and fluorescent in situ hybridization (FISH)
Flp-In T-REx DLD-1 cells were engineered to express the TIR1 auxin-dependent plant E3 ligase, an auxin-inducible degron (AID)-tagged CENP-A modified at the endogenous allele (CENP-AAID/–), and a doxycycline-inducible CENP-AC–H3 rescue gene integrated into the Flp-In locus as previously described26. 4.0 × 10⁴ cells were seeded into 4-well chamber slides and treated with doxycycline (DOX, Sigma) and indole-3-acetic acid (IAA, Sigma) for up to 3 days to induce Y chromosome missegregation and micronuclei. Slides were washed in PBS, fixed in 3:1 methanol:acetic acid for 15 minutes at room temperature, and dehydrated with 80% ethanol. Chromosome paint FISH probes targeting chromosome Y and 15 (MetaSystems) were mixed at equal ratios, applied to cells, sealed with a coverslip, and co-denatured at 75°C for 2 minutes followed by overnight hybridization at 37°C in a humidified chamber. Slides were washed in 0.4x saline–sodium citrate (SSC) buffer for 2 minutes at 72°C, followed by a 30 second wash in 2x SCC, 0.05% Tween-20 buffer at room temperature. Cells were counterstained with DAPI and captured on a DeltaVision Elite (GE Healthcare) microscope system at 60x magnification (25 × 0.2 μm _z_-stacks) followed by image deconvolution and maximum intensity quick projection.
Knockdown and overexpression constructs
Luciferase expression was achieved using pLVX plasmid (expressing tdTomato) and cells stably expressing luciferase were selected using hygromycin and sorted for tdTomato expression. Kinesin-13 expression was achieved using plasmid (pEGFP) transfection or lentiviral (pLenti-GIII-CMV-GFP-2A-Puro) expression where cells were selected using G418 (0.5mgml−1) or puromycin (5μgml−1), respectively. Dnase2 overexpression was achieved using a pLenti-GIII-CMV-RFP-2A-Puro plasmid with puromycin used for selection. Plasmids containing kinesin-13 or Lamin B2 (pQCXIB-mCherry-lmnb2) constructs were kindly offered by the Compton and Hetzer Laboratories, respectively. Blasticidin was used to select for lmnb2 expressing cells at 10μgml−1. All other plasmids were purchased from Applied Biological Materials Inc. (www.abmgood.com). Stable knockdown of STING, NFKB2, RelB, and cGAS were achieved using shRNAs in pRRL (SGEP or SGEN) plasmids and were obtained from the MSKCC RNA Interference Core. 2–4 distinct shRNA hairpins were screened per target. Targeted shRNA sequences are listed in Supplementary Table 3. To visualize primary nuclear rupture, cells were stably modified with retroviral construct expressing both NLS-GFP25 and H2B-Tdtomato (3xNLScopGFP-P2A-H2BtdTomato-IRES-Puromycin). Cells were cultured for 24 hours after viral transduction before selection with 1μg ml−1 of Puromycin and subsequently sorted to select for NLS-GFP and H2B-TdTomato expression.
Cell migration in microfluidic devices
Microfluidic migration devices with precisely defined constrictions were prepared as described previously25,46. Devices were coated with 50 μg/mL of type-I rat tail collagen (BD Biosciences) in 0.02N acetic acid overnight at 4°C. Approximately 80,000 cells were seeded (in DMEM supplemented with 10% FBS and 1% PenStrep) per migration chamber. Devices were placed in a tissue-culture incubator (37°C) for 5–6 hours to allow the cells to adhere. Subsequently, media was changed to phenol-red free Leibovitz L15 media supplemented with 10% FBS and 1% PenStrep before mounting the device on an inverted microscope (Zeiss Observer Z1) equipped with temperature-controlled stage (37°C) for live-cell imaging. The media reservoirs of the device were covered with glass coverslips to minimize evaporation during live-cell imaging. Cells were imaged for 14–16 hours at 10 minute intervals with a CCD camera (Photometrics CoolSNAP KINO) using a Zeiss 20′/NA 0.8 air objective. Acquired image sequences were analyzed for nuclear rupture frequency, duration, and transit time of cells through 1×5μm2, 2×5μm2, and 15×5μm2 constrictions using Zen (Zeiss) software and a custom-written MATLAB 2016a script for automated image analysis.
Animal studies
Animal experiments were performed in accordance with protocols approved by the Weill Cornell Medicine Institutional Animal Care and Use Committee. For disease-specific survival in MDA-MB-231 experiments, power analysis indicated that 10 mice per group will be sufficient to detect a difference at relative hazard ratios of <0.2 or >5 with 80% power and 95% confidence, given a median disease-specific survival of 3 months in the control group and a total follow up period of 250 days. For the 4T1 experiments, Power analysis indicates that 10 mice per group will be sufficient to detect a difference at relative hazard ratios of <0.25 or >4.0 with 80% power and 95% confidence, given a median survival of 58 days in the control group and a total follow up period of 180 days. There was no need to randomize animals. Investigators were not blinded to group allocation. Intracardiac injection was performed as previously described32. Briefly, cells were trypsinized and washed with PBS and a 1×10⁵ cells (in 100 μl of PBS) were injected into the left cardiac ventricle of female athymic 6–7 week old athymic nude (nu/nu) mice (Jackson Laboratory strain 002019). 2×10⁵ cells were injected into the tail vein cohort of animals. Mice were then immediately injected with D-luciferin (150 mgkg−1) and subjected to bioluminescence imaging (BLI) using tan IVIS Spectrum Xenogen instrument (Caliper Life Sciences) to ensure systemic dissemination of tumor cells. Metastatic burden was measured 5–7 weeks after injection using BLI. BLI images were analyzed using Living Image Software v.2.50. Disease-specific survival endpoint was met when the mice died or met the criteria for euthanasia under the IACUC protocol and had radiographic evidence of metastatic disease. For orthotopic tumor implantation, 2.5×10⁵ cells in 50μl of PBS were mixed 1:1 with Matrigel (BD Biosciences) and injected into the fourth mammary fat pad. Only one tumor was implanted per animal. MDA-MB-231 primary tumors were surgically excited before they reached ~1.5 cm in the largest dimension (which was the maximum allowable under our IACUC protocol) and metastatic dissemination was assessed using BLI imaging at 1–3 week intervals for up to 30 weeks. Distant metastasis-free survival endpoint was met when BLI signal was seen outside of site of primary tumor transplantation. 4T1 tumors were excised 8–9 days after implantation. To derive short-term culture from primary tumors and metastases, anesthetized animals (isofluorane) were imaged then sacrificed. Ex-vivo BLI was subsequently performed on harvested organs to define the precise location of the metastatic lesion. Primary tumors and metastases were subsequently mechanically dissociated and cultured in DMEM with selection media (G418 or hygromycin) to select for tumor cells and exclude host cells. All subsequent assays (karyotyping, RNAseq, immunofluorescence, and subcellular fractionation) were performed after a single passage from the primary sample. To assess chromosome missegregation from primary tumor-derived and metastases-derived cells, we performed high-resolution immunofluorescence analysis on passage #1 cells, staining for DNA (DAPI) and centromeres (ACA). Cells with DNA or centromere staining in the middle of the anaphase plate was taken as evidence of chromosome missegregation.
Patient-derived xenografts (PDX) assays
PDX models of human metastatic breast cancers were generated by transplanting the freshly obtained surgically excised tumor specimens from patients consented under the IRB approved protocol (MSKCC IRB #97-094) in female NOD-scid IL2Rgammanull (NSG) (Jackson Laboratories strain 005557). All relevant ethical regulations were followed. The estrogen receptor-positive PDX was derived from breast cancer metastatic to the bone. The TNBC PDX was established out of an axillary lymph node metastasis from a patient with inflammatory breast cancer. PDXs were maintained for a maximum of three serial passages. Briefly, freshly obtained tumor tissue specimens were either directly transplanted in the mammary fat-pad of the mice or minced into 1–2 mm pieces in serum free MEM medium with nonessential amino acids (Cat# 41500018, Thermofisher) transduced with lentiviral vectors expressing either GFP-luciferase or pUltra-Chili-Luc plasmid (Addgene plasmid: 48688) followed by transplantation into mice. Typically PDX tumor growth became evident during the first 1–3 weeks post engrafting and tumor continued to grow for additional 4–8 weeks. Primary tumor growth and metastases were followed using BLI or spectrum CT imaging. At the time of harvesting of primary tumors and metastases, we derived primary cell cultures directly from primary tumors as well as lung and liver metastases. Briefly, 500 mg of fresh bulk tumor tissues were chopped into 1–2 mm3 sized pieces and incubated in Accutase (AT104; Innovative Cell Technologies) for cell detachment and separation over 1–2 hours. The dissociated tissues were sieved through 100-μm cell strainers and pelleted the cells by centrifugation at 1200 RPM. The pellets were washed and resuspended in the above MEM buffer with 3% FBS. Cells were analyzed for chromosome missegregation after one passage.
RNA sequencing and analysis
Bulk RNA was extracted from cells using the QIAShredder (Qiagen – 79654) and the RNA extraction kit (Qiagen – 74106) and sequenced using HiSeq2500 or HiSeq4000 (Illumina Inc.). The quality of the raw FASTQ files were checked with FastQC (https://www.bioinformatics.babraham.ac.uk/projects/fastqc/). For samples originating from mouse xenografts, FASTQ reads were classified as originating from either mouse (GRCm38) or human (GRCh38) genomes using xenome47, and human-specific reads were used for mapping. Reads were mapped to human reference GRCh38 using STAR (v2.4.1d, 2-pass mode)48. Gene expression was estimated using cufflinks (v2.2.1, default parameters) and HTSeq (v0.6.1)49,50. Differential expression analyses were performed using DESeq2 (v1.14.1)51. Pre-ranked gene set enrichment analyses (GSEA) was performed on the DESeq2 log2 fold changes52. Prior to any unsupervised analyses, expression counts were transformed using variance stabilizing transformation using the DESeq2 R package. Gene signatures used in the study are listed in Supplementary Table 5. Differentially expressed gene sets and their associated statistics are listed in Supplementary Table 6. To detect potential copy number changes, positional gene enrichment analysis (PGE) was performed on the up-regulated and down-regulated differentially expressed genes, separately (padj ≤ 0.1)53. Only significant regions with 4 or more genes and with p-value ≤ 0.01 were kept for further analysis. Circos plots were made using the circlize R package54.
Reverse-transcriptase quantitative polymerize chain reaction (RT-qPCR)
Cells were collected into trizol® reagent (thermofisher) and total RNA was extracted using ‘Pureling RNA mini kit’ (thermofisher) according to manufacturer’s instructions. 5ug of total RNA was used in reverse transcriptase polymerase chain reaction performed using ‘RNA to cDNA Ecodry™ premix (oligo dT)’ cDNA synthesis kit (Clontech) according to manufacturers instructions. Resulting cDNA corresponding to 50ng of total RNA was used in each 20ul of quantitative real time PCR reaction. qRT-PCR was performed using SybrGreen master mix (Biorad) and the relative expression of each gene was calculated after normalizing to β-Actin endogenous control and using comparative ΔCt method. A list of the primers used is in Supplementary Table 4.
Single-cell RNA sequencing
Cells were trypsinized and resuspended in PBS. 21μl of a cellular suspension at 400 cells/ul, >95% viability, were loaded onto to the 10X Genomics Chromium platform to generate barcoded single-cell GEMs. Single-cell RNA sequencing (scRNA-seq) libraries were prepared according to 10X Genomics specifications (Single Cell 3′ Reagent Kits User Guide PN-120233, 10x Genomics, Pleasanton, CA, USA). GEM-Reverse Transcription (RT) (55°C for 2h, 85°C for 5min; held at 4°C) was performed in a C1000 Touch Thermal cycler with 96-Deep Well Reaction Module (Bio-Rad, Hercules). After RT, GEMs were broken and the single-strand cDNA was cleaned up with DynaBeads MyOne Silane Beads (Thermo Fisher Scientific, Waltham, MA) and SPRIselect Reagent Kit (0.6 × SPRI; Beckman Coulter). cDNA was amplified for 14 cycles using the C1000 Touch Thermal cycler with 96-Deep Well Reaction Module (98°C for 3min; 98°C for 15s, 67°C for 20s, and 72°C for 1min × 14 cycles; 72°C for 1min; held at 4°C). Quality of the cDNA was analysed using an Agilent Bioanalyzer 2100 (Santa Clara, CA). The resulting cDNA was sheared to ~200bp using a Covaris S220 instrument (Covaris, Woburn, MA) and cleaned using 0.6 x SPRI beads. The products were end-repaired, ‘A’-tailed and ligated to adaptors provided in the kit. A unique sample index for each library was introduced through 10 cycles of PCR amplification using the indexes provided by in the kit (98°C for 45 s; 98°C for 20s, 60°C for 30s, and 72°C for 20 s x 14 cycles; 72°C for 1min; held at 4°C). After two SPRI cleanups, libraries were quantified using Qubit fluorometric quantification (Thermo Fisher Scientific, Waltham, MA) and the quality assessed on an Agilent Bioanalyzer 2100. Four libraries were pooled and clustered on a HiSeq2500 rapid mode at 10pM on a pair end read flow cell and sequenced for 98 cycles R1, followed by 14bp I7 Index (10X Barcode), 8bp I5 Index (sample Index) and 10bp on R2 (UMI). Primary processing of sequencing images was done using Illumina’s Real Time Analysis software (RTA). Demultiplexing and post processing was done using the 10X Genomics Cell Ranger pipeline as per the manufacturer recommendations. Single cell RNA sequencing data (scRNA-seq) was processed from raw reads to a molecule count array using the Cell Ranger pipeline55. Additionally, to minimize the effects of experimental artifacts on the analysis, data was pre-processed to filter out cells with low total molecule counts (library size), low complexity and high mitochondrial content, identified by a bimodal fit. Remaining cells were normalized by dividing the expression level of each gene in a cell by its total library size and then scaling by the median library size of all cells). After normalizing by library size; we performed principal component analysis (PCA) to improve robustness of the constructed Markov Matrix generated when computing diffusion eigenvalues for imputation of dropout noise56. We chose the number of principle components to retain approximately 80% of variance in the data and excluded the first principal component, which was highly correlated with library size. Imputation of both he normalized and unnormalized count matrix was performed using a Markov matrix raised to the power of 3 (power corresponds the approximate number of weighted nearest neighbors) and with a gene expression distribution computed according to 21 nearest neighboring cells as described56. Our analysis was robust to imputation and we obtained similar results without imputed data (not shown). Subpopulations were identified using Phenograph57 and genes differentially expressed in at least one subpopulation were identified by the Kruskal-Wallis rank statistic using a bootstrapping method for random downsampling of matched molecule and cell counts from each subpopulation. t-Distributed Stochastic Neighbor Embedding (t-SNE) was used to visualize subpopulation structure based on the first 20 principle components of the imputed count matrix, subsetted by the top 5,150 differentially expressed genes (FDR q of Kruskal Wallis rank statistic < 0.05). Mean expression of key gene signatures in population M versus other subpopulations were z-normalized and visualized by violin plots. All gene signatures are annotated in Supplementary Table 5. The correlation between gene signatures was computed using the Spearman Rank Correlation Coefficient according to mean expression of all genes per signature per cell. Ward’s minimum variance method was applied to hierarchically cluster cells by their normalized expression of differentially expressed EMT genes.
Patient survival analysis
Genes used for survival analysis are listed in Supplementary Table 5. For the meta-analysis cohort, we used aggregate data from KMPlot (www.kmplot.com)16,58 using only JetSet best probe set and auto-selection for best cutoff between the 25th and 75th percentile. For the validation cohort in which DMFS data was available17, we used the z-normalized expression data for a dataset and the median value was used as a cutoff. DMFS curves were compared using the log-rank test.
In vitro invasion and migration assays
For the invasion and migration/chemotaxis assays we used the CytoSelect cell invasion (CBA-110) and cell migration (CBA-100) kits, respectively. Briefly, 3×10⁵ cells were suspended in serum-free media and placed on top of the membrane. Media containing serum was placed at the bottom and cells, which have invaded to the inferior surface of the collagen membrane, were stained and counted 18–24 hours later. For experiments involving transient transfection, cells were transfected, and thymidine (2mM) was added 18 later. Cells were plated on the membrane 3 days after transfection. For the chemotaxis assay, we used a colorimetric approach (OD 560nm) for quantification. For the scratch assay, cells were treated with mitomycin C (10 μgml−1) for 1 hour when they reached >90% confluence and then placed in DMEM containing 1% FBS. Wounds were applied using p200 pipette tip and images of the wound were taken immediately and at subsequent regular intervals. ImageJ was used for quantification of wound surface area.
Quantification of cytosolic DNA
Approximately 1×10⁷ cells were lysed and the nuclear, cytosolic, and mitochondrial fractions were obtained using the mitochondrial isolation kit (Thermo Fisher – 89874). Protease inhibitors were not used to enable subsequent DNA purification. Mitochondria were purified at 12,000x_g_ to minimize their contamination in the cytosolic fraction. DNA was subsequently isolated from the nuclear, cytosolic, mitochondrial fractions using the Qiagen DNeasy blood and tissue kit (Qiagen – 69506) and dsDNA was quantified using Qubit 2.0 (Invitrogen) using Qubit dsDNA HS Reagent.
Code availability
All custom code, statistical analysis, and visualizations were performed in Python or R, and used Nextflow to manage some of the computational pipelines59. Code for the RNA sequencing analysis is available online at: https://github.com/murphycj/manuscripts/tree/master/BakhoumEtAl2017. The live-cell tracking MATLAB 2016a code can be found at https://github.com/Lammerding/MATLAB-CellTracking
Data availability
Source data for figures 1–3, 5–6, and Extended Data figures 1–3 and 5–10 are provided with the paper. Single-cell RNA sequencing data (shown in figures 4–5 and Extended Data figure 6) was deposited in the Sequence Read Archive under the following accession number: SRP104750 (ftp://ftp-trace.ncbi.nlm.nih.gov/sra/review/SRP104750_20170426_131604_b0888d686e89bf883fe90b85c9220b47). Bulk RNAseq data (shown in Extended Data figures 4–5) was deposited in Gene Expression Omnibus under accession number GSE98183 (https://www.ncbi.nlm.nih.gov/geo/query/acc.cgi?acc=GSE98183)
Extended Data
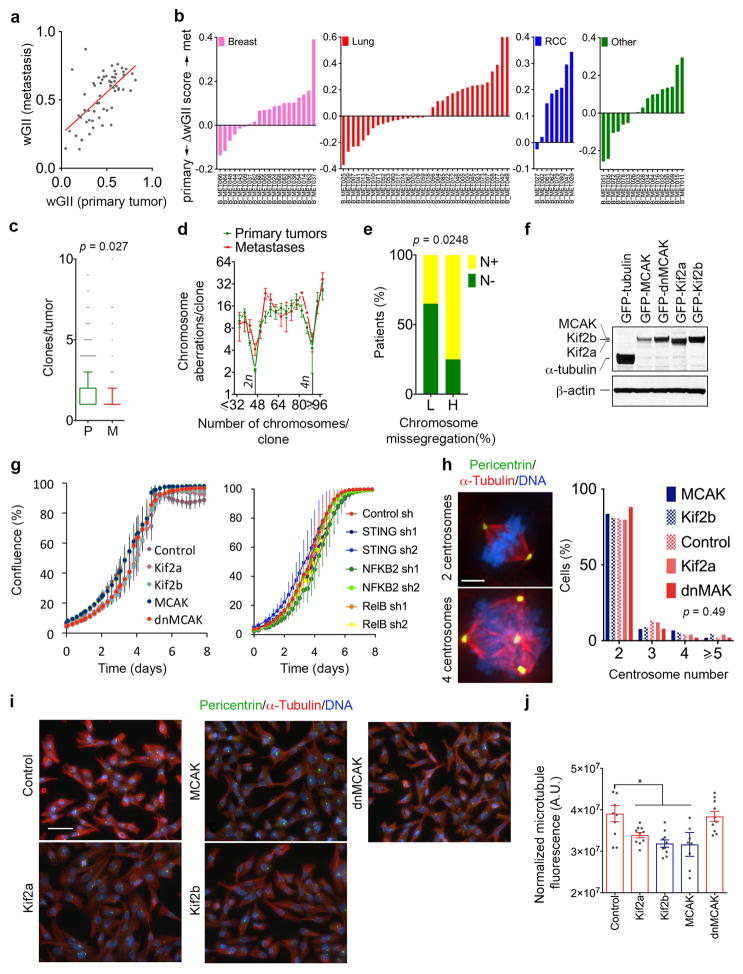
Extended Data Figure 1. Generation of isogenic tumor models of CIN.
a, Weighted genomic instability index (wGII) of brain metastases as a function of the wGII of the matched primary tumor. Red line represents linear regression, n = 79 patients. b, Differences in wGII between metastases and matched primary tumors. RCC, renal cell carcinoma, the “Other” category includes melanoma, sarcoma, ovarian, thyroid, and salivary gland cancers. c, Number of clones (based on single-cell karyotypes) in primary breast tumors (n = 637) or metastases (Mets, n = 131) found in the Mitelman Database, boxes represent median ± interquartile range and bars span the 10th and 90th percentile, significance tested using two-sided Mann Whitney test. d, The number of chromosome aberrations per clone as a function of the total number of chromosomes in a given clone in samples derived from primary breast tumor clones (n = 983) and metastatic clones (n = 186), data points represent average ± SD. e, Percentage of N− or N+ patients as a function of chromosome missegregation frequency (n = 20 patients per condition), significance tested using two-sided Fisher Exact test. f, Immunoblots of cells expressing various GFP-tagged kinesin-13 proteins stained using anti-GFP antibody, β-actin used as a loading control, 2 independent experiments. g, Cellular confluence as a function of time of MDA-MB-231 cells expressing various kinesin-13 proteins or dnMCAK expressing cells depleted of components of the cytosolic DNA-sensing machinery or the noncanonical NF-κB pathway, data points represent mean ± SD, n = 4 independent experiments. h, Left, MCAK and dnMCAK expressing cells stained for microtubules (DM1A), centrosomes (pericentrin) and DNA (DAPI), scale bar 5-μm, 2 independent experiments. Right, Frequency distribution of the number of pericentrin foci per cells. Significance tested using ANOVA. n = 100 cells per condition, 2 independent experiments. i, Cells expressing kinesin-13 proteins stained for microtubules (DM1A), centrosomes (pericentrin) and DNA (DAPI), scale bar 50-μm, 2 independent experiments. Bottom-right, Fluorescence normalized to cell count of MDA-MB0-231 cells expressing kinesin-13 proteins, bars represent mean ± s.e.m., * p < 0.05, two-sided t-test, n = 10 high-power fields encompassing 477–612 cells, 2 independent experiments.
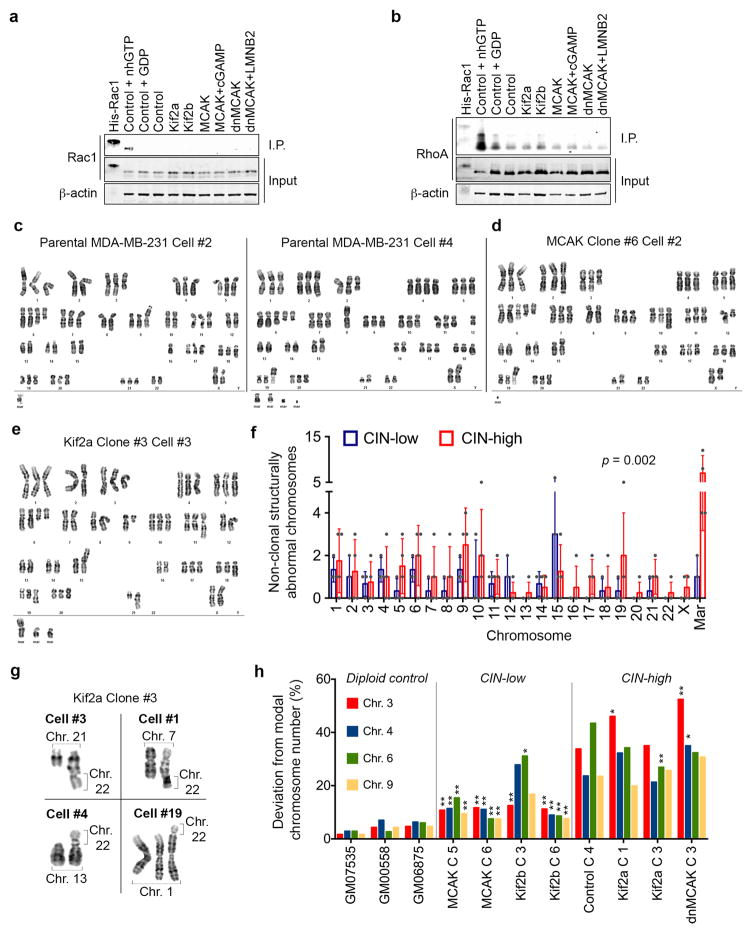
Extended Data Figure 2. Karyotype analysis of human tumor cells.
a–b, Immunoblots showing total Rac1 (a) or RhoA (b) levels as well as Rac1 or RhoA that were pulled-down using antibodies that were specific to the GTP-bound form of Rac1 (a) or RhoA (b). Positive and negative controls were total MDA-MB-231 cell lysates supplanted with non-hydrolysable GTP (nhGTP) or GDP, respectively. β-actin was used as a loading control, 2 independent experiments. c–e, Representative karyotypes (DAPI-banding) from parental MDA-MB-231 cells (c), or populations derived from single MCAK (d) or Kif2a (e) expressing cells that were allowed to divide for 30 days. f, The number of non-clonal (present in <25% of the cells in a single clone) structurally abnormal chromosomes in CIN-low or CIN-high MDA-MB-231 cells. ‘Mar’ denotes chromosomes so structurally abnormal that precludes their unambiguous identification by conventional banding, bars represent mean ± SD, n = 140 cells from 7 clonal populations, significance tested using two-way ANOVA test. g, Examples taken from 4 distinct cells belonging to the same clonal population – derived from a single Kif2a-expressing cell – showing convergent translocations involving chromosome 22 with four other chromosomes. h, Deviation from modal chromosome number in single-cell-derived clones grown for 30 days. Four chromosomes were assayed for each clone using centromere-specific probes, *p < 0.05, **p < 0.005 compared to control clone 4, two-sided c2-test, n = 300 cells per clone. Diploid controls were used to determine false positive rate of the centromeric probes.
Extended Data Figure 3. CIN promotes formation and maintenance of metastasis.
a, Chromosome missegregation in H2030 and 4T1 cells expressing kinesin-13 proteins. Bars represent mean ± SD, n = 150 cells, 3 independent experiments, significance tested using two-sided t-test. b, Left, Normalized photon flux over time of whole animals injected with MDA-MB-231 cells expressing kinesin-13 proteins Bars represent mean ± s.e.m. n = 8 (MCAK), 7 (Kif2b), 5 (Control), 4 (Kif2a), and 9 (dnMCAK) mice per group, 3 independent experiments. Right, Mice injected with MDA-MB-231 cells expressing dnMCAK (above) or Kif2b (below) where disease burden was tracked using BLI, 3 independent experiments. c, Photon flux (p/s) of whole animals imaged 5 weeks after intracardiac injection with control or MCAK expressing H2030 cells. Bars represent the mean, significance tested using two-sided Mann Whitney test, n = 10 mice in the MCAK group and 5 mice in the control group. d, Left, Representative BLI images from two independent experiments of mice orthotopically transplanted with MDA-MB-231 cells before (Day 33) and after (Day 90) tumor excision. Metastasis can be detected in the mouse transplanted with dnMCAK expressing cells at day 90. Middle, Total flux (p/s) emitted from primary tumors 52 days after transplantation. Bars represent mean ± SD, n = 5 (CIN-low) and 14 (CIN-high) mice, p = 0.13, two-sided Mann Whitney test. Right, Distant metastasis-free survival (DMFS) of mice orthotopically transplanted with MDA-MB-231 cells with various levels of CIN. n = 15 (CIN-low) and 29 (CIN-high) mice, pairwise significance tested with two-sided log-rank test. e, Tumor volume at 8 days (top) and survival (bottom) of mice transplanted with murine 4T1 cells in the mammary fat pad. Bars represent median ± interquartile range, pairwise significance tested with two-sided t-test (top) and two-sided log-rank test (bottom). n = 20 (CIN-low) and 30 (CIN-high) mice. f, Top, immunoblots of MCAK or MCAK and mad2 overexpressing MDA-MB-231 cells stained for mad2 using anti-mad2 antibody with a-tubulin used as a loading control, 3 independent experiments. Bottom, Percentage of anaphase cells exhibiting evidence of chromosome missegregation in MCAK or MCAK and mad2 overexpressing cells, bars represent mean ± SD, n = 150 cells, 3 experiments, significance tested using two-sided t-test. g, Top, immunoblots of dnMCAK or dnMCAK and Lamin B2 overexpressing MDA-MB-231 cells stained for Lamin B2 using anti-Lamin B2 antibody with β-actin used as a loading control, 2 experiments. Bottom, Percentage of anaphase cells exhibiting evidence of chromosome missegregation in dnMCAK or dnMCAK and Lamin B2 overexpressing cells, bars represent mean ± SD, n = 150 cells, 3 experiments, significance tested using two-sided t-test. h, Photon flux (p/s) of whole animals after intracardiac (left) or tail vein (right) injection with dnMCAK or dnMCAK and Lamin B2 expressing MDA-MB-231 cells. Bars represent the median, significance tested using two-sided Mann Whitney test, n = 9 (dnMCAK), 15 (dnMCAK and Lamin B2) mice in the intracardiac injection cohort and 5 mice per group in the tail vein injection cohort.
Extended Data Figure 4. Transcriptional consequences of CIN in cancer cells.
a–b, Principle component analysis (PCA) (left) and unsupervised clustering (right) of 5 MDA-MB-231 cell lines expressing different kinesin-13 proteins based on bulk RNA expression data. b–e, Gene set enrichment analysis (GSEA) results showing HALLMARK gene sets that are highly enriched in CIN-high (control, Kif2a, and dnMCAK) compared with CIN-low cells (MCAK and Kif2b) cells (b–c) or STING-depleted cells (e), or after comparing metastases with primary tumors (d), significance tested using one-sided Weighted Smirnov-Kolmogorov test corrected for multiple tests. f, Heatmap of consensus chromosomal karyotypes of cells derived from primary tumors and metastases showing selective increase in chromosome 1 copy number in metastases compared with primary tumors.
Extended Data Figure 5. Prognostic impact of the CIN signature.
a, Volcano plot showing differentially expressed genes between CIN-high and CIN-low MDA-MB-231 cells. Red data points denote genes subsequently used for determining the CIN signature. b–e, Enrichment plots for all differentially expressed genes (a) or those on Chromosome 1 (d–e). Circos plot (c) showing genomic location (outer circle), log2-fold expression of genes significantly differentially expressed in metastases compared to primary tumors (middle circles), and the log10(p value, inner circle) for genomic amplifications (red) or deletions (blue) in metastases relative to primary tumors. n = 2 (CIN-low), 3 (CIN-high), 11 (primary tumors), 28 (metastases). Significance tested using two-sided Wald test (a), one-sided Weighted Smirnov-Kolmogorov test (b, d, e), and one-sided hypergeometric test (c) all corrected for multiple testing. f–g, DMFS of breast cancer patients stratified by lymph node status, grade, and receptor status, from a meta-analysis (f, n = 664 patients) or a validation cohort (g, n = 171 patients) divided based on their average expression of the CIN gene expression. Significance tested using two-sided log-rank test.
Extended Data Figure 6. Single-cell sequencing and population detection.
a, The cellular composition of every subpopulation presented Figure 4b. b, Violin plots showing expression probability density of key metastasis and invasion genes in a subpopulation of cells (n = 1273 cells) enriched for EMT and CIN genes (subpopulation ‘M’) compared with the remaining subpopulations (n = 5548 cells) that were identified using graph-based unsupervised K-nearest neighbor embedding. c, Representative low-power field images (left) and numbers (right) of MDA-MB-231 cells which invaded through a collagen membrane within 18 hours of culture. Bars represent mean ± SD, Significance tested using two-sided Mann Whitney test, n = 10 high-power fields, 2 independent experiments. d, Representative images of MDA-MB-231 cells expressing MCAK or dnMCAK stained for β-actin, Vimentin, and DNA scale bar 50-μm, n = 2 independent experiments. e, Single-cell correlation plots between CIN signature genes, canonical NF-κB and type I interferon target genes, n = 6,821 cells. e, Representative phase-contrast images of a wound-healing assay of cells MCAK, MCAK+mad2 or dnMCAK expressing MDA-MB-231 cells and MCAK cells treated with cGAMP, scale bar 800-μm, 4 experiments.
Extended Data Figure 7. CIN promotes in vitro invasion and migration.
a, Left, representative phase contrast images of MDA-MB-231 cells in the wound area, 36-hours after wound creation, 4 experiments. Right, length-to-width ratio of cells expressing different kinesin-13 proteins. Bars span the interquartile range, n = 100 cells, 2 independent experiments, significance tested using two-sided Mann Whitney test. b, Representative MDA-MB-231 cells stained for β-catenin (anti-β-catenin antibody) or DNA (DAPI). Changes in β-catenin are seen upon alteration of CIN; enriched at cell-to-cell junctions in MCAK expressing cells but cytoplasmic and nuclear in dnMCAK expressing cells, scale bar 30-μm, 2 experiments. c, Above, Phase-contrast images of a wound-healing assay of cells expressing kinesin-13 proteins, scale bar 800-μm, 2 experiments. Bottom, Wound area (normalized to the 0h time point) 24h and 45h after wound creation, bars represent mean ± SD, n = 4 experiments, significance tested using two-sided t-test. d, Above, Low-power field images of MDA-MB-231 cells that have migrated through a polycarbonate membrane containing 8-μm pores within 18 hours of culture. Below, Normalized O.D. of cells scraped from the bottom of the membrane, bars represent mean ± s.e.m., significance tested using two-sided t-test, n = 3 experiments. e–f, Left, Number of MDA-MB-231 cells that have successfully invaded through a collagen basement membrane 24 hours after plating. Bars represent mean ± SD, n = 20 high power fields from 2 independent experiments, significance tested using two-sided Mann-Whitney test. Right, representative images from high-power fields, 2 independent experiments. g, i, Representative time-lapse fluorescence and phase-contract image sequences of control cells expressing NLS-GFP undergoing unconfined migration (g) or going through 1×5 μm2 constrictions (i). Scale bar 20-μm. Arrows in (g) indicate cytoplasmic NLS-GFP. Arrows in (i) indicate formation of nuclear protrusion and subsequently fragment during confined migration, 3 independent experiments. h, j, The probability of primary nuclear rupture during unconfined conditions (h, top) or after migration through 1×5 μm2 wide constrictions (j, top). The number of cells migrating through more than one 1-μm wide constrictions (j, bottom) and the duration of nuclear rupture (h, bottom) as measured by the length of time in which NLS-GFP signal is observed in the cytosol. Bars represent mean ± s.e.m., n = 3 independent experiments (except for unconfined rupture probability – 2 independent experiments) encompassing 390–665 (h) and 150–336 (j) cells observed during unconfined and confined migration, respectively, significance tested using two-sided t-test.
Extended Data Figure 8. CIN generates micronuclei and cytosolic DNA.
a–b, Percentage of micronuclei in samples depicted in Figure 3c–d: injected cells (blue), first-passage cells derived from primary tumors (green), or metastases (orange denotes spontaneous metastases arising from primary tumors, red denotes metastases obtained from direct intracardiac implantation). Bars represent mean ± s.e.m., n = 10 high-power fields encompassing 500–1500 cells/sample, 3 independent experiments, * p < 0.05 and denotes samples with higher missegregation rates than the injected lines, # p < 0.05 and denotes samples with lower missegregation rates than the injected lines, ** p < 0.05 and it denotes significant differences between metastases and matched primary tumors from the same animals, two-tailed t-test. c, Correlation between the percentage of cells exhibiting evidence of chromosome missegregation and percentage of micronuclei in all injected cell lines as well as cells derived from primary tumors and metastases. Data points represent mean ± s.e.m., n = 44 samples. d–f, Representative images of cells stained for DNA (DAPI), cytosolic single-stranded DNA (ssDNA) (d), Dnase2 (RFP reporter) (e), or cytosolic double-stranded DNA (dsDNA) (f), scale bar 20-μm, arrows in e denote Dnase2 expressing cell, 2 independent experiments. g, Representative images of dnMCAK expressing cells treated with ssDnase or dsDnase for 10 min. after selective plasma membrane permeabilization (using 0.02% saponin) stained for DNA (DAPI) and cytosolic dsDNA, scale bar 20-μm, one experiment. h, Representative images of dnMCAK expressing cells stained for mitochondria (using anti-CoxIV antibody), DNA (DAPI) or for cytosolic DNA (using anti-dsDNA antibody), scale bar 20-μm, 2 independent experiments. i, Immunoblots of lysates from cells expressing different kinesin-13 proteins, control or STING shRNA, β-actin used as a loading control. j, Normalized ratio of phosphorylated p52-to-p100 (left) and p100-to-total p100 (right) protein levels. Bars represent mean ± s.e.m., n = 5 independent experiments.
Extended Data Figure 9. Alternative response to cytosolic DNA in cancer cells.
a–d, Representative images of MDA-MB-231 cells stained for DNA (DAPI), and for p65 (a), IRF3 (b), or RelB (c–d). Images were individually contrast-enhanced to emphasize nuclear versus cytosolic localization of p65, IRF3, and RelB. For quantitative comparisons of the identical images, please refer to Supplementary Figure 3. Arrows (c–d) point to RelB-positive nuclei, scale bars, 20-μm, 3 independent experiments. e, Immunoblots of fractionated lysates. a-tubulin and Lamin B2 were used as loading controls for the cytoplasmic and nuclear fractions, respectively, 3 independent experiments. f, h, Interferon-β levels in conditioned media from DLD-1 cells (f) MDA-MB-231 or HEK293 cells with and without cGAMP addition (h). Bars represent mean ± s.e.m. n = 3 experiments, significance tested using one-sided Mann-Whitney test. g, i, Relative levels of interferon responsive genes obtained by RT-qPCR, DLD-1 cells (g) normalized to untreated conditions or MDA-MB-231 cells (i) normalized to control cells. Bars represent mean ± SD n = 3 experiments, significance tested using 2-sided t-test. j, Immunoblots of lysates of dnMCAK expressing cells that also co-express control shRNA or shRNAs targeting components of cytosolic DNA sensing or the noncanonical NF-κB pathway. shRNA hairpins are numbered in ascending order based on the efficiency of the protein knockdown, 2 independent experiments.
Extended Data Figure 10. Effect of cytosolic DNA sensing pathways on prognosis.
a, Distant metastasis-free survival (DMFS), Relapse-free survival (RFS) and Progression-free survival (PFS) of breast and lung cancer patients, respectively stratified based on their expression of NF-κB and interferon pathways, significance tested using two-sided log-rank test. b, Disease-specific survival of mice injected with dnMCAK expressing MDA-MB-231 cells co-expressing either control shRNA, STING shRNA, NFKB2 shRNA, or RelB shRNA n = 35, 16, 19, and 20 mice in the control, STING shRNA, NFKB2 shRNA, and RelB shRNA groups respectively, significance tested using two-sided log-rank test. c, Number of MDA-MB-231 cells expressing shRNA targeting genes belonging to the DNA sensing or noncanonical NF-κB pathways that invaded through a collagen membrane within 24 hours of culture. Bars represent mean ± SD, ** p < 0.0001, two-sided Mann Whitney test, n = 20 high-power fields, 2 independent experiments. d, Number of different normal tissues (vascular, neuronal, or soft tissues) invaded by orthotopically transplanted tumors. Bars represent mean ± s.e.m., *p < 0.05, two-tailed t-test, n = 13 tumors (CIN-high), 20 tumors (noncanonical NF-κB depleted), 19 tumors (cGAS-STING depleted). e, Oncoprints showing genomic alterations in STING (TMEM173) and cGAS (MB21D1) in breast and lung cancers from the TCGA database.
Supplementary Material
1
Acknowledgments
We thank Joan Massagué, Robert Benezra, Xin Cai, Jonathan Leeman, Mathieu Bakhoum, Benjamin Hopkins, and Dan Landau for critical feedback. Grant support: SFB (DoD Breast Cancer Research Breakthrough Award (BCRBA) W81XWH-16-1-0315, Elsa Pardee Foundation, MSKCC Cytogenetics Core (P30-CA008748) and core (P30-CA008748) grants, BN (NSF Graduate Research Fellowship DGE1257284), JL (NIH R01-HL082792, U54-CA210184, DoD BCRBA BC150580, NSF CBET-1254846), PL (NCI K99-CA218871), LCC (NIH R35-CA197588, U54-CA210184, Breast Cancer Research Foundation, Gray Foundation Basser Initiative).
Footnotes
Supplementary information is available in the online version of this paper.
Author Contributions SFB and LCC conceived of the project, SFB, BN, JACF, RKS performed animal experiments, VKR derived PDX models, PL performed experiments using DLD-1 cells, SFB, BN, JAC, RKS, MD, SV, QL performed immunostaining, immunoblotting, microscopy, qPCR, PS performed live-cell imaging, TBKW, NJB, NM analyzed matched primary tumors-metastases data, NKT, CHC, SFB performed data analysis of the HNSCC data, SFB analyzed breast cancer karyotype data, CP performed histological analysis, CS, KC, GN performed cytogenetic analysis, AML analyzed scRNSseq data, ML, SFB analyzed survival data, CJM analyzed bulk RNAseq data, MI analyzed whole-genome sequence data, GG, ML, QL, JH, OE, CHC, NYL, DP, DWC, SNP, JL, CS, LCC assisted with data interpretation. All authors contributed to the writing and editing of the manuscript.
L.C.C. owns equity in, receives compensation from, and serves on the board of directors and scientific advisory board of Agios Pharmaceuticals. He is also a founder of and receives laboratory support from Petra Pharmaceuticals.
References
- 1.Jamal-Hanjani M, et al. Tracking the Evolution of Non-Small-Cell Lung Cancer. N Engl J Med. 2017;376:2109–2121. doi: 10.1056/NEJMoa1616288. [DOI] [PubMed] [Google Scholar]
- 2.Turajlic S, Swanton C. Metastasis as an evolutionary process. Science. 2016;352:169–175. doi: 10.1126/science.aaf2784. [DOI] [PubMed] [Google Scholar]
- 3.Thompson SL, Compton DA. Examining the link between chromosomal instability and aneuploidy in human cells. J Cell Biol. 2008;180:665–672. doi: 10.1083/jcb.200712029. [DOI] [PMC free article] [PubMed] [Google Scholar]
- 4.Cimini D, et al. Merotelic kinetochore orientation is a major mechanism of aneuploidy in mitotic mammalian tissue cells. J Cell Biol. 2001;153:517–527. doi: 10.1083/jcb.153.3.517. [DOI] [PMC free article] [PubMed] [Google Scholar]
- 5.Bakhoum SF, et al. The mitotic origin of chromosomal instability. Curr Biol. 2014;24:R148–9. doi: 10.1016/j.cub.2014.01.019. [DOI] [PMC free article] [PubMed] [Google Scholar]
- 6.Bakhoum SF, et al. Numerical chromosomal instability mediates susceptibility to radiation treatment. Nat Commun. 2015;6:5990. doi: 10.1038/ncomms6990. [DOI] [PMC free article] [PubMed] [Google Scholar]
- 7.Bakhoum SF, Thompson SL, Manning AL, Compton DA. Genome stability is ensured by temporal control of kinetochore-microtubule dynamics. Nat Cell Biol. 2009;11:27–35. doi: 10.1038/ncb1809. [DOI] [PMC free article] [PubMed] [Google Scholar]
- 8.Burrell RA, et al. Replication stress links structural and numerical cancer chromosomal instability. Nature. 2013;494:492–496. doi: 10.1038/nature11935. [DOI] [PMC free article] [PubMed] [Google Scholar]
- 9.Brastianos PK, et al. Genomic Characterization of Brain Metastases Reveals Branched Evolution and Potential Therapeutic Targets. Cancer Discovery. 2015;5:1164–1177. doi: 10.1158/2159-8290.CD-15-0369. [DOI] [PMC free article] [PubMed] [Google Scholar]
- 10.Mitelman F, Johansson B, Mertens F. Mitelman Database of Chromosome Aberrations and Gene Fusions in Cancer. [Accessed: 24 October 2014];cgapncinihgov. Available at: http://cgap.nci.nih.gov/Chromosomes/Mitelman.
- 11.Chung CH, et al. Molecular classification of head and neck squamous cell carcinomas using patterns of gene expression. Cancer Cell. 2004;5:489–500. doi: 10.1016/s1535-6108(04)00112-6. [DOI] [PubMed] [Google Scholar]
- 12.Moore AT, et al. MCAK associates with the tips of polymerizing microtubules. J Cell Biol. 2005;169:391–397. doi: 10.1083/jcb.200411089. [DOI] [PMC free article] [PubMed] [Google Scholar]
- 13.Ems-McClung SC, Walczak CE. Kinesin-13s in mitosis: Key players in the spatial and temporal organization of spindle microtubules. Semin Cell Dev Biol. 2010;21:276–282. doi: 10.1016/j.semcdb.2010.01.016. [DOI] [PMC free article] [PubMed] [Google Scholar]
- 14.Waterman-Storer CM, Worthylake RA, Liu BP, Burridge K, Salmon ED. Microtubule growth activates Rac1 to promote lamellipodial protrusion in fibroblasts. Nat Cell Biol. 1999;1:45–50. doi: 10.1038/9018. [DOI] [PubMed] [Google Scholar]
- 15.Sotillo R, et al. Mad2 overexpression promotes aneuploidy and tumorigenesis in mice. Cancer Cell. 2007;11:9–23. doi: 10.1016/j.ccr.2006.10.019. [DOI] [PMC free article] [PubMed] [Google Scholar]
- 16.Györffy B, et al. An online survival analysis tool to rapidly assess the effect of 22,277 genes on breast cancer prognosis using microarray data of 1,809 patients. Breast Cancer Res Treat. 2010;123:725–731. doi: 10.1007/s10549-009-0674-9. [DOI] [PubMed] [Google Scholar]
- 17.Hatzis C, et al. A genomic predictor of response and survival following taxane-anthracycline chemotherapy for invasive breast cancer. JAMA. 2011;305:1873–1881. doi: 10.1001/jama.2011.593. [DOI] [PMC free article] [PubMed] [Google Scholar]
- 18.Abe T, Barber GN. Cytosolic-DNA-mediated, STING-dependent proinflammatory gene induction necessitates canonical NF-κB activation through TBK1. J Virol. 2014;88:5328–5341. doi: 10.1128/JVI.00037-14. [DOI] [PMC free article] [PubMed] [Google Scholar]
- 19.Sun L, et al. Cyclic GMP-AMP synthase is a cytosolic DNA sensor that activates the type I interferon pathway. Science. 2013;339:786–791. doi: 10.1126/science.1232458. [DOI] [PMC free article] [PubMed] [Google Scholar]
- 20.Hatch EM, Fischer AH, Deerinck TJ, Hetzer MW. Catastrophic nuclear envelope collapse in cancer cell micronuclei. Cell. 2013;154:47–60. doi: 10.1016/j.cell.2013.06.007. [DOI] [PMC free article] [PubMed] [Google Scholar]
- 21.Ahn J, et al. Inflammation-driven carcinogenesisis mediated through STING. Nat Commun. 1AD;5:1–9. doi: 10.1038/ncomms6166. [DOI] [PMC free article] [PubMed] [Google Scholar]
- 22.Harding SM, et al. Mitotic progression following DNA damage enables pattern recognition within micronuclei. Nature. 2017 doi: 10.1038/nature23470. [DOI] [PMC free article] [PubMed] [Google Scholar]
- 23.Mackenzie KJ, et al. cGAS surveillance of micronuclei links genome instability to innate immunity. Nature. 2017 doi: 10.1038/nature23449. [DOI] [PMC free article] [PubMed] [Google Scholar]
- 24.Lan YY, Londoño D, Bouley R, Rooney MS, Hacohen N. Dnase2a deficiency uncovers lysosomal clearance of damaged nuclear DNA via autophagy. Cell Rep. 2014;9:180–192. doi: 10.1016/j.celrep.2014.08.074. [DOI] [PMC free article] [PubMed] [Google Scholar]
- 25.Denais CM, et al. Nuclear envelope rupture and repair during cancer cell migration. Science. 2016;352:353–358. doi: 10.1126/science.aad7297. [DOI] [PMC free article] [PubMed] [Google Scholar]
- 26.Ly P, et al. Selective Y centromere inactivation triggers chromosome shattering in micronuclei and repair by non-homologous end joining. Nat Cell Biol. 2017;19:68–75. doi: 10.1038/ncb3450. [DOI] [PMC free article] [PubMed] [Google Scholar]
- 27.Yang H, Wang H, Ren J, Chen Q, Chen ZJ. cGAS is essential for cellular senescence. Proc Natl Acad Sci USA. 2017;114:E4612–E4620. doi: 10.1073/pnas.1705499114. [DOI] [PMC free article] [PubMed] [Google Scholar]
- 28.Stetson DB, Ko JS, Heidmann T, Medzhitov R. Trex1 Prevents Cell-Intrinsic Initiation of Autoimmunity. Cell. 2008;134:587–598. doi: 10.1016/j.cell.2008.06.032. [DOI] [PMC free article] [PubMed] [Google Scholar]
- 29.Lau L, Gray EE, Brunette RL, Stetson DB. DNA tumor virus oncogenes antagonize the cGAS-STING DNA-sensing pathway. Science. 2015;350:568–571. doi: 10.1126/science.aab3291. [DOI] [PubMed] [Google Scholar]
- 30.Dou Z, et al. Cytoplasmic chromatin triggers inflammation in senescence and cancer. Nature. 2017;550:402–406. doi: 10.1038/nature24050. [DOI] [PMC free article] [PubMed] [Google Scholar]
- 31.Sun S-C. Controlling the fate of NIK: a central stage in noncanonical NF-kappaB signaling. Sci Signal. 2010;3:pe18. doi: 10.1126/scisignal.3123pe18. [DOI] [PMC free article] [PubMed] [Google Scholar]
- 32.Chen Q, et al. Carcinoma-astrocyte gap junctions promote brain metastasis by cGAMP transfer. Nature. 2016;533:493–498. doi: 10.1038/nature18268. [DOI] [PMC free article] [PubMed] [Google Scholar]
- 33.Wang X, et al. Oestrogen signalling inhibits invasive phenotype by repressing RelB and its target BCL2. Nat Cell Biol. 2007;9:470–478. doi: 10.1038/ncb1559. [DOI] [PMC free article] [PubMed] [Google Scholar]
- 34.Wang J, Yi S, Zhou J, Zhang Y, Guo F. The NF-κB subunit RelB regulates the migration and invasion abilities and the radio-sensitivity of prostate cancer cells. Int J Oncol. 2016;49:381–392. doi: 10.3892/ijo.2016.3500. [DOI] [PubMed] [Google Scholar]
- 35.Yang C, et al. Antagonism of inhibitor of apoptosis proteins increases bone metastasis via unexpected osteoclast activation. Cancer Discovery. 2013;3:212–223. doi: 10.1158/2159-8290.CD-12-0271. [DOI] [PMC free article] [PubMed] [Google Scholar]
- 36.Gulen MF, et al. Signalling strength determines proapoptotic functions of STING. Nat Commun. 2017;8:427. doi: 10.1038/s41467-017-00573-w. [DOI] [PMC free article] [PubMed] [Google Scholar]
- 37.Kis-Toth K, Szanto A, Thai TH, Tsokos GC. Cytosolic DNA-activated human dendritic cells are potent activators of the adaptive immune response. J Immunol. 2011;187:1222–1234. doi: 10.4049/jimmunol.1100469. [DOI] [PMC free article] [PubMed] [Google Scholar]
- 38.Sheltzer JM, et al. Single-chromosome Gains Commonly Function as Tumor Suppressors. Cancer Cell. 2017;31:240–255. doi: 10.1016/j.ccell.2016.12.004. [DOI] [PMC free article] [PubMed] [Google Scholar]
- 39.Weaver BAA, Silk AD, Montagna C, Verdier-Pinard P, Cleveland DW. Aneuploidy acts both oncogenically and as a tumor suppressor. Cancer Cell. 2007;11:25–36. doi: 10.1016/j.ccr.2006.12.003. [DOI] [PubMed] [Google Scholar]
- 40.Rowald K, et al. Negative Selection and Chromosome Instability Induced by Mad2 Overexpression Delay Breast Cancer but Facilitate Oncogene-Independent Outgrowth. Cell Rep. 2016 doi: 10.1016/j.celrep.2016.05.048. [DOI] [PMC free article] [PubMed]
- 41.Robinson DR, et al. Integrative clinical genomics of metastatic cancer. Nature. 2017 doi: 10.1038/nature23306. [DOI] [PMC free article] [PubMed] [Google Scholar]
- 42.Sheltzer JM. A transcriptional and metabolic signature of primary aneuploidy is present in chromosomally unstable cancer cells and informs clinical prognosis. Cancer Res. 2013;73:6401–6412. doi: 10.1158/0008-5472.CAN-13-0749. [DOI] [PMC free article] [PubMed] [Google Scholar]
- 43.McGranahan N, et al. Clonal neoantigens elicit T cell immunoreactivity and sensitivity to immune checkpoint blockade. Science. 2016;351:1463–1469. doi: 10.1126/science.aaf1490. [DOI] [PMC free article] [PubMed] [Google Scholar]
- 44.Bakhoum SF, Danilova OV, Kaur P, Levy NB, Compton DA. Chromosomal instability substantiates poor prognosis in patients with diffuse large B-cell lymphoma. Clin Cancer Res. 2011;17:7704–7711. doi: 10.1158/1078-0432.CCR-11-2049. [DOI] [PMC free article] [PubMed] [Google Scholar]
- 45.Zaki BI, Suriawinata AA, Eastman AR, Garner KM, Bakhoum SF. Chromosomal instability portends superior response of rectal adenocarcinoma to chemoradiation therapy. Cancer. 2014;120:1733–1742. doi: 10.1002/cncr.28656. [DOI] [PubMed] [Google Scholar]
- 46.Davidson PM, Denais C, Bakshi MC, Lammerding J. Nuclear deformability constitutes a rate-limiting step during cell migration in 3-D environments. Cell Mol Bioeng. 2014;7:293–306. doi: 10.1007/s12195-014-0342-y. [DOI] [PMC free article] [PubMed] [Google Scholar]
- 47.Conway T, et al. Xenome--a tool for classifying reads from xenograft samples. Bioinformatics. 2012;28:i172–8. doi: 10.1093/bioinformatics/bts236. [DOI] [PMC free article] [PubMed] [Google Scholar]
- 48.Dobin A, et al. STAR: ultrafast universal RNA-seq aligner. Bioinformatics. 2013;29:15–21. doi: 10.1093/bioinformatics/bts635. [DOI] [PMC free article] [PubMed] [Google Scholar]
- 49.Trapnell C, et al. Transcript assembly and quantification by RNA-Seq reveals unannotated transcripts and isoform switching during cell differentiation. Nat Biotechnol. 2010;28:511–515. doi: 10.1038/nbt.1621. [DOI] [PMC free article] [PubMed] [Google Scholar]
- 50.Anders S, Pyl PT, Huber W. HTSeq--a Python framework to work with high-throughput sequencing data. Bioinformatics. 2015;31:166–169. doi: 10.1093/bioinformatics/btu638. [DOI] [PMC free article] [PubMed] [Google Scholar]
- 51.Love MI, Huber W, Anders S. Moderated estimation of fold change and dispersion for RNA-seq data with DESeq2. Genome Biol. 2014;15:550. doi: 10.1186/s13059-014-0550-8. [DOI] [PMC free article] [PubMed] [Google Scholar]
- 52.Subramanian A, et al. Gene set enrichment analysis: a knowledge-based approach for interpreting genome-wide expression profiles. Proc Natl Acad Sci USA. 2005;102:15545–15550. doi: 10.1073/pnas.0506580102. [DOI] [PMC free article] [PubMed] [Google Scholar]
- 53.De Preter K, Barriot R, Speleman F, Vandesompele J, Moreau Y. Positional gene enrichment analysis of gene sets for high-resolution identification of overrepresented chromosomal regions. Nucleic Acids Research. 2008;36:e43. doi: 10.1093/nar/gkn114. [DOI] [PMC free article] [PubMed] [Google Scholar]
- 54.Gu Z, Gu L, Eils R, Schlesner M, Brors B. circlize Implements and enhances circular visualization in R. Bioinformatics. 2014;30:2811–2812. doi: 10.1093/bioinformatics/btu393. [DOI] [PubMed] [Google Scholar]
- 55.Zheng GXY, et al. Massively parallel digital transcriptional profiling of single cells. Nat Commun. 2017;8:14049. doi: 10.1038/ncomms14049. [DOI] [PMC free article] [PubMed] [Google Scholar]
- 56.van Dijk D, Nainys J, Sharma R, Kathail P, Carr AJ. MAGIC: A diffusion-based imputation method reveals gene-gene interactions in single-cell RNA-sequencing data. 2017 BioRxiv. [Google Scholar]
- 57.Levine JH, et al. Data-Driven Phenotypic Dissection of AML Reveals Progenitor-like Cells that Correlate with Prognosis. Cell. 2015;162:184–197. doi: 10.1016/j.cell.2015.05.047. [DOI] [PMC free article] [PubMed] [Google Scholar]
- 58.Györffy B, Surowiak P, Budczies J, Lanczky A. Online survival analysis software to assess the prognostic value of biomarkers using transcriptomic data in non-small-cell lung cancer. PLoS ONE. 2013;8:e82241. doi: 10.1371/journal.pone.0082241. [DOI] [PMC free article] [PubMed] [Google Scholar]
- 59.Di Tommaso P, et al. Nextflow enables reproducible computational workflows. Nat Biotechnol. 2017;35:316–319. doi: 10.1038/nbt.3820. [DOI] [PubMed] [Google Scholar]
Associated Data
This section collects any data citations, data availability statements, or supplementary materials included in this article.
Supplementary Materials
1
Data Availability Statement
Source data for figures 1–3, 5–6, and Extended Data figures 1–3 and 5–10 are provided with the paper. Single-cell RNA sequencing data (shown in figures 4–5 and Extended Data figure 6) was deposited in the Sequence Read Archive under the following accession number: SRP104750 (ftp://ftp-trace.ncbi.nlm.nih.gov/sra/review/SRP104750_20170426_131604_b0888d686e89bf883fe90b85c9220b47). Bulk RNAseq data (shown in Extended Data figures 4–5) was deposited in Gene Expression Omnibus under accession number GSE98183 (https://www.ncbi.nlm.nih.gov/geo/query/acc.cgi?acc=GSE98183)
