Saffron and crocin improved appetite, dietary intakes and body composition in patients with coronary artery disease (original) (raw)
Abstract
Introduction: Central obesity is an independent risk factor for coronary artery disease (CAD). It can increase cardio-metabolic risks through hypertension, hyperlipidemia and insulin resistance. Saffron and its bioactive compounds (crocin and crocetin) can modify some of metabolic disorders through multiple mechanisms. The aim of this study was to assess the efficacy of saffron and crocin on lipid profile, appetite, dietary intakes, anthropometric indices and body composition in patients with CAD.
Methods: This 8 weeks randomized, double-blind, and placebo-controlled trial was conducted on 84 patients with CAD between the ages of 40 and 65 years old. Participants were randomly divided into groups to receive a daily supplement of 30 mg saffron aqueous extract (SAE) or 30 mg crocin or placebo. Appetite, dietary intake, anthropometry, body composition, biochemical analysis were assessed before and after the study.
Results: In SAE and crocin group, anthropometric and some body composition variables revealed a pattern of improvement after intervention. Decrease in body mass index (BMI), waist circumference and fat mass values in SAE group was significantly more than crocin group (P < 0.001). There was no significant difference at the end of study in lipid profile parameters. Both SAE and crocin yielded significant decrease in energy and dietary intake mean values (P < 0.001 and P = 0.046), while it remained unchanged in the placebo group, also the appetite decreased significantly in SAE and crocin group (P < 0.001 and P = 0.029, respectively).
Conclusion: The results of present study regarding anti-obesity feature of SAE and crocin in patients with CAD was promising. However the SAE was better in appetite suppressing, dietary intake and central obesity reduction.
Keywords: Appetite, Coronary Artery Disease, Crocin, Fat Mass, Saffron, Waist Circumference
Introduction
Coronary artery disease (CAD) is one of the most important causes of death in the developed world.1 Also it is common health problem among adult Iranian.2 Recently the prevalence of risk factors associated with CAD such as adherence to poor nutritional behaviors, low physical activity and epidemic of obesity is high in developing countries and also in Iran.2,3 Although the obesity especially abdominal form can increase cardio-metabolic risks through hypertension, type 2 diabetes, hyperlipidemia, insulin resistance and left ventricular hypertrophy4-6 it is known as an independent risk factor for CAD according to some investigations. Adipose tissue and adipocytes are recognized as a source which secret several substances with biological activity, known as “adipokines”.7,8 They seem involved in the regulation of many physiological processes, such as appetite regulation, energy balance, lipid metabolism, blood pressure, insulin sensitivity and inflammation.9
Obesity is considered as an illness and overweight causes wide range of diseases.10 The global rate of overweight and obesity is increasing.11 In line with the global trend, this problem involved Asian countries, especially Iran. The prevalence of overweight among Iranian by the World Health Organization (WHO) reports was over 50% which expected to raise this prevalence during the period of 2005-2015.12
There are multiple approaches and strategies to deal with obesity including lifestyle modifications (adherence to healthy diet, weight loss and increasing physical activity), pharmacotherapy and surgery as a last resort.13 Almost all anti-obesity drugs adversely affected cardio-vascular function and also have other side effects, so the compliance of these drugs are low.14 The usage of plant based supplements for appetite control and increasing resting metabolism is common among obese subjects. They believe these supplements are foods, natural and safe, rather than medicines.15
Saffron (Crocus sativus Linn) has been used as an important dietary ingredient in different parts of the world since ancient times. It has also been applied in traditional medicine in the treatment of various kinds of illnesses including inflammatory and neurodegenerative disorders.16 The pharmacological activities of saffron are attributed to many of its active constituents such as volatile agents (e.g., safranal), bitter principles (e.g., picrocrocin), and dye materials (e.g., crocetin and crocins). The crocin is unique water-soluble carotenoid (cis and trans glucosyl ester of crocetin).16 Saffron and its main constituent; crocin have been shown to possess antidiabetic,17 antihyperlipidemic18 and hypotensive19 activities, on the other hand, some evidences indicated that saffron can enhance satiety and promote weight loss.18,20,21 So saffron and its bioactive compounds can modulate some metabolic disorders through multiple mechanisms.
The present randomized clinical trial was designed to assess the efficacy of saffron and its main carotenoid, crocin on lipid profile, appetite level, dietary intakes, anthropometric indices and body composition in patients with coronary artery disease.
Methods and Materials
Study population
Eighty-four outpatients with CAD recruited from the heart clinic of Shahid Madani Cardiovascular hospital in Tabriz, Iran. CAD (more than 50% stenosis) was documented by angiography. In designing of the study, we considered a confidence interval 95% and power of 90% with a two-sided test with α = 0.05 (type I error) and mean and standard deviation (SD) difference for body weight change in Gout et al.20 The number of subjects was 25 per group. Given an anticipated dropout rate of 10%, we set the enrollment target at 28 subjects. Included subjects were male and females aged 40–65 years. All patients took their usual medication related to their cardio-metabolic disorder (hypertension, hyperlipidemia etc) without any alteration until the end of the study. Hypertension was defined as systolic and/or diastolic blood pressure (DBP) ≥150/90 mm Hg or receiving anti-hypertensive medications. Inclusion criteria included the following: no history of any autoimmune disease, malignancy, insulin therapy, no pregnancy or nursing, no allergy to saffron products, no following diet therapy during last one year, no usage of agents which modulate appetite, weight loss or antidepressant pills in chemical or herbal form and no psychotherapy. Patients with heart attack or surgery were excluded from the study. All participants signed a written informed consent agreement.
Treatment capsules
Saffron aqueous extract (SAE) was prepared by maceration method22 and crocin was extracted and purified by chromatography described in our previous report.23 Saffron stigmas were purchased from Ghaenat farmlands in Khorasan, Iran. In order to maintain the blind, identical capsules in same shape, weight, and color were filled with 30 mg of SAE/crocin plus vehicle (corn starch). Placebo capsules were also filled with the same vehicle.
Study design
This randomized double-blind, placebo-controlled clinical trial conducted between January 2016 and November 2016. Capsules were administered by a blinded clinical researcher to blinded patients. Subjects were asked to take one capsule containing SAE, crocin or placebo after lunch with sufficient water for eight weeks. Two visits were conducted: one prior to the study to collect baseline data and then one at the end of week 8 to complete questionnaires for food records, appetite, anthropometry, body composition and lipid profile measurements. Participants were asked not to change their usual dietary intake and physical activity during the study. Compliance with treatment was assessed by capsules counts. For this, all participants returned their container at the end of the each 4-week interval.
Dietary intake and appetite assessment
Dietary intakes were assessed by using food records completed for 3 days (2 week day and 1 weekend day) a week before intervention as well as at the end of study. Energy and macronutrient compositions were analyzed using the Nutritionist IV for Windows software program (The Hearst Corporation, San Bruno, CA).
Participant’s appetite level prior to lunch was assessed before and at the end of the intervention, by means of visual analog scales (VASs). Scoring was made on a 100-mm marked line between “no appetite” at one end and “uncontrollable appetite” at the other, with low, average, high, and very high points in between.
Anthropometric measurements and body composition
Height was measured to the nearest 0.5 cm using a wall-mounted Stadiometer in standing position without shoes. Weight and body composition including body fat mass (FM), fat free mass (FFM), and the percentage of FM were measured using body composition analyzer (Tanita BC-418, Tanita Corporation of America, Inc.). Body mass index (BMI) was calculated as body weight (kg) divided by the square of height (m2). Waist and hip circumference were measured to the nearest 0.1 cm in duplicate to the nearest millimeter using a spring-loaded tape measure.
Dietary intake, appetite assessment, anthropometric and body composition measurements were obtained twice, before and after intervention.
Biochemical analysis
After an overnight fasting period (10-12 hours), blood samples were obtained at baseline and at week 8 of the intervention. Plasma concentrations of glucose, triglyceride (TG), total cholesterol (TC), high-density lipoprotein cholesterol (HDL-C), low-density lipoprotein cholesterol (LDL-C) were measured by a colorimetric method using Pars Azmoon kits (Pars azmoon.co, Tehran, Iran) with an auto-analyzer (Hitachi, Japan).
Statistical analysis
Statistical analysis was performed using SPSS software version 17.0 (SPSS Co., Chicago, IL, USA). The baseline characteristics between groups were compared using Fisher exact test. Analysis of variance (ANOVA) and Tukey test was used to compare baseline values, respectively for homogenous and heterogeneous groups according to their variances. A paired t test was used for comparison the mean differences (95% CI) within group. Analysis of covariance (ANCOVA) was used to test the difference between study groups after intervention, adjusting for baseline measurements, age and sex. In all analysis, P < 0.05 was considered as statistically significant.
Results
Participants
Eligible subjects (n = 84) were randomly assigned by using a computer-generated random numbers method by the statistical analyst to three study groups. Of these, 75 (about 89%) completed the entire period of study (Figure 1). About 80% of participants had moderate physical activity. Demographic and baseline clinical characteristics of participants addressed in Table 1.
Figure 1.
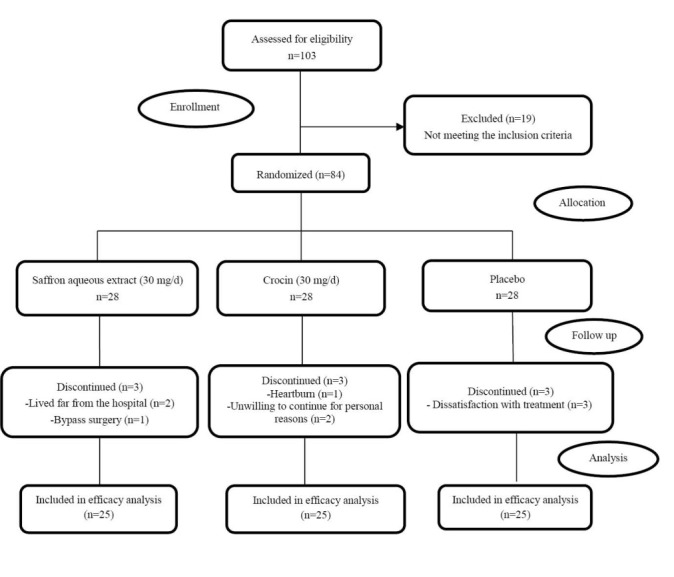
Flowchart of the trial.
Table 1. Demographic and baseline clinical characteristics of participants (n = 75) .
| Variables a | SAE (n=25) | Crocin (n=25) | Placebo (n=25) | P value # |
|---|---|---|---|---|
| Age, y | 56.04±7.55 | 53.36±5.94 | 56.32±5.91 | 0.214 |
| Sex, male | 14 (56%) | 13 (52%) | 12 (48%) | 0.957 |
| CAD family history | 13 (52%) | 11 (44%) | 9 (36%) | 0.569 |
| Smoking | 1 (4%) | 5 (20%) | 5 (20%) | 0.059 |
| Hypertension | 14 (56%) | 18 (72%) | 14 (56%) | 0.441 |
| Diabetes mellitus | 3 (12%) | 5 (20%) | 5 (20%) | 0.799 |
| Hypoglycemic drugs | 3 (12%) | 5 (20%) | 5 (20%) | 0.799 |
| Antihypertensive drugs | 18 (72%) | 18 (72%) | 14 (56%) | 0.420 |
| Hypolipidemic drugs | 16 (64%) | 14 (56%) | 16 (64%) | 0.872 |
Table 2 summarizes pre and post-intervention changes in the anthropometric and body composition variables. In SAE and crocin group all variables revealed a pattern of improvement after intervention. However FFM remained unchanged in crocin group (P = 0.582). Between-group comparison showed the baseline mean values were same in all variables of Table 2, but after intervention, there was significant difference between study groups (P<0.001 or P = 0.001). After adjustment for age and sex the same results were obtained. Weight loss was significantly higher in SAE group in comparison to crocin group (MD= -1.37, CI: -2.173 to -0.571, P < 0.001). Also, decrease in BMI, waist circumference, fat mass and fat free mass mean values in SAE group was significantly more than crocin group (P < 0.001, 0.001, 0.016 and P < 0.001, respectively).
Table 2. Anthropometric and body composition measurements in study groups .
| Variables | SAE (n=25) | Crocin (n=25) | Placebo (n=25) | P | P # |
|---|---|---|---|---|---|
| Body weight, kg | |||||
| Baseline | 83.60±12.66 | 79.68±10.30 | 78.20±10.78 | 0.224 a | |
| Week 8 | 81.29±12.66 | 78.79±10.30 | 78.24±10.49 | <0.001b | <0.001 |
| Within group MD (95% CI)P value c | -2.31(-2.88 to -1.74)<0.001 | -0.89(-1.33 to -0.45)<0.001 | 0.04(-0.34 to 0.43)0.818 | ||
| BMI, kg/m2 | |||||
| Baseline | 28.64±2.23 | 27.92±2.57 | 28.05±2.89 | 0.576 a | |
| Week 8 | 27.84±2.32 | 27.62±2.53 | 28.08±2.88 | <0.001b | <0.001 |
| Within group MD (95% CI)P value c | -0.79(-0.98 to -0.61)<0.001 | -0.29(-0.45 to -0.14)0.001 | 0.03(-0.11 to 0.16)0.674 | ||
| Waist, cm | |||||
| Baseline | 95.00±12.85 | 92.84±9.13 | 91.84±10.73 | 0.642 a | |
| Week 8 | 92.68±13.03 | 91.42±8.94 | 92.13±10.88 | <0.001b | <0.001 |
| Within group MD (95% CI)P value c | -2.32( -2.76 to -1.88)<0.001 | -1.42(-1.83 to -1.01)<0.001 | 0.29(-1.18 to 1.76)0.686 | ||
| WHR | |||||
| Baseline | 0.92±0.07 | 0.90±0.06 | 0.92±0.05 | 0.501a | |
| Week 8 | 0.90±0.07 | 0.89±0.06 | 0.91±0.04 | 0.001b | 0.002 |
| Within group MD (95% CI)P value c | -0.01(-0.02 to -0.01)<0.001 | -0.01(-0.02 to -0.01)<0.001 | -0.003(-0.007 to 0.001)0.175 | ||
| FM, kg | |||||
| Baseline | 26.61±4.23 | 25.78±7.39 | 25.26±5.52 | 0.715 a | |
| Week 8 | 25.06±4.42 | 24.96±7.40 | 25.23±5.63 | <0.001b | <0.001 |
| Within group MD (95% CI)P value c | -1.55(-1.99 to -1.11)<0.001 | -0.82(-1.22 to -0.43)<0.001 | -0.03(-0.27 to 0.20)0.768 | ||
| Fat % | |||||
| Baseline | 32.16±4.83 | 32.29±7.60 | 32.38±6.14 | 0.992a | |
| Week 8 | 31.14±5.05 | 31.58±7.66 | 32.31±6.14 | <0.001b | <0.001 |
| Within group MD (95% CI)P value c | -1.02(-1.38 to -0.65)<0.001 | -0.71(-1.06 to -0.36)<0.001 | -0.07(-0.23 to 0.08)0.341 | ||
| FFM, kg | |||||
| Baseline | 56.99±10.98 | 53.89±8.99 | 52.94±9.25 | 0.316a | |
| Week 8 | 56.23±10.97 | 53.83±8.87 | 53.01±9.07 | <0.001b | <0.001 |
| Within group MD (95% CI)P value c | -0.76 (-1.03 to -0.49)<0.001 | -0.07(-0.31 to 0.18)0.582 | 0.08(-0.10 to 0.25)0.373 |
According to Table 3, the biochemical variables were similar among the study groups at baseline. Intervention did not affect these variables significantly. Between groups comparison revealed that there was no significant difference at the end of study. But after adjustment for age and sex, LDL to HDL ratio was significantly different among study groups (P = 0.040). Decrease in mentioned ratio between SAE and placebo group was significant according to Sidak test (MD= -0.391, CI: -0.691 to -0.091, P = 0.012).
Table 3. Fasting blood glucose and lipid profiles in study groups .
| Variable | SAE (n=25) | Crocin (n=25) | Placebo (n=25) | P value | P value # |
|---|---|---|---|---|---|
| FBS (mg/dL) | |||||
| Baseline | 107.25±44.14 | 123.11±59.31 | 100.05±25.74 | 0.189 a | |
| Week 8 | 100.85±26.49 | 117.63±56.48 | 98.26±23.72 | 0.726b | 0.614 |
| Within group MD (95% CI)P value c | -6.40(-17.35 to 4.55)0.236 | -5.47(-23.81 to 12.86)0.538 | -1.79(-0.54 to 0.00)0.052 | ||
| Triglycerides (mg/dL) | |||||
| Baseline | 200.05±74.08 | 182.37±87.27 | 171.26±48.78 | 0.365a | |
| Week 8 | 193.05±60.44 | 192.32±101.00 | 179.11±38.36 | 0.732b | 0.805 |
| Within group MD (95% CI)P value c | -7.00(-37.75 to 23.75)0.639 | 9.95(-18.29 to 38.18)0.469 | 7.85(0.36 to 21.32)0.053 | ||
| Total Cholesterol (mg/dL) | |||||
| Baseline | 176.50±38.24 | 166.26±32.66 | 172.78±39.19 | 0.611a | |
| Week 8 | 171.90±36.38 | 172.11±33.87 | 181.05±42.33 | 0.233b | 0.270 |
| Within group MD (95% CI)P value c | -4.60(-16.11 to 6.91)0.413 | 5.84(-6.10 to 17.78)0.318 | 8.26(-1.58 to 18.10)0.095 | ||
| HDL-C (mg/dL) | |||||
| Baseline | 42.35±6.74 | 45.84±6.52 | 45.89±7.58 | 0.127 a | |
| Week 8 | 45.70±9.06 | 47.84±8.33 | 45.53±7.86 | 0.330b | 0.157 |
| Within group MD (95% CI)P value c | 3.35(-0.42 to 7.12)0.079 | 2.00(-0.99 to 4.99)0.177 | -0.37 (-2.68 to 1.94)0.742 | ||
| LDL-C (mg/dL) | |||||
| Baseline | 94.10±35.40 | 81.31±28.47 | 93.10±32.09 | 0.299 a | |
| Week 8 | 89.20±32.34 | 83.21±26.23 | 98.42±36.21 | 0.300b | 0.278 |
| Within group MD (95% CI)P value c | -4.90(-14.20 to 4.40)0.284 | 1.89(-9.23 to 13.02)0.725 | 5.31(-4.44 to 15.07)0.267 | ||
| LDL/HDL | |||||
| Baseline | 2.23±0.78 | 1.80±0.63 | 2.08±0.76 | 0.112 a | |
| Week 8 | 1.96±0.72 | 1.80±0.67 | 2.18±0.76 | 0.091b | 0.040 |
| Within group MD (95% CI)P value c | -0.27(-0.54 to 0.00)0.052 | 0.00(-0.19 to 0.19)1.000 | 0.09(-0.11 to 0.30)0.354 | ||
| VLDL, (mg/dL) | |||||
| Baseline | 45.10±14.92 | 40.47±18.88 | 41.74±14.85 | 0.587 a | |
| Week 8 | 43.65±12.50 | 42.21±20.89 | 43.16±13.33 | 0.750b | 0.814 |
| Within group MD (95% CI)P value c | -1.45(-7.69 to 4.79)0.632 | 1.74(-3.93 to 7.40)0.528 | 1.42(-0.45 to 3.30)0.129 |
Table 4 demonstrated the results of between group and within group comparison analysis on energy, macronutrients intake and appetite level variables. At baseline, all variables were similar except in protein intake and appetite variables (P < 0.001 or _P_ = 0.008), but mentioned parameters were not significantly different between SAE and crocin group (_P_ > 0.05). Paired t test comparisons revealed that when compared to baseline mean values, both SAE and crocin interventions yielded significant decrease in energy and dietary intake mean values (P < 0.001 and P = 0.046), while it remained unchanged in the placebo group, also the feeling of hunger decreased significantly in SAE and crocin groups (P < 0.001 and 0.029, respectively). There was significant difference between study groups in the mean value of energy, carbohydrate and protein intake at the end of study, before and after adjustment for age and sex (P < 0.001). According to Sidak test, the SAE group revealed significant difference in comparison to crocin and placebo group (P < 0.05) in these variables. Comparison between SAE and crocin group showed that, mean difference of energy, carbohydrate and protein intake was 85.18 kcal (P = 0.012), 13.78 (P = 0.004) and 4.71 g (P < 0.001) respectively. Feeling of hunger in SAE group decreased significantly compared to crocin group (MD= -2.384, CI: -4.229 to -0.539, P = 0.007). However, feeling of fullness and satiety in SAE group increased dramatically compared to crocin (MD= 1.741, CI: 0.628 to 2.855, P = 0.001 and MD = 1.526, CI: 0.126 to 2.926, P = 0.028, respectively).
Table 4. Energy, dietary intake and appetite parameters in study groups .
| Variable | SAE (n=25) | Crocin (n=25) | Placebo (n=25) | P value | P value # |
|---|---|---|---|---|---|
| Energy (kcal/d) | |||||
| Baseline | 2527.35±234.12 | 2446.26±251.61 | 2385.97±180.68 | 0.089 a | |
| Week 8 | 2356.91±280.31 | 2363.75±263.88 | 2372.06±149.05 | <0.001b | <0.001 |
| Within group MD (95% CI)P -valuec | -170.44(-227.31 to -113.57)<0.001 | -82.51(-113.21 to -51.81)<0.001 | -13.92(-44.16 to 16.33)0.352 | ||
| Carbohydrate (g/d) | |||||
| Baseline | 373.86±44.00 | 364.15±48.67 | 360.26±28.82 | 0.492 a | |
| Week 8 | 346.18±51.00 | 350.40±47.69 | 358.36±27.07 | <0.001b | <0.001 |
| Within group MD (95% CI)P -value c | -27.69(-35.61 to -19.76)<0.001 | -13.75(-18.65 to -8.85)<0.001 | -1.90(-6.46 to 2.66)0.397 | ||
| Protein (g/d) | |||||
| Baseline | 70.76±8.99 | 67.61±5.61 | 64.19±6.74 | 0.008 a | |
| Week 8 | 62.96±7.74 | 65.29±5.59 | 63.82±6.18 | <0.001b | <0.001 |
| Within group MD (95% CI)P -value c | -7.79(-10.43 to -5.16)<0.001 | -2.32(-3.19 to -1.44)<0.001 | -0.37 (-1.17 to 0.43)0.347 | ||
| Total fat (g/d) | |||||
| Baseline | 83.21±10.52 | 79.91±11.32 | 76.46±9.62 | 0.083 a | |
| Week 8 | 80.04±11.12 | 77.22±11.60 | 75.22±8.14 | 0.802b | 0.836 |
| Within group MD (95% CI)P -value c | -3.17(-6.28 to -0.05)0.046 | -2.69(-3.71 to -1.66)<0.001 | -1.24(-3.57 to 1.10)0.285 | ||
| Feelings of fullness (mm)§ | |||||
| Baseline | 41.12±4.11 | 42.84±2.03 | 48.00±7.91 | <0.001a | |
| Week 8 | 44.40±2.86 | 44.20±2.14 | 48.68±7.87 | <0.001b | <0.001 |
| Within group MD (95% CI)P -value c | 3.28(2.45 to 4.11)<0.001 | 1.36(0.72 to 2.00)<0.001 | 0.68(0.10 to 1.26)0.024 | ||
| Feelings of satiety (mm)§ | |||||
| Baseline | 41.64±4.84 | 42.44±2.63 | 49.68±7.07 | <0.001a | |
| Week 8 | 45.12±4.75 | 44.36±3.21 | 49.64±7.27 | <0.001b | <0.001 |
| Within group MD (95% CI)P -value c | 3.48(2.65 to 4.31)<0.001 | 1.92(0.95 to 2.88)<0.001 | -0.04(-0.72 to 0.64)0.904 | ||
| Feelings of hunger (mm)§ | |||||
| Baseline | 46.20±5.48 | 49.28±3.55 | 42.36±5.65 | <0.001a | |
| Week 8 | 42.88±4.62 | 47.80±4.22 | 42.28±5.58 | 0.001b | 0.007 |
| Within group MD (95% CI)P -value c | -3.32(-4.54 to -2.09)<0.001 | -1.48(-2.79 to -0.17)0.029 | -0.08(-0.81 to 0.65)0.824 |
Discussion
The results of the present study confirmed that both the SAE and crocin were effective in improving anthropometric indices, some parameters of body composition, energy, carbohydrate and protein intake in patients with CAD in comparison to placebo, although SAE had stronger effects than crocin. Both interventions could favorably alter the parameters of appetite, but the effect of SAE was significant. Lipid profile variables did not change significantly after 8 weeks.
Previously, in a clinical trial the effects of alcoholic extract of saffron on appetite, anthropometric parameters and body composition were investigated in overweight women.20 According to this study, saffron consumption induced satiating effect, reduced snacking and leading to weight loss. Unlike our study, in this trial energy, dietary intake measurements and lipid profile have not been addressed. According to our knowledge, this study is the first report to compare the effect of SAE and crocin on mentioned parameters in patients with coronary artery disease in a randomized, double blind, placebo-controlled design. In the present study, both SAE and crocin were well tolerated by the patients and did not interfere with clinical improvement; besides, no serious side effects were observed. This was consistent with the previous reports on the safety of saffron and crocin in humans.24,25 Participants in present study were overweight and mildly obese. Fullness and satiety feeling were significantly low compared to crocin and placebo group. Daily consumption of SAE created satiety and fullness feeling in consistent with Gout et al.20 The effect of crocin on appetite parameters was in a same trend with SAE and it was significant. Crocin modestly suppressed the appetite, energy and macronutrients intake after 8 weeks of intervention. However it should be noted the effects of SAE was stronger than crocin. Some other active ingredients (safranal) in addition to crocin may be involved in the effects of saffron on these properties. In fact, there are some known synergistic interactions between bioactive molecules within the saffron composition.26 Probably these are possible mechanisms for saffron stronger effects.
The effects of saffron and its active constituents on dietary intakes was not assessed before in human studies. So there is no information regarding their effects on macronutrients intake. In present investigation, dietary intake of carbohydrate and protein were comparable between study groups, while it was almost similar for fat intake between groups at the end of study. By conducting more studies in this regard we could be able to assess the exact effect of saffron and crocin on macronutrients intake.
Limited studies investigated the anti-obesity potentials of saffron. Mashmoul et al18 evaluated the effect of saffron’s ethanolic extract and its main carotenoid crocin in a rat model of high fat diet–induced obesity. Results showed that saffron extract could restrict appetite and food consumption. The anorexigenic effect of saffron was confirmed by Kianbakht et al.21 In this study the effects of saffron and crocin compared to sibutramine were measured in adult male Wistar rats and the results suggested that both saffron and crocin could reduce the body weight, food intake and blood leptin levels significantly compared to the control group and baseline and also the effects were comparable to sibutramine. An active component in saffron, solely or synergic with other ingredients can modulate neurotransmitter pathways especially serotonin reuptake27,28 and probably it can target appetite control centers and limit food intake. Previous human controlled trials have pointed to this property of saffron and decreased feeling of hunger was indicated as side effect of saffron treatment.29,30 In present study, waist circumference, waist to hip ratio, fat mass and fat percent decreased in both interventions in comparison to placebo, with a higher magnitude in the SAE group. Similarly, Mashmoul et al18 reported the significant reduction in total fat pad and its subscales in crocin group. In a rat model, six weeks treatment with crocetin (a natural carotenoid compound found in the stigmas of saffron) decreased visceral fat accumulation significantly. Saffron components could inhibit the activity of pancreatic lipase and reduce fat absorption.31 They also could increase fat metabolism, lipolysis and energy expenditure.32 Probably, through these mechanisms saffron and its components could affect fat mass and consequently abdominal obesity. Although according to the literature, a limited number of studies have addressed the anti-obesity effects of saffron. So further research into the underlying mechanism of saffron extract and crocin on anthropometric and body composition modification is needed.
Central fat distribution is more relevant in CAD risk compared to total fat mass.33 Waist circumference and waist to hip ratio (WHR) are determinants of central obesity.34 Thus any modification of these indices could prevent undesirable outcomes of CAD. Central obesity, is associated with dyslipidemia characterized by elevated TG, LDL-C and reduced HDL-C concentrations. Dyslipidemia is a main cardiovascular risk factor for CAD. Several investigations revealed that saffron extract and its components could improve lipid profile and prevent obesity complications. Lee et al35 confirmed the hypolipidemic effects of crocin and crocetin in hyperlipidemic mice, also in two other studies on quails the similar results were obtained.36,37 Lipid lowering property of both crocin and saffron on diet-induced hyperlipidemic rats was shown previously.31,38 According to Asdaq et al38 the high dose of saffron (100 mg/kg) was found to be significantly better than high dose of crocin (19.38 mg/kg) in falling TC, TG and LDL-C. Samarghandian et al22 study evaluated the effect of SAE on STZ-induced diabetic rats and its effects on serum lipid profiles and some other metabolic parameters. Against the findings of our study, the results indicated that saffron could increase the body weight in diabetic rats and also ameliorate lipid profile levels. Parallel with Samarghandian et al, the findings of Shirali et al,17,39 confirmed the hypolipidemic effects of SAE and also crocin on a model of diabetes mellitus. The mechanism proposed regarding hypolipidemic effects of saffron is that, crocin selectively could inhibits the activity of pancreatic lipase and result in malabsorption of fat and cholesterol.31 However the results of experimental studies in this regard were not unanimous. An investigation on high lipid feeding rabbits revealed that crocetin had no effect on plasma lipid pattern.40 A 4-week randomized clinical trial conducted on patients suffering major depression and evaluated the effects of saffron on depression and lipid profile.41 Consistent with our study they did not observe any lipid lowering property. Probably, use of different doses of saffron and crocin and non-identical duration of study in animal investigations, indicated the different results. In several clinical trials mentioned in this study, the participants were not homogenous. Study populations were overweight women, patients suffering from depression or CAD. So it may be responsible for conflicting results.
The limitations of our study were its little sample size, short duration and fix dose of saffron and crocin. Because several studies indicated that the effects of saffron and crocin were dose dependent.
Conclusion
The results of present study regarding anti-obesity feature of SAE and crocin in patients with CAD was promising. However the SAE was better in appetite suppressing, dietary intake and central obesity reduction. We did not observe significant lipid lowering effect in interventional groups compared to placebo group. There were limited number of human studies addressing the effects of saffron and crocin on anti-obesity, appetite reducing and modification of lipid profile. In the other hand the results of animal studies were inconsistent in this regards. Therefore it is highly recommended that, these findings are confirmed in a larger sample size with longer duration and various doses.
Ethical approval
The present study is registered in the Iranian Registry Clinical Trials (IRCT201512102017N26). The Ethics Committee of Tabriz University of Medical Sciences approved this study (TBZMED.REC.1394.739).
Competing interests
All authors declare no competing financial interests exist.
Acknowledgements
This trial was financially supported by a grant from Vice-chancellor for Research, Nutrition Research Center (grant No. 5.71.1220), Tabriz University of Medical Sciences. We would like to thank the Tarbiat Modares University that provided saffron and extraction supplies.
Please cite this article as: Abedimanesh N, Bathaie SZ, Abedimanesh S, Motlagh B, Separham A, Alireza Ostadrahimi A. Saffron and crocin improved appetite, dietary intakes and body composition in patients with coronary artery disease. J Cardiovasc Thorac Res 2017;9(4):200-208. doi: 10.15171/jcvtr.2017.35.
References
- 1.Fiuza M. Metabolic syndrome and coronary artery disease. Rev Port Cardiol. 2012;31:779–82. doi: 10.1016/j.repc.2012.09.005. [DOI] [PubMed] [Google Scholar]
- 2.Ebrahimi M, Kazemi-Bajestani S, Ghayour-Mobarhan M, Ferns G. Coronary artery disease and its risk factors status in Iran: A review. Iran Red Crescent Med J. 2011;13:610–23. doi: 10.5812/kowsar.20741804.2286. [DOI] [PMC free article] [PubMed] [Google Scholar]
- 3.Montazerifar F, Bolouri A, Mozaffar MM, Karajibani M. The Prevalence of Metabolic Syndrome in Coronary Artery Disease Patients. Cardiol Res. 2016;7:202–8. doi: 10.14740/cr507w. [DOI] [PMC free article] [PubMed] [Google Scholar]
- 4.Gunstad J, Luyster F, Hughes J, Waechter D, Rosneck J, Josephson R. The effects of obesity on functional work capacity and quality of life in phase II cardiac rehabilitation. Prev Cardiol. 2007;10:64–7. doi: 10.1111/j.1520-037X.2007.05860.x. [DOI] [PubMed] [Google Scholar]
- 5.Lavie CJ, Milani RV. Obesity and cardiovascular disease: the Hippocrates paradox? J Am Coll Cardiol. 2003;42(4):677–9. doi: 10.1016/S0735-1097(03)00784-8. [DOI] [PubMed] [Google Scholar]
- 6.Nikolopoulou A, Kadoglou NP. Obesity and metabolic syndrome as related to cardiovascular disease. Expert Rev Cardiovas Ther. 2012;10:933–9. doi: 10.1586/erc.12.74. [DOI] [PubMed] [Google Scholar]
- 7.Attie AD, Scherer PE. Adipocyte metabolism and obesity. J lipid Res. 2009;50:S395–S9. doi: 10.1194/jlr.R800057-JLR200. [DOI] [PMC free article] [PubMed] [Google Scholar]
- 8.Wang Z, Nakayama T. Inflammation, a link between obesity and cardiovascular disease. Mediators inflamm. 2010;2010:535918. doi: 10.1155/2010/535918. [DOI] [PMC free article] [PubMed] [Google Scholar]
- 9.Trayhurn P, Wood IS. Adipokines: inflammation and the pleiotropic role of white adipose tissue. Br J Nutr. 2004;92:347–55. doi: 10.1079/BJN20041213. [DOI] [PubMed] [Google Scholar]
- 10.Ng M, Fleming T, Robinson M, Thomson B, Graetz N, Margono C. et al. Global, regional, and national prevalence of overweight and obesity in children and adults during 1980–2013: a systematic analysis for the Global Burden of Disease Study 2013. Lancet. 2014;384:766–81. doi: 10.1016/S0140-6736(14)60460-8. [DOI] [PMC free article] [PubMed] [Google Scholar]
- 11.World Health Organization. Global status report on noncommunicable diseases. Geneva: WHO; 2014. [DOI] [PubMed]
- 12.Maddah M. The Factors associated with adult obesity in Iran: A review. Iran J Nutr Sci & Food Tech. 2012;7:119–127. [Google Scholar]
- 13.Polonsky KS, Klein S. Gastric banding to treat obesity: band-aid or breakthrough? Nat Clin Pract Endocrinol Metab. 2008;4:421–2. doi: 10.1038/ncpendmet0889. [DOI] [PubMed] [Google Scholar]
- 14.Narayanaswami V, Dwoskin LP. Obesity: Current and potential pharmacotherapeutics and targets. Pharmacol Ther. 2016;170:116–47. doi: 10.1016/j.pharmthera.2016.10.015. [DOI] [PMC free article] [PubMed] [Google Scholar]
- 15.Garcia-Alvarez A, Mila-Villarroel R, Ribas-Barba L, Egan B, Badea M, Maggi FM. et al. Usage of Plant Food Supplements (PFS) for weight control in six European countries: results from the PlantLIBRA PFS Consumer Survey 2011-2012. BMC Complement Altern Med. 2016;16:254–268. doi: 10.1186/s12906-016-1227-5. [DOI] [PMC free article] [PubMed] [Google Scholar]
- 16.Bathaie SZ, Mousavi SZ. New applications and mechanisms of action of saffron and its important ingredients. Crit Rev Food Sci Nutr. 2010;50:761–86. doi: 10.1080/10408390902773003. [DOI] [PubMed] [Google Scholar]
- 17.Shirali S, Zahra Bathaie S, Nakhjavani M. Effect of crocin on the insulin resistance and lipid profile of streptozotocin‐induced diabetic rats. Phytother Res. 2013;27:1042–7. doi: 10.1002/ptr.4836. [DOI] [PubMed] [Google Scholar]
- 18.Mashmoul M, Azlan A, Yusof BNM, Khaza’ai H, Mohtarrudin N, Boroushaki MT. Effects of saffron extract and crocin on anthropometrical, nutritional and lipid profile parameters of rats fed a high fat diet. J Funct Foods. 2014;8:180–7. doi: 10.1016/j.jff.2014.03.017. [DOI] [Google Scholar]
- 19.Imenshahidi M, Hosseinzadeh H, Javadpour Y. Hypotensive effect of aqueous saffron extract (Crocus sativus L) and its constituents, safranal and crocin, in normotensive and hypertensive rats. Phytother Res. 2010;24:990–4. doi: 10.1002/ptr.3044. [DOI] [PubMed] [Google Scholar]
- 20.Gout B, Bourges C, Paineau-Dubreuil S. Satiereal, a Crocus sativus L extract, reduces snacking and increases satiety in a randomized placebo-controlled study of mildly overweight, healthy women. Nutr Res. 2010;30:305–13. doi: 10.1016/j.nutres.2010.04.008. [DOI] [PubMed] [Google Scholar]
- 21.Kianbakht S, Hashem Dabaghian F. Anti-obesity and anorectic effects of saffron and its constituent crocin in obese Wistar rat. J Med Plants. 2015;1(53):25–33. [Google Scholar]
- 22.Samarghandian S, Azimi-Nezhad M, Samini F. Ameliorative effect of saffron aqueous extract on hyperglycemia, hyperlipidemia, and oxidative stress on diabetic encephalopathy in streptozotocin induced experimental diabetes mellitus. Biomed Res Int. 2014;2014:920857. doi: 10.1155/2014/920857. [DOI] [PMC free article] [PubMed] [Google Scholar]
- 23.Bolhasani A, Bathaie S, Yavari I, Moosavi-Movahedi A, Ghaffari M. Separation and purification of some components of Iranian saffron. Asian J Chem. 2005;17:725–729. [Google Scholar]
- 24.Mousavi B, Bathaie SZ, Fadai F, Ashtari Z. Safety evaluation of saffron stigma (Crocus sativus L) aqueous extract and crocin in patients with schizophrenia. Avicenna J Phytomed. 2015;5:413–9. doi: 10.22038/AJP.2015.3879. [DOI] [PMC free article] [PubMed] [Google Scholar]
- 25.Mohamadpour AH, Ayati Z, Parizadeh MR, Rajbai O, Hosseinzadeh H. Safety evaluation of crocin (a constituent of saffron) tablets in healthy volunteers. Iran J Basic Med Sci. 2013;16:39–46. doi: 10.22038/IJBMS.2013.247. [DOI] [PMC free article] [PubMed] [Google Scholar]
- 26.Li N, Lin G, Kwan Y-W, Min Z-D. Simultaneous quantification of five major biologically active ingredients of saffron by high-performance liquid chromatography. J Chromatogr A. 1999;849:349–55. doi: 10.1016/S0021-9673(99)00600-7. [DOI] [PubMed] [Google Scholar]
- 27.Akhondzadeh S, Tahmacebi‐Pour N, Noorbala AA, Amini H, Fallah‐Pour H, Jamshidi AH. et al. Crocus sativus L in the treatment of mild to moderate depression: a double‐blind, randomized and placebo‐controlled trial. Phytother Res. 2005;19:148–51. doi: 10.1002/ptr.1647. [DOI] [PubMed] [Google Scholar]
- 28.Basti AA, Moshiri E, Noorbala A-A, Jamshidi A-H, Abbasi SH, Akhondzadeh S. Comparison of petal of Crocus sativus L and fluoxetine in the treatment of depressed outpatients: a pilot double-blind randomized trial. Prog Neuropsychopharmacol Biol Psychiatry. 2007;31:439–42. doi: 10.1016/j.pnpbp.2006.11.010. [DOI] [PubMed] [Google Scholar]
- 29.Akhondzadeh Basti A, Ghoreishi S, Noorbala A, Akhondzadeh S, Rezazadeh S. Petal and stigma of Crocus sativus L in the treatment of depression: a pilot double-blind randomized trial. J Med Plants. 2008;1(25):29–36. [Google Scholar]
- 30.Noorbala A, Akhondzadeh S, Tahmacebi-Pour N, Jamshidi A. Hydro-alcoholic extract of Crocus sativus L versus fluoxetine in the treatment of mild to moderate depression: a double-blind, randomized pilot trial. J ethnopharmacol. 2005;97:281–4. doi: 10.1016/j.jep.2004.11.004. [DOI] [PubMed] [Google Scholar]
- 31.Sheng L, Qian Z, Zheng S, Xi L. Mechanism of hypolipidemic effect of crocin in rats: crocin inhibits pancreatic lipase. Eur J pharmacol. 2006;543:116–22. doi: 10.1016/j.ejphar.2006.05.038. [DOI] [PubMed] [Google Scholar]
- 32.Mashmoul M, Azlan A, Khaza’ai H, Yusof BNM, Noor SM. Saffron: A natural potent antioxidant as a promising anti-obesity drug. Antioxidants. 2013;2:293–308. doi: 10.3390/antiox2040293. [DOI] [PMC free article] [PubMed] [Google Scholar]
- 33.Després J. CVD risk assessment: do we need the metabolic syndrome or better global cardiometabolic risk calculators? Int J Obes. 2008;32(Suppl 2):1–4. doi: 10.1038/ijo.2008.27. [DOI] [PubMed] [Google Scholar]
- 34.Rashiti P, Elezi S, Behluli I. Relationship of Plasma Adiponectin and Waist-hip Ratio with Coronary Artery. Med Arch. 2016;70(6):413–8. doi: 10.5455/medarh.2016.70.413-418. [DOI] [PMC free article] [PubMed] [Google Scholar]
- 35.Lee I-A, Lee JH, Baek N-I, Kim D-H. Antihyperlipidemic effect of crocin isolated from the fructus of Gardenia jasminoides and its metabolite crocetin. Biol Pharma Bul. 2005;28:2106–10. doi: 10.1248/bpb.28.2106. [DOI] [PubMed] [Google Scholar]
- 36.He S-Y, Qian Z-Y, Tang F-T, Wen N, Xu G-L, Sheng L. Effect of crocin on experimental atherosclerosis in quails and its mechanisms. Life Sci. 2005;77:907–21. doi: 10.1016/j.lfs.2005.02.006. [DOI] [PubMed] [Google Scholar]
- 37.He S-Y, Qian Z-Y, Wen N, Tang F-T, Xu G-L, Zhou C-H. Influence of Crocetin on experimental atherosclerosis in hyperlipidamic-diet quails. Eur J Pharmacol. 2007;554:191–5. doi: 10.1016/j.ejphar.2006.09.071. [DOI] [PubMed] [Google Scholar]
- 38.Asdaq SMB, Inamdar MN. Potential of Crocus sativus (saffron) and its constituent, crocin, as hypolipidemic and antioxidant in rats. Appl Biochem Biotechnol. 2010;162:358–72. doi: 10.1007/s12010-009-8740-7. [DOI] [PubMed] [Google Scholar]
- 39.Shirali S, Bathaei S, Nakhjavani M, Ashoori M. Effects of saffron (Crocus sativus L) aqueous extract on serum biochemical factors in streptozotocin-induced diabetic rats. Iran J Med Aroma Plants. 2012;28:293–308. [Google Scholar]
- 40.Zheng S, Qian Z, Sheng L, Wen N. Crocetin attenuates atherosclerosis in hyperlipidemic rabbits through inhibition of LDL oxidation. J Cardiovasc Pharmacol. 2006;47:70–6. doi: 10.1097/01.fjc.0000194686.11712.02. [DOI] [PubMed] [Google Scholar]
- 41.Sahraian A, Jelodar S, Javid Z, Mowla A, Ahmadzadeh L. Study the effects of saffron on depression and lipid profiles: A double blind comparative study. Asian J Psychiatr. 2016;22:174–6. doi: 10.1016/j.ajp.2015.10.012. [DOI] [PubMed] [Google Scholar]