Correlative Light-Electron Microscopy Reveals the Tubular-Saccular Ultrastructure of Carriers Operating between Golgi Apparatus and Plasma Membrane (original) (raw)
Abstract
Transport intermediates (TIs) have a central role in intracellular traffic, and much effort has been directed towards defining their molecular organization. Unfortunately, major uncertainties remain regarding their true structure in living cells. To address this question, we have developed an approach based on the combination of the green fluorescent protein technology and correlative light-electron microscopy, by which it is possible to monitor an individual carrier in vivo and then take a picture of its ultrastructure at any moment of its lifecycle. We have applied this technique to define the structure of TIs operating from the Golgi apparatus to the plasma membrane, whose in vivo dynamics have been characterized recently by light microscopy. We find that these carriers are large (ranging from 0.3–1.7 μm in maximum diameter, nearly half the size of a Golgi cisterna), comprise almost exclusively tubular-saccular structures, and fuse directly with the plasma membrane, sometimes minutes after docking to the fusion site.
Keywords: Golgi complex, anterograde intracellular transport, membrane traffic, immunoelectron microscopy, plasmalemma
Introduction
The secretory pathway of eukaryotic cells consists of a series of morphologically and biochemically distinct organelles that house enzymes and proteins dedicated to the modification of secretory glycoproteins and their subsequent delivery to a variety of noncytoplasmic destinations. Secretory proteins are synthesized in the ER, transported to and through the Golgi cisternae, and ultimately delivered to either the cell surface or the endosomal–lysosomal system. Transport between intracellular organelles occurs by means of membranous containers, also called transport intermediates (TIs) or carriers, in which secretory proteins become temporarily included during transfer from each compartment to the next (Rothman and Wieland 1996).
Given the central role of TIs, much effort has been directed towards defining their structure, dynamics, and molecular organization, and several models concerning their nature have been proposed (Weidman 1995; Rothman and Wieland 1996; Schekman and Orci 1996; Bannykh and Balch 1997; Mironov et al. 1997; Pelham 1997; Schekman and Mellman 1997). The classic vesicular traffic scheme, for instance, posits that all TIs are small vesicles (50–100 nm in diameter) that bud from donor and fuse with acceptor organelles (for reviews see Rothman and Wieland 1996; Schekman and Orci 1996). Recently, however, it has become apparent that nonvesicular structures also play an important role in transport (for reviews see Bannykh and Balch 1997; Mironov et al. 1997; Pelham 1997; Schekman and Mellman 1997). In fibroblasts and other cell types, large supramolecular cargos move along the secretory pathway without entering carrier vesicles or leaving the Golgi cisternae (Bonfanti et al. 1998). This indicates that the cisternae themselves somehow behave as transport intermediates by gradually maturing and progressing in the cis–trans direction (Bannykh and Balch 1997; Mironov et al. 1997; Pelham 1997; Schekman and Mellman 1997; Bonfanti et al. 1998). A similar maturation scheme has also been advanced for traffic from early to late endosomes (Murphy et al. 1993). Furthermore, in other studies, vesicular-tubular clusters rather than isolated vesicles have been shown to operate as intermediates between the ER and the Golgi complex (Bannykh et al. 1997), and tubules have been suggested to mediate intra-Golgi (Weidman 1995; Mironov et al. 1997), retrograde Golgi-to-ER (Sciaky et al. 1997), and TGN to plasma membrane (PM) transport (Hirschberg et al. 1998; Toomre et al. 1999). Therefore, it appears that a unifying vesicular paradigm for transport intermediates is no longer sustainable, and the structure and dynamics of the intermediates at each stage of the trafficking pathways need to be reexamined using a new repertoire of concepts and technologies.
The recent use of chimeras of secretory molecules with green fluorescent protein (GFP) (Heim and Tsien 1996) has already yielded important new information about the dynamics of carriers involved in transport from the ER and the Golgi complex, and from the Golgi complex to the PM (Presley et al. 1997; Scales et al. 1997; Hirschberg et al. 1998; Nakata et al. 1998; Wacker et al. 1997; Toomre et al. 1999). Golgi-to-PM carriers (GPCs), for instance, appear to bud from the Golgi mass and move along microtubules (MTs) towards the PM, where they fuse within 3–5 min after their appearance (Hirschberg et al. 1998). At the light microscopy level, they appear generally larger than individual vesicles (Hirschberg et al. 1998; Toomre et al. 1999), albeit not always (Toomre et al. 1999), and seem to have roughly tubular structures, which often change shape as they move.
Unfortunately, however, the spatial resolution of light microscopy is too limited to provide significant information regarding the true fine structure of the GPCs. To date, the precise size and shape of these transport intermediates, their physical relationships with other organelles, and even whether they are composed completely or in part of clusters of transport vesicles, is not known. These questions have important mechanistic and functional implications and must be addressed if the nature of these transport organelles is to be understood. To resolve these issues, one would ideally like to use a microscopical method combining the capability of GFP technology to follow dynamically each stage of a TI lifecycle with the spatial resolution of EM. This is beyond today's technology, but a partial answer can be provided by correlative light electron microscopy. An attempt in this direction has been made recently by Nakata et al. 1998 in a study in which a long tubule-like carrier containing GFP-tagged PM proteins was followed in vivo during transport along the axon of neurons from the cell body to the PM. The area of the axon containing the same carrier was then examined by EM, and found to contain tubular structures. Unfortunately, however, this approach does not allow the identification of the very same TI at both the light and EM levels, and as a consequence, the ultrastructure of an object defined as a TI based on the observation of its in vivo dynamics cannot be known with certainty. Moreover, the method is unsuitable for determination of structure by three-dimensional (3D) reconstruction.
Here, we have overcome these problems by developing a new correlative microscopy approach by which, for the first time, the experimenter can follow individual TIs dynamically in vivo via GFP, and then take a snapshot of the 3D ultrastructure of the very same TI at any moment of its lifecycle, for instance, during formation, transit through the cytosol, or fusion with the target membrane. We have applied this technique to analyze constitutive TIs operating from the Golgi complex to the PM, since the in vivo dynamics of these carriers have been already characterized by light microscopy (see above). We find that constitutive GPCs are often large, sometimes as large as half a Golgi cisterna, are tubular-saccular in shape, and fuse with PM en bloc, usually several seconds after docking to the fusion site.
Materials and Methods
Cells and Reagents
NRK and COS-7 cells were grown on CELLocate coverslips (Eppendorf S.r.l.) in DME supplemented with 10% FCS and 1 mM l-glutamine. Unless otherwise noted, all chemicals and reagents were obtained as described previously (Bonfanti et al. 1998; Polishchuk et al. 1999). Polyclonal antibodies against vesicular stomatitis virus G protein (VSVG) lumenal domain, β-COP, mannose-6-phosphate receptor, human cathepsin D, mAbs against giantin or transferrin receptor, the temperature-sensitive strain (ts-O45) of VSV were generous gifts from Drs. K. Simons (European Molecular Biology Laboratory, Heidelberg, Germany), J. Lippincott-Schwartz (National Institutes of Health, Bethesda, MD), T. Braulke (University of Goettingen, Goettingen, Germany), C. Isidoro (Amedeo Avogadro University, Novara, Italy), H.-P. Hauri (University of Basel, Basel, Switzerland), and B. Goud (Institute Curie, Paris, France). The ts-O45 VSVG cDNA was donated by Dr. J. Rose (Yale University, New Haven, CT). The mAb against TGN38 was from Affinity BioReagents, Inc., the one against Trop2 was from Dr. C.E. Klein (University of Würzburg, Würzburg, Germany), and mAbs against γ-adaptin, α-tubulin, as well as rabbit anti–mouse IgG–Cy3 conjugate, goat anti–rabbit IgG–Cy3, and rabbit anti–goat IgG–Cy3 conjugates were from Sigma-Aldrich S.r.l. Alexa™ 488 goat anti–mouse IgG conjugate and the Alexa™ 488 goat anti–rabbit IgG conjugate were from Molecular Probes Europe BV. HRP-conjugated Fab fragments of goat anti–rabbit and anti–mouse IgG were from BioSys. GFP cDNA and recombinant S65T–GFP standard protein were from Clontech. Wheat germ agglutinin (WGA) and AlloA lectins conjugated with 10 nm colloidal gold particles were from EY Laboratories, Inc. Cationized gold, protein A–gold, and anti–rabbit gold antibodies were from British BioCell.
Construction of the VSVG–GFP Fusion Protein
The VSVG ts-O45 gene was amplified by PCR from the recombinant construct pSV045-2 (Gallione and Rose 1985) using as forward primer, GCGGAATTCACACTATGAAGTGCCTTT, and as reverse primer, GCGTCTAGACTTTCCAAGTCGGTTCATC. The PCR product was then ligated in frame with a S65T mutant GFP, using the EcoRI and XbaI restriction sites inserted in the forward and reverse primers, respectively. The fusion protein comprises an NH2-terminal VSVG and COOH-terminal GFP, linked by the SRRVISH synthetic sequence. The corresponding fusion cDNA was subcloned in a pRK5 plasmid for expression in eukaryotes.
Cell Transfection and Infection with VSV
COS-7 cells were transfected with cDNA encoding VSVG–GFP with Lipofectamine Plus (GIBCO BRL) according to the manufacturer's instructions. After transfection, cells were washed and then incubated overnight at 32°C and observed at the confocal microscope at the same temperature (i.e., at steady state conditions), fixed, and prepared for further immunofluorescence and EM analysis. Alternatively, transfected cells were kept at 40°C for 10–12 h to accumulate VSVG–GFP in the ER as described (Presley et al. 1997). Cells were then shifted from 40 to 20°C for 3 h in the presence of cycloheximide (50 μg/ml) to accumulate VSVG–GFP in the trans-Golgi. After the 20°C temperature block (or in some cases, directly after the 40°C block), cells were shifted to 32°C and analyzed with time-lapse confocal microscopy or prepared for immunofluorescence, immunoelectron microscopy, or correlative light-EM. Cell infection with ts-O45 VSV and release of VSVG from the temperature block was performed as described (Bergmann 1989). To label the endocytic compartments, in some cases VSVG was released from the 40 or 20°C blocks in the presence of either 4 μg/ml WGA-gold, AlloA-gold, or 7 μg/ml cationized gold. Cell transfection with cDNA encoding the extracellular domain of Trop2 protein (Alberti et al. 1992) fused with wild-type GFP (El Sewedy et al. 1998) was performed as described above. After transfection, cells were kept for 2–3 h at 20°C, then observed at 37°C under the confocal microscope in the presence of endocytic tracers as above and prepared for immunoelectron microscopy.
Light and Immunoelectron Microscopy Analysis
Time-lapse analysis, quantification of fluorescence, and double immunolabeling were performed as described (Bonfanti et al. 1998; Polishchuk et al. 1999). Quantification of VSVG–GFP was performed using recombinant S65T–GFP protein as described (Hirschberg et al. 1998). For QuickTime™ movie sequences see http://cmns.mnegri.it/\~polish/TGN-PM. For immunoelectron microscopy, cells were fixed with 4% formaldehyde and 0.05% glutaraldehyde in 0.15 M Hepes, pH 7.3, for 10 min at 37°C and then postfixed for 50 min with 4% paraformaldehyde in the same buffer at room temperature as described (Polishchuk et al. 1999). Serial sectioning and 3D reconstruction was performed as described (Bonfanti et al. 1998).
Correlative Light-EM
Identification of Transport Intermediates within the Cell.
After formation, individual GPCs containing VSVG–GFP were observed by time-lapse confocal microscopy both in synchronized and steady state cells. In each experiment, a single GPC was identified and its behavior was monitored and recorded. At a convenient time after the formation of a given carrier from the Golgi, i.e., at a time when the intermediate was relatively distant from other VSVG–GFP tagged objects, cells were fixed with 4% paraformaldehyde and 0.5% glutaraldehyde (see above), and the cell was optically sectioned to confirm the absence of other gfp-positive structures in the optical planes above and below the GPC. The cell was then identified and photographed by phase–contrast microscopy and treated for immunoelectron microscopy peroxidase labeling of the lumenal epitope of VSVG (Polishchuk et al. 1999). After resin polymerization, the CELLocate coverslip was dissolved in 40% hydrofluoric acid. The pattern of immunoperoxidase labeling in the cell of interest was photographed on a Zeiss Axiophot microscope and this image was superimposed with the VSVG–GFP fluorescence pattern of the same cell. At this time, other cellular structures that could later serve as spatial reference markers to identify the GPC of interest at the EM level were also identified (see Fig. 2). The sample was trimmed to obtain a small pyramid with the cell of interest in the center and covered by a thin layer of a freshly prepared resin, which was polymerized for an additional 12 h. The cell was then sectioned at an angle of 4° to the plane of its base. The edge between the freshly polymerized layer of resin and the sample containing the cell was clearly visible on serial sections. When this margin reached the cell, serial thick (200 nm) sections were collected with a loop (Perfect Loop; Agar) on slot grids covered with carbon-formvar supporting film and observed by EM without additional staining. The 3D reconstruction of serial sections and calculation of GPC surface area was performed with SURFDriver 3.0 software as described (Bonfanti et al. 1998).
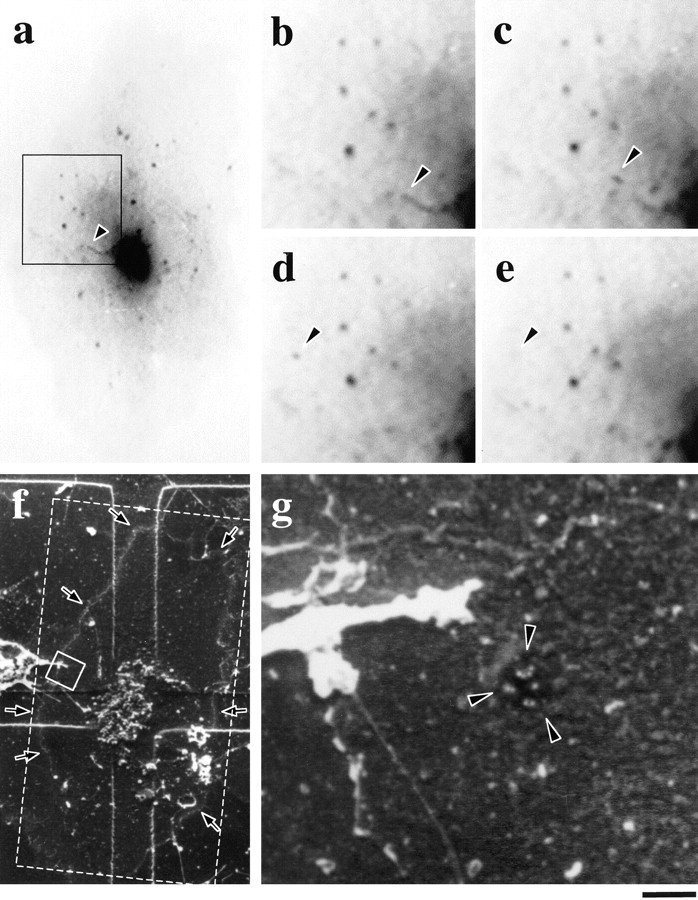
Figure 2.
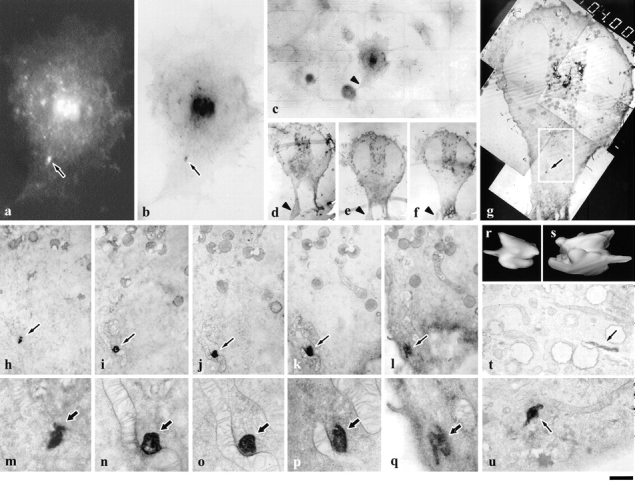
In vivo dynamics and ultrastructure of individual GPCs studied using correlative light-EM. The GPC in a (arrow) was picked out in vivo by time-lapse confocal microscopy (see movie 2.1). After fixation (see Materials and Methods), cells were immunoperoxidase-labeled and embedded in resin. The structure in b (arrow) was identified as the fluorescent GPC shown in a by electronic superimposition of the two images in a and b using CELLocate coordinates (an example of which is shown in c). As can be seen, the general pattern of immunoperoxidase labeling in b coincided with the fluorescent pattern of VSVG–GFP in a. Serial sections of the cell were then produced (d–f) and the first section displaying the TI (g, arrow) was captured at low magnifications (f and g). Note that the sections contain structures helpful for identification, for example, a protrusion (c–f, arrowheads). h–q represent a series of consecutive 200-nm sections containing the GPC (arrows). The field shown in h–l is the area of the cell identified with a white box in g. 3D reconstruction characterizes the GPC as an elongated sacculus with a short tubular protrusion (r and s). Other GPCs identified using the same approach appeared either as tubules (t, arrow) or sacculus with short tubules (u, arrow). Bar: (a and b) 9 μm; (c) 31 μm; (d–f) 12.2 μm; (g) 6 μm; (h–l) 2.1 μm; (m–q) 700 nm; (r and s) 320 nm; and (t and u) 1.2 μm.
Identification of Transport Intermediates Fusing with the PM.
Cells were observed using laser scanning confocal microscopy as described above and fixed during fusion of GFP fluorescent structures with PM. After fixation, cells were not permeabilized, but were incubated directly with antibodies against the VSVG ectodomain. Next, HRP-conjugated goat anti–rabbit IgG Fab fragments were added as a bridge, and finally anti–goat Cy3-conjugated antibodies were applied. In some experiments we used anti–goat gold-conjugated antibodies instead of Cy3 conjugates. Cells incubated with both fluorochrome- and HRP-conjugated secondary antibodies were first visualized under the confocal microscope to visualize GFP-positive structures labeled with antibody. HRP development was then performed as described (Polishchuk et al. 1999). By this means, the VSVG molecules exposed to the extracellular space (including those from GPC fusing with PM) were stained and then identified under the electron microscope as described above. For experiments with scanning EM, 30-nm gold particle–conjugated protein A was then added to detect the primary antibody. Finally, cells were stained with OsO4, dehydrated, dried in a HCP-2 critical point drying device (Hitachi Ltd.), and coated with gold in a JFC-110 sputterer (Hitachi Ltd.). Cells of interest were thus located on the CELLocate grid under a Philips XL 20 scanning electron microscope. Areas of GPC fusion with the PM were found using reference marks on the cell surface and the pattern of gold labeling at the fusion site was photographed.
Results
Recent studies have characterized the in vivo dynamics of post-Golgi carriers using as a transport marker the G protein of the ts-045 mutant strain of the VSV tagged with GFP (VSVG–GFP) (Hirschberg et al. 1998; Toomre et al. 1999). The VSVG protein has been widely used to study anterograde transport because it misfolds and is retained in the ER at 40°C, but it refolds and moves synchronously out of the ER upon lowering the temperature to 32°C (Bergmann 1989). As part of our correlative light-EM approach, the dynamics of VSVG–GFP traffic in living cells was first characterized under conditions appropriate for this methodology.
In Vivo Dynamics of the Carriers Operating between the Golgi Complex and the PM
The VSVG protein was tagged with GFP and used to transfect COS-7 cells. After transfection, cells were left to recover for 4–5 h at 37°C, and then kept at 40°C for 8–12 h (Presley et al. 1997). At the end of this period, VSVG–GFP fluorescence was localized exclusively to the ER (Fig. 1 a). Cells were then shifted to the permissive temperature (32°C) and cycloheximide was administered to prevent further synthesis of the protein. 5 min later, bright fluorescent structures of apparent sizes between 250 and 1,200 nm began to appear throughout the cytoplasm and moved towards the cell center with maximal speeds of up to 1.5 μm/s. Judging from these characteristics, such objects are likely to be the ER-to-Golgi carriers described recently by Presley et al. 1997 and Scales et al. 1997. After 10 min, a significant amount of VSVG–GFP fluorescence had redistributed to the juxtanuclear Golgi area (Fig. 1 b). 30–40 min later, a second wave of fluorescent objects started to depart from the Golgi apparatus and move in the opposite direction (from the Golgi apparatus towards the cell periphery), and then appeared to deliver VSVG–GFP to the PM (Fig. 1 c; see movie 1.2), presumably by fusing with it (see below). These objects represent GPCs.
Figure 1.
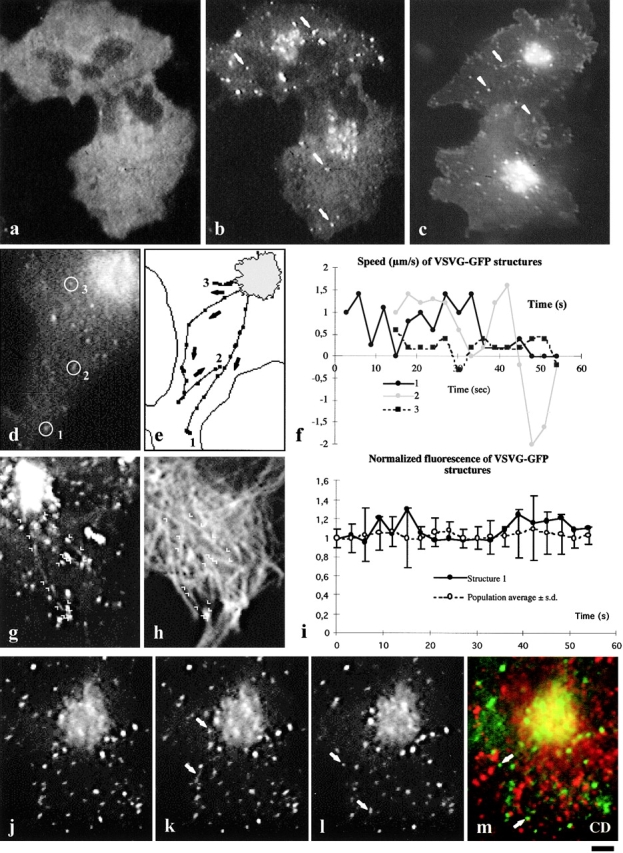
Transport of VSVG–GFP and GPC dynamics in living cells. COS-7 cells expressing VSVG–GFP were incubated for 12 h at 40°C and then shifted to 32°C for observation by time-lapse microscopy. VSVG–GFP fluorescence exhibited a typical ER pattern in cells incubated at 40°C (a). As soon as 10 min after the temperature shift, numerous bright spots (arrows) appeared in the cytoplasm and also in the Golgi area (b), and after 50 min (c; movie 1.2) most fluorescent spots were moving out of the Golgi complex. Three VSVG–GFP-positive GPCs departing from the Golgi were observed (d). The paths of these three GPCs (e) are indicated by their successive positions (recorded every 3 s) with arrows pointing in the direction of motion. Also shown is the velocity (μm/s, on the y-axis) of the three GPCs at different times after exit from the Golgi complex (f). Negative values indicate backward movement. Two GPCs were observed by time-lapse microscopy every 3 s for 60 s after exit from the Golgi complex. Cells were then fixed and immunolabeled for α-tubulin. Images representing successive positions of GPCs (arrowheads) were electronically overlaid to reconstruct the trajectory of the GPCs (g). These trajectories were then electronically superimposed (using CELLocate coordinates) with the α-tubulin pattern (h). The positions of GPCs at any given time coincide with at least one microtubular structure (h). The fluorescence intensity (i, y-axis) of GPC#1 in d at different times after exit from the Golgi complex, was normalized to its fluorescence at the time of exit (i, filled circles). Also shown (i, open circles) are the average values of normalized fluorescence (calculated as described above) relative to the entire population of GPCs in the same cell at different times after formation. GPCs containing VSVG–GFP (arrows) were monitored in living cells after warm-up from 20 to 32°C (j–l). Cells were then fixed while still recording and immunolabeled for cathepsin D (m). Colocalization of cathepsin D (red) and VSVG–GFP (green) was estimated using confocal microscopy. A clear colocalization was found in the Golgi area, whereas no significant colocalization was found in the GPCs (m, arrows). Bar: (a–c) 8 μm; (d, e, g, and h) 3 μm; and (j–m) 3.2 μm.
Many GPCs appeared to detach from tubular extensions dynamically protruding from the Golgi body, and moved away as units of apparent sizes between 0.5 and 1.5 μm (movies 1.2, 1.3, and 1.4). Detachment was usually preceded by the rounding-up of the extension tip, which was then severed into a GPC (movie 1.4, arrowhead). Other GPCs seemed to abruptly dart out of the Golgi mass, possibly because the extensions from which they detached were hidden by the overlapping Golgi mass. The formation of GPCs did not seem to involve concentration of cargo; also, GPCs did not change fluorescence after formation (Fig. 1 i), and fission and fusion events among them were rare. After exit from the Golgi apparatus, most but not all Gpcs translocated rapidly towards the periphery (Fig. 1d and Fig. e) at a speed of up to 2 μm/s (Fig. 1 f), although sometimes they transiently inverted direction of movement (Fig. 1e and Fig. f). Some GPCs, instead, did not move centrifugally after exiting the Golgi apparatus (see Discussion). Fig. 1 e maps the movement of three GPCs for 60 s after their formation. The speed and trajectories of the GPCs suggested that their movement might be mediated by MTs. This was confirmed by two types of experiments. First, the trajectories of the GPCs were compared with the disposition of the tubulin-based cytoskeleton (Fig. 1g and Fig. h). Fig. 1g and Fig. h, shows that, indeed, the trajectories of GPCs precisely overlap with MTs radiating towards the periphery. Second, cells were treated with the MT-depolymerizing agent, nocodazole. GPC movements were nearly completely inhibited (data not shown) by the drug, although the transfer of VSVG–GFP from the Golgi complex to the PM was not dramatically affected by nocodazole (data not shown). This agrees with previous studies (Hirschberg et al. 1998; Lippincott-Schwartz 1998), indicating that although MTs are required for GPC movement, they are not strictly necessary for cargo delivery to the PM (see Discussion). After arrival to the cell periphery, VSVG–GFP carriers either fused with the PM immediately, or remained for a few minutes near the PM before fusion, while displaying minor oscillatory movements. It should be noted that at this stage we tentatively define as fusion with the PM the apparent dissolution of the fluorescent GPCs within the focus plane of the PM, although in fact, only by ultrastructural analysis it is possible verify that these images really correspond to GPC–PM fusion events (see below). The average lifetime of GPCs from budding to fusion was ∼3 min, although some VSVG–GFP carriers fused with the PM within tens of seconds of their appearance (movie 1.3, inset).
To investigate whether transport via GPCs is linked with endocytic or Golgi-to-lysosome routes, a number of GPCs were identified and monitored for several seconds after their appearance (Fig. 1, j–l). Cells were then fixed and labeled with antibodies against the tgn-lysosomal protein markers cathepsin D (Fig. 1 m), mannose-6-phosphate receptor, and γ-adaptin, the early endosomal marker transferrin receptor, or the Golgi markers β-COP and giantin. None of these proteins was found to localize on the GPCs. An exception was a minor fraction of the GPCs in the vicinity of the Golgi complex, which appeared to stain for γ-adaptin. Thus, GPCs do not seem to share components with the Golgi complex or with endosomes.
We then asked whether the GPCs we observed could explain the overall rate of transport of VSVG–GFP out of the Golgi complex. To this end, we accumulated all the cargo protein in the Golgi complex by using the 20°C block method. This is a well-known procedure to inhibit export from the Golgi complex without preventing import from the ER. Transfected cells were shifted from the nonpermissive temperature of 40°C to 20°C for 2 h in the presence of cycloheximide, then warmed to 32°C. At this temperature, accumulated protein rapidly exits the Golgi complex into the GPCs and moves towards the PM (Griffiths et al. 1985). Using these conditions, the amount of fluorescent cargo transported in GPCs out of the Golgi and that lost from the Golgi mass per unit of time can be measured and compared. We find that the average VSVG–GFP content of one GPC as assessed from the total integrated fluorescence of individual GPCs (see Materials and Methods), accounts for 0.4–0.5% of the VSVG–GFP in the Golgi body, and the frequency of budding of gpcs is 3–5 per min. Thus, the GPC-mediated component of VSVG–GFP export from the Golgi complex can be calculated to have a t 1/2 of ∼40 min (assuming a simple exponential process). This value was compared with the overall rate of decrease in VSVG–GFP fluorescence of the Golgi mass itself, the t 1/2 of which was ∼25 min. This indicates that a major fraction (∼60%) of VSVG–GFP export from the Golgi complex is mediated by GPCs departing towards the periphery of the cell. Finally, control experiments were carried out to assess whether our experimental conditions produced nonphysiological events. First, the behavior of the VSVG–GFP construct was compared with that of the native VSVG protein using the 20°C block protocol. Second, the features of the GPCs formed after the 20°C temperature block were compared with those of GPCs formed under steady-state conditions of transport (accumulation in the ER at 40°C followed by shift to 32°C for 50 min; see legend to Fig. 1). Moreover, the GPCs were examined in cells exhibiting different levels of expression of VSVG. The features of the GPCs were very similar under all of the above experimental conditions (data not shown). Third, the general morphology and behavior of GPCs containing a different unrelated fluorescent protein cargo, a chimera between the soluble portion of the membrane protein Trop2 and GFP (sTrop2-GFP, available in the laboratory), were similar to VSVG–GFP-labeled GPCs (data not shown).
Altogether, these observations are in line with recent reports on GPC dynamics (Hirschberg et al. 1998; Toomre et al. 1999), and provide sufficient background to undertake the correlative light-EM analysis of the GPCs.
Ultrastructure of the GPCs in Transit between the Golgi and the PM
As noted above, the principle of our GFP-based correlative microscopy approach is to monitor individual VSVG–GFP-containing GPCs in vivo by fluorescence microscopy, and then identify the very same GPC in samples prepared for EM by fixation and immunoperoxidase labeling. This labeling technique is a crucial one, because the stain clearly delineates the internal profile of the labeled structures, thereby facilitating the recognition of the same intermediate in consecutive serial sections, and hence allowing its 3D reconstruction. Once labeled, the GPC of interest can be identified in EM sections by the use of both the CELLocate system of coordinates, and of suitable intracellular structures as spatial reference marks. In practice, single GPCs are selected after exit from the Golgi complex, and their behavior is monitored as described above. At a convenient time (in general when the GPCs are relatively distant from other VSVG–GFP-tagged objects) cells are fixed. Fixation induces a moderate decrease in gfp fluorescence and immediately terminates all movements within the cell (see movie 3.1), but does not cause any detectable change in the structure of the GFP-positive objects. Cells are then immunoperoxidase-labeled for VSVG, embedded in Epon, cut into thick (200 nm) serial sections for EM, and the object of interest is identified as described (Fig. 2 and Materials and Methods).
Experiments were run on GPCs formed either under steady state conditions or after a 20°C block. Fig. 2 shows a GPC that departed from the Golgi in a cell kept at 32°C since transfection (steady state). This GPC detached from a tubule-like structure emanating from the Golgi complex and moved towards the cell periphery along a curvilinear path at a speed of about 0.5 μm/s (movie 2.1) until fixed, 66 s after its appearance (Fig. 2 a). Immunofluorescent staining indicated the absence of lysosomal-endosomal markers within this GPC (data not shown). After immunoperoxidase labeling and Epon embedding, the cell was localized on the CELLocate grid (Fig. 2 c) and the GPC of interest was identified (Fig. 2 b), serial sectioned, and 3D reconstructed (Fig. 2, h–q) using the reasonable assumption that matching immunoperoxidase-stained images in consecutive sections represent continuous structures. The GPC was ∼1,200 nm long and 600 nm wide, and appeared as a slightly flattened sacculus with a short tubular protrusion 100 nm in diameter. Curiously, it was associated with a mitochondrion, although the membranes of both organelles were clearly separated from each other (Fig. 2o and Fig. p), and in some sections it also appeared to be located near the PM (Fig. 2l and Fig. q). The other five GPCs were identified with the same approach; they all ranged from 400–1,700 nm in size and were tubular-saccular in shape. Examples of single sections of the other two GPCs are shown in Fig. 2t and Fig. u. Next, a similar series of observations was made using the 20°C block protocol. At this temperature, no GPCs were seen to depart from the Golgi complex. When cells were shifted to 32°C, three to five GPCs appeared every minute. Fig. 3 summarizes our observations of 2 of 10 intermediates studied. These GPCs departed from the same Golgi area 5 min after the temperature shift. The first appeared ovoid, with a longer diameter of ∼1.2 μm, and moved centrifugally with an average speed of ∼1 μm/s. The second GPC was smaller and displayed significant changes in shape during its movement. It was slower (0.75 μm/s) than the first, and traveled for a longer time. The two intermediates apparently crossed each other's path, and were fixed ∼40 s after formation when they were still close to each other but already clearly separated (movie 3.1; Fig. 3, a and b). As shown in the 3D reconstructions (Fig. 3, i–k) obtained from serial sections (Fig. 3, c–h), the first GPC was a slightly bent 1,600-nm long tubule, with a diameter of ∼250–270 nm, and slightly swollen at its ends. Interestingly, this was the GPC that appeared ovoid by fluorescence microscopy, underscoring the fact that EM is essential to define even the general shape of objects in this size range (Griffiths et al. 1993). The second intermediate had a more complicated morphology. It was an 800-nm long tubule, 250–270 nm in diameter, which continued into a 750-nm long and ∼450-nm wide saccule (Fig. 3, i–k). The other eight GPCs examined with this technique appeared tubular-saccular in shape and varied from 500–1,700 nm in longer diameter. Altogether, there was no significant difference in size and shape between GPCs formed at steady state and after a 20°C block. All GPCs were clearly immunolabeled for VSVG, demonstrating the efficiency of the staining technique.
Figure 3.
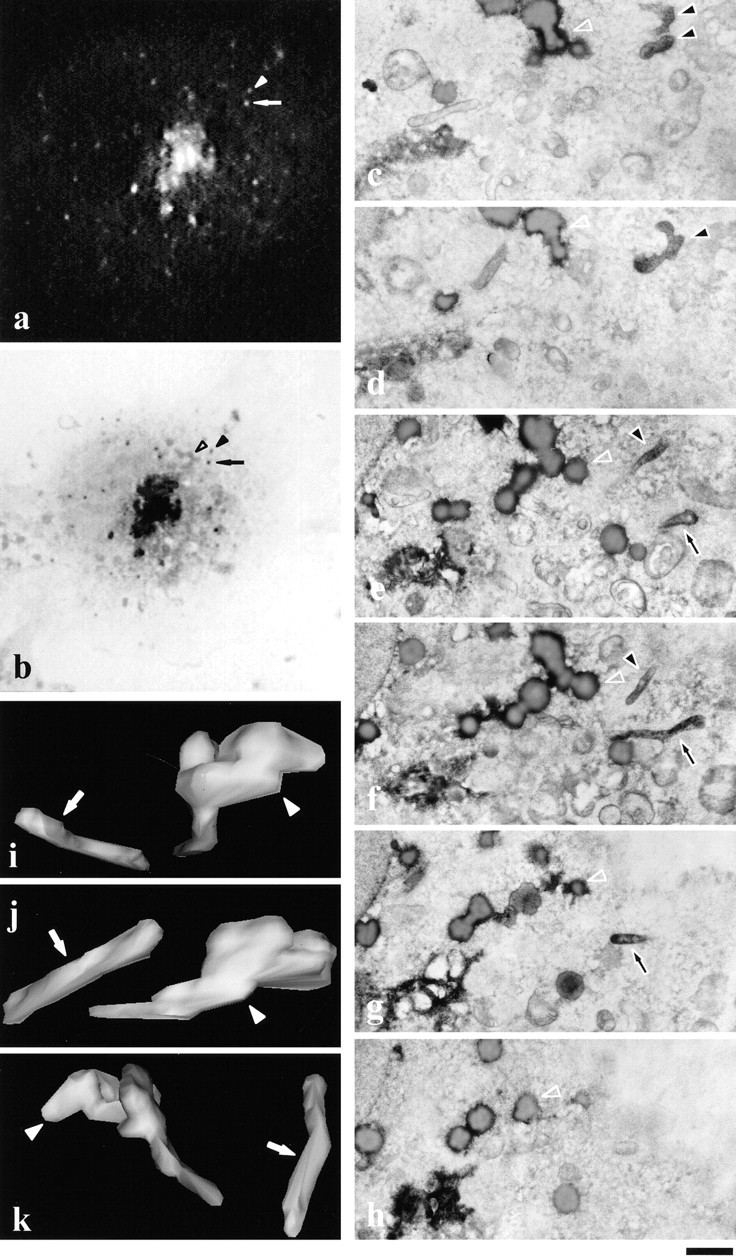
Dynamics and ultrastructure of individual GPCs as determined by correlative light-EM after release from a 20°C block. A VSVG–GFP-expressing COS-7 cell growing on a CELLocate coverslip was observed after 20–32°C shift in vivo using time-lapse confocal microscopy (movie 3.1; a, arrow and arrowhead). Towards the end of the observation period, the cell was fixed and processed for immunoperoxidase labeling. Two GPCs (b, arrow and arrowhead) were identified as the fluorescent GPCs shown in a on the basis of their coordinates. The general pattern of peroxidase labeling coincided with the fluorescence pattern of VSVG–GFP (compare a and b). To confirm this, the inverted fluorescent image of VSVG–GFP-containing GPCs was overlaid on conventional light images to use intracellular structures (open arrowhead in b, apparently an aggregate of osmiophilic lipid droplets; see also c–h) as reference points in the identification of the GPCs. c–h represent consecutive serial 200-nm sections performed almost tangentially to the basal surface of the cell. Both GPCs (filled arrowhead and filled arrow) were identified in serial sections on the basis of VSVG–GFP labeling and their position relative to the aggregate of lipid droplets (b–h, open arrowhead). 3D reconstruction displayed one GPC as a long tubule (i–k, arrow), whereas the other GPC consisted of globular head and tubular tail (i–k, arrowhead). Bar: (a–c) 10 μm; (c–h) 400 nm; and (i–k) 800 nm.
Ultrastructure of the GPCs during Fusion with the PM
As noted above, fusion of a GPC with the PM is assumed to occur when the GPC-associated fluorescence rapidly dissolves in what appears to be the plane of the PM at the light microscopy level (Hirschberg et al. 1998; Toomre et al. 1999; this paper) (see above). However, these images do not allow to formally exclude that the fluorescent VSVG–GFP-containing carriers might fuse with an intracellular organelle close to the PM rather than with the PM itself, or that these carriers might just disappear without in fact fusing, simply because they might move rapidly out of the plane of focus near the cell surface. To address these concerns, we designed experiments to visualize the fusion (disappearance) of the GPCs with the PM by correlative light-EM. Individual GPCs were first followed at the GFP level and then fixed exactly at the time at which they seemed to dissolve/fuse within the PM. In addition, some cells were fixed while the GPC of interest was docked onto the PM after terminating its movement through the cytoplasm but before disappearing/fusing (see above). To examine whether GPC–PM fusion had indeed occurred, cells were exposed to antibodies against the ectodomain of VSVG without previous permeabilization in order to ensure that only VSVG–GFP molecules on the cell surface (as a result of GPC fusion) were detected. Finally, cells were stained by either fluorescent and/or HRP- and/or gold-labeled secondary antibodies. Fig. 4, a–c, shows a cell in which two GPCs were monitored by GFP. The first (arrowhead) moved through the cytosol following an irregular trajectory for 100 s, and then dissolved within the plane of the PM (Fig. 4, a and b; movie 4.2). At this instant, the cell was fixed. The second GPC (arrow) wandered through the cytosol for 80 s before docking to the membrane, then it remained there for 20 s before the cell was fixed, exhibiting the characteristic oscillatory movements of docked GPCs (see above). Cells were then stained by a fluorescent secondary antibody. The image in Fig. 4 c (overlap between green GFP and red anti-VSVG antibody fluorescences), shows that exactly at the site at which the first GPC appeared to dissolve, there was indeed an accumulation of VSVG at the extracellular surface, indicating that this was most likely a true fusion site. A surprising finding was that the second (docked but apparently not yet fused) GPC also became stained by the extracellular anti-VSVG antibody (Fig. 4 c, arrow), suggesting that docked GPCs can establish transient connections with the PM before delivering their content to the cell exterior. This was not a rare event. In fact, staining of docked GPCs was a fairly common observation. In contrast, GPCs in transit in the cytosol never accumulated extracellular anti-VSVG antibody.
Figure 4.
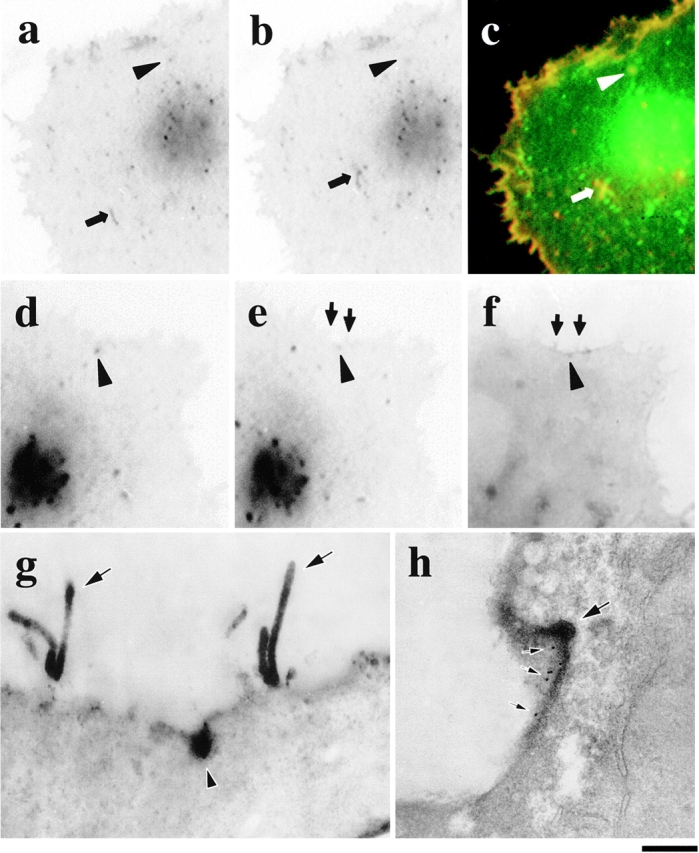
Fusion of GPCs with PM by correlative light-EM. A VSVG–GFP transfected cell (a–c) was fixed exactly when one of the Golgi-derived fluorescent spots (a and b, arrowheads) started to disappear (b, arrowhead; movie 4.2). The cell surface was then labeled without permeabilization using antibodies against the VSVG ectodomain detected by anti–rabbit Cy3-conjugated antibodies (c, red). Both fuzzy- (c, arrowhead) and sharp-appearing (c, arrow) GPCs were accessible by antibodies, suggesting their contact with the PM. The same approach was used to stain another GPC undergoing fusion (movie 6.3; d–g, arrowhead) using HRP-conjugated secondary antibodies. After resin embedding (f) and sectioning (g), the GPC (f and g, arrowhead) could be easily located using the microvilli (e–g, arrows) as reference marks. Double-labeling of VSVG using immunoperoxidase and immunogold protocols shows patches of both HRP labeling and 10-nm gold particles (h, small arrows) at the GPC fusion site (h, arrow). Bar: (a–c) 9.5 μm; (d–f) 7.5 μm; (g) 930 nm; and (h) 480 nm.
The ultrastructure of the fusing carriers was then determined by immunoperoxidase labeling and EM. Cells were treated as above and then further exposed to HRP-conjugated antibodies against the secondary antibody used for VSVG immunofluorescence. Fig. 4d and Fig. e, shows a fluorescent GPC fusing with the PM at the cell edge (movie 4.3) at both the light microscopy (Fig. 4, d–f), and EM (Fig. 4 g) levels. The fusing GPC has the appearance of a roundish structure 400 nm in diameter lacking a visible coat or escorting vesicles from which HRP-labeled content appears to diffuse away along the plane of the PM. The other four GPCs were analyzed in the same way, and exhibited similar structures. Curiously, two neighboring microvilli also intensely stained for VSVG. The propensity of microvilli to accumulate secreted VSVG has been reported previously; however, the reasons of this phenomenon remain unknown (Brown and Salomonsky 1985). To ensure that the stain on the PM was not due to artifactual diffusion of the HRP reaction product, these experiments were also performed by combining HRP and immunogold labeling protocols (see Materials and Methods). An example is shown in Fig. 4 h. Again, the GPC fusion site and the neighboring surface exhibited strong HRP staining, and in addition, a density of gold particles much higher than in the rest of the PM (Fig. 4 h). Finally, the organization of fusion sites was also studied by a combination of GFP technology and scanning EM. The GPC in Fig. 5, a–e, was monitored from formation until fusion/disappearance in the PM (movie 5.1). Cells were fixed, immunogold-labeled with antibodies against the lumenal domain of VSVG, and prepared for scanning EM (see Materials and Methods) (Fig. 5 f). The site where the GPC had dissolved contained a much higher concentration of gold particles than the rest of the PM (Fig. 5 g), confirming that this was a bona fide fusion with the PM. The only structural feature presented by such sites was a slight roundish invagination (∼400 nm in diameter) of the cell surface. In conclusion, collectively, our observations demonstrate that the intermediates forming from the Golgi complex indeed fuse directly with the PM, and therefore represent fine GPCs.
Figure 5.
Visualization of a GPC fusion site using scanning EM. Formation, movement, and fusion of GPC (a–e, arrowheads; movie 7.1) was observed under the confocal microscope within a small region (a, black rectangle) of a VSVG–GFP transfected cell. The cell was fixed exactly at the moment of GPC fusion with the PM. The cell surface was then labeled without permeabilization using antibodies against the VSVG ectodomain, and subsequently with protein A conjugated with 30 nm gold, and prepared for scanning EM. The same cell (f, arrows) was identified on the CELLocate grid (the total area shown in a is displayed by the dashed line). g shows the area (indicated by the small white rectangle in f) where GPC fusion occurred. The patch of gold particles lying within the flattened invagination of the cell surface (g, arrowheads) is the GPC fusion site indicated in e (arrowheads). Bar: (a) 9.2 μm; (b–e) 4.2 μm; (f) 10.4 μm; and (g) 410 nm.
Independence of GPC Ultrastructure from Type and Concentration of Cargo
The demonstration that GPCs are generally larger than a traditional transport vesicle and have tubular-saccular shapes might raise questions as to whether the large GPCs we observe are physiological. For instance, it might be objected that these GPCs might result from a distortion and enlargement of a small vesicular carrier due to an excessive concentration of transfected VSVG–GFP, a large transmembrane cargo protein. To address this concern, we adopted two approaches: (a) to measure the density of VSVG–GFP in the GPC membrane; and (b) to carry out similar experiments using a different soluble secretory protein to tag GPCs. The correlative microscopy approach makes it possible to calculate the density of VSVG–GFP in GPCs, since the surface area of a GPC can be estimated from 3D reconstruction data, and the number of molecules of VSVG–GFP (3,000) in a given GPC can be measured from the integrated fluorescence of the GPC using commercial S65T–GFP as a standard (see Materials and Methods). The GPC analyzed in Fig. 2 turns out to have a surface area of 3.2 μm2 and contains 7,000 VSVG molecules. Therefore, the overall density is about one VSVG trimer per 1,370 nm2. It has been calculated that the lipidic annulus around a membrane protein measures ∼25 nm2 (Hirschberg et al. 1998); even adding to this the transmembrane domains of the VSVG trimer, this surface represents a small fraction (∼3%) of the 1,370 nm2 available to each trimer. This is not a concentration that would be expected to perturb the geometry of a carrier. For comparison, the concentration of a single protein such as band 3 protein or glycophorin in the erythrocyte membrane is sixfold higher than that of VSVG in a GPC (∼1 dimer per 200 nm2). Finally, an empirical confirmation that the concentration of VSVG–GFP does not affect the geometry of its carriers comes from the fact that GPCs in cells with lower levels of VSVG expression than that in Fig. 2 have the same pleomorphic shapes. For the second approach, we made use of the soluble sTrop2-GFP secretory chimera (Alberti et al. 1992; El Sewedy et al. 1998). sTrop2-GFP was accumulated in the TGN at 20°C, released by shifting the temperature to 32°C, and monitored by time-lapse confocal microscopy and correlative microscopy. Neither the in vivo dynamics nor the ultrastructure of the sTrop2-GFP–containing TIs differed significantly from those carrying VSVG–GFP. Thus, the tubular-saccular structures of the GPCs observed in this study do not depend on the level or the type of transfected cargo, and therefore presumably represent physiological GPCs.
Ultrastructure of the Golgi Complex and of GPCs by Traditional Thin Sectioning and EM
Having established the general structure and dynamics of the GPCs, we wished to define their morphology and relationships with other organelles with a higher degree of detail using thin (40–60 nm) sections. Since our current correlative microscopy protocol does not allow for such sections, we resorted to a traditional 20°C block protocol followed by fixation and immunoperoxidase labeling at various times after the shift to 32°C. Fig. 6 a confirms that, as expected, cargo protein was retained in the Golgi at 20°C. Interestingly, it was present not only in the TGN but also in medial and trans-cisternae. The cis-Golgi, ER, and PM were unlabeled. After 5–10 min from shift to 32°C, numerous VSVG-labeled objects appeared throughout the cytoplasm. As described in detail below, the overall size and shape of these bodies was tubular-saccular, similar to the GPCs identified by correlative microscopy. Therefore, we assume that they are GPCs. Concurrent with GPC formation, the Golgi complex decreased in label intensity (Fig. 6 b). However, the trans components of the stacks remained stained for up to 30 min after warm-up (data not shown). In single sections, the GPCs appeared as long tubules with diameters of 50–250 nm (Fig. 6, b–f) or as clusters of tubules. GPCs were similar in cells whether or not they had undergone a 20°C block (Fig. 6 c). Some round profiles, most likely cross-sectioned tubules (see below), and saccular structures were also visible (Fig. 6 d). A potentially important observation was that a fraction of the GPCs was closely associated with endosomes (data not shown). However, since no unequivocal continuities between the two structures were established, the relevance of such contacts remains unclear. Some GPCs were located near the trans-most Golgi cisterna (Fig. 6b and Fig. c). Occasionally, stained GPC-like bodies appeared connected with the PM. At first look, these structures might be either GPCs undergoing fusion, like those seen by correlative light-EM, or alternatively, endocytic tubules containing VSVG (Fig. 6f and Fig. g). However, the latter case can be excluded based on experiments with the endocytic markers WGA, AlloA lectins, and cationized gold. When these gold-labeled tracers were added before release from the 20°C block, the gold particles were found on the cell surface, in clathrin-coated vesicles, some tubules, and multivesicular bodies (Fig. 6 e). However, they were never seen in GPCs or in VSVG-positive membrane-connected tubules (Fig. 6 e). Thus, the images in Fig. 6f and Fig. g, most likely correspond to GPCs fusing with the PM. When serial sections were used for 3D reconstruction, many of the GPCs that appeared in single sections as tubules (Fig. 7, a–h) were shown to be in fact flat, cisterna-like saccules (Fig. 7i and Fig. j). However, other GPCs were actual tubules. Tubular-saccular shapes were the most frequent. As noted above, GPCs resembled the tubular-saccular TGN membranes and were sometimes located in areas where the TGN had the so-called peeling-off appearance (Ladinsky et al. 1994; Clermont et al. 1995). Thus, serial sections were necessary to tell whether the structures stained for VSVG belonged to the TGN or were detaching GPCs. Stained bona fide vesicles (defined as round profiles not flanked by matching images in the two adjacent sections) were virtually absent. Many nonstained vesicles could instead be seen surrounding the Golgi stacks (Fig. 6 c), indicating, incidentally, that our fixation procedure preserves vesicular structures.
Figure 6.
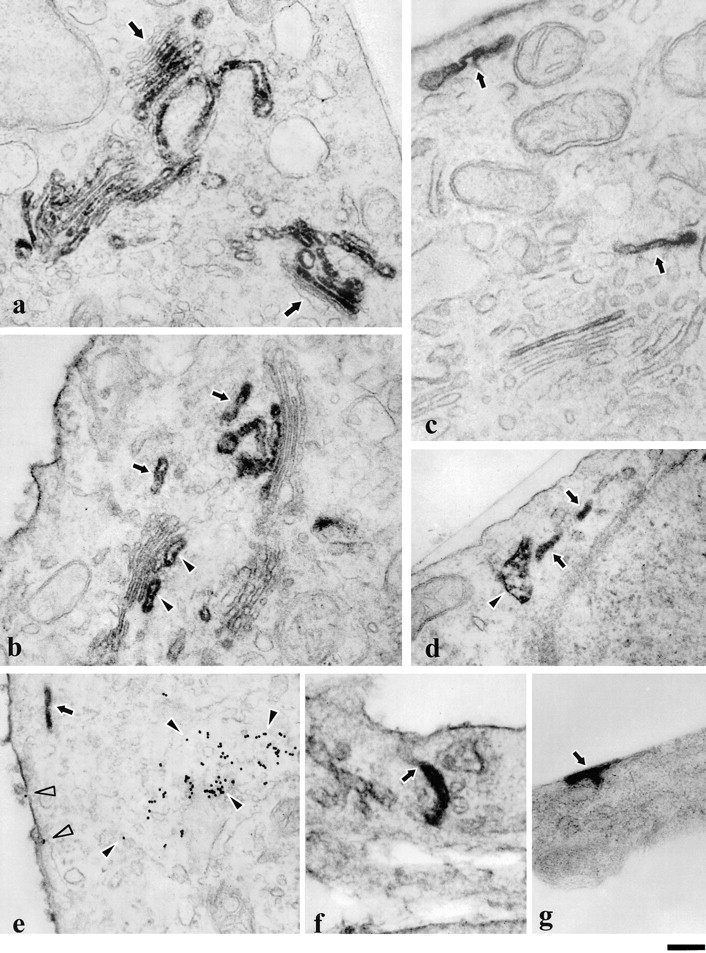
Ultrastructure of VSVG–GFP and VSVG containing GPCs. Cells transfected with VSVG–GFP (a and b) or infected with ts-045 VSV (c–g) were fixed and prepared for immunoelectron microscopy using antibodies against the lumenal domain of VSVG. During the 20°C block, VSVG–GFP accumulated in the TGN and in the medial and trans-cisternae of the Golgi stack, whereas the cis compartment remained unstained (a, arrows). Upon warm-up from 20 to 32°C, VSVG–GFP labeling was found not only in the trans-most cisternae of the Golgi (b, arrowheads) and the TGN, but also in tubular structures (b, arrows) detached from the Golgi stack. The PM was also labeled. The same type of labeled tubular structures (arrows) positioned near the PM or Golgi stack were also visible in the cells shifted for 50 min from 40 to 32°C (c) without a 20°C block. Peripheral GPCs appeared both as elongated (d, arrows) or saccular structures (d, arrowhead). To check for colocalization with the endocytic structures, cells were labeled with anti-VSVG antibodies after uptake of WGA-gold conjugate as an endocytosis marker (e). It is evident that no endocytic tracer was found within the GPC (e, arrow), whereas the PM (e, empty arrowheads) and multivesicular body (e, filled arrowheads) were labeled with WGA-gold. Some VSVG-positive tubules (f, arrow) appeared to be connected to the PM. In some cases, an intensely labeled area appeared on the cell surface (g, arrow) presumably in relation to GPC fusion sites. Bar: (a, b, d, e, and g) 500 nm; and (c and f) 400 nm.
Figure 7.

3D reconstruction of GPCs. Cells were treated as in Fig. 4. VSVG-labeled structures in 50-nm serial sections were photographed and digitized for 3D reconstruction. a–h show eight consecutive serial sections of the GPC of interest. i and j depict the surface of the GPC (green) and its relationship to the PM (red) at two different angles. Although in each single section the GPC appeared as a tubule (arrows), 3D reconstruction revealed the GPC as a flattened sacculus positioned parallel to the PM. Bar: (a–h) 500 nm; and (i–j) 200 nm.
Discussion
This paper provides the first ultrastructural analysis of transport intermediates, in this case GPCs, fixed at a time chosen by the experimenter while monitoring the in vivo dynamics of these carriers by time-lapse confocal microscopy. GPCs turn out to be pleomorphic, often very large, and to fuse en bloc with the PM.
Two lines of evidence indicate that the tubular-saccular GPCs are major mediators of constitutive traffic between the Golgi and the PM. First, the amount of VSVG–GFP transported out of the Golgi complex by GPCs in MT-dependent fashion accounts for most (∼60%) of the rate of loss of VSVG–GFP from the Golgi complex. Second, other potential VSVG-containing carriers, such as small transport vesicles, are not detected by immunoelectron microscopy. It cannot be excluded that such vesicles exist and remain unlabeled; however, given the high efficiency with which tubular-saccular GPCs label for VSVG in our experiments (all of the GPCs analyzed by correlative microscopy were found to be stained), this appears unlikely. How do we account for the fraction (40%) of traffic not explained by the GPCs we observe? Our hypothesis is that there are other GPCs that cannot be seen because they reach the PM in areas lying just over or below the Golgi complex, where they are masked by the fluorescent Golgi mass. This idea is supported by the observation that some GPCs remain close to the Golgi apparatus after formation, presumably because they do not dock on MT-based motors. They might thus belong to a subpopulation of carriers that functions in an MT-independent pathway. This hypothesis would also explain the ability of cells to secrete VSVG in the absence of MTs (Lippincott-Schwartz 1998), since an MT-independent pathway might be able to absorb the extra load caused by the loss of the MTs in nocodazole-treated cells.
How does our finding that GPCs are large and tubular-saccular relate to the published literature on TGN-to-PM transport? In vitro studies generally describe the TGN-derived transport intermediates as vesicular. However, the morphology of in vitro isolated intermediates depends on the experimental conditions. These studies are based on incubations with cytosol (Salamero et al. 1990; Van der Sluijs et al. 1990; Musch et al. 1997) in the presence of GTP or its nonhydrolyzable analogues such as GTPγS (for review see Keller and Simons 1997). When GTP was used, the intermediates were found to be membrane fragments of irregular shape, without a distinct coat, and with diameters ranging from 50–200 nm (Salamero et al. 1990; Van der Sluijs et al. 1990). This is surprising for bona fide vesicles, which should have a uniform size and a spherical shape (Musch et al. 1997). Therefore, the in vitro TGN-derived vesicular structures might result from the breakdown of tubular-saccular GPCs during isolation (indeed, mechanical stress is deleterious to tubulated structures and may lead to their fragmentation; see Hopkins et al. 1990). When experiments were carried out in the presence of GTPγS, the TGN-derived carriers had, instead, the appearance of round coated vesicles (Musch et al. 1997). However, the irreversible activation of G proteins is known to produce nonphysiological events. In permeabilized cells, for instance, in the presence of irreversibly activated Sar1p, the intermediates derived from the ER acquire the semblance of strings of coated vesicles interconnected with each other and with the ER itself (Bannykh et al. 1997). Such structures are never observed in living cells. A similar phenomenon has been reported for Golgi membranes treated with GTPγS (Weidman et al. 1993). Thus, the formation of strings of vesicles might reflect the irreversible binding of coat proteins to the tubular-saccular GPCs. In conclusion, we think that the available in vitro data are compatible with our evidence on the ultrastructure of GPCs in vivo.
As for the GFP-based studies of VSVG transport to the PM (Hirschberg et al. 1998; Toomre et al., 1998; this paper), our observations demonstrate that the fluorescent carriers described by these authors correspond to tubular-saccular structures and do not comprise clusters of vesicles. Other authors (Nakata et al. 1998), as noted above, have reported that apically-directed carriers in axons appear tubular-vesicular in single EM sections. The 3D structure of these neuronal carriers remains undefined; however, it is plausible that they would appear tubular-saccular in 3D reconstructions. Thus, the tubular-saccular geometry of GPCs is likely to be a feature of GPCs in many cells.
Such a geometry raises interesting mechanistic questions. Whereas the molecular mechanisms underlying the formation of coated vesicles have been largely understood, the process through which a GPC, a tubular-saccular body of a size between one twentieth and one half that of a Golgi cisterna, detaches from the TGN represents a new question. Perhaps GPCs derive from the fusion of vesicles budded from the TGN in a fashion similar to that proposed for the formation of Golgi-directed tubular-vesicular carriers from the ER (Bannykh and Balch 1997). Alternatively, and in our opinion more likely, GPCs might originate via a mechanism (for reviews see Glick and Malhotra 1998; Mironov et al. 1998) involving the controlled drawing out and then progressive breakdown of TGN material from the Golgi body. The latter view appears more consistent with the available light microscopy observations (Hirschberg et al. 1998; this paper) and with EM pictures suggesting that secretion involves the peeling off of TGN elements from the Golgi complex (Clermont et al. 1995). If this view is correct, the formation of a GPC would appear to be more similar to that of a secretory granule rather than that of a transport vesicle. In addition, the occasional presence of γ-adaptin on GPCs could be considered as an indication that the biogenesis of these intermediates, like that of granules (Arvan and Castle 1998), requires maturation of TGN membranes via clathrin-dependent removal of proteins not destined for constitutive secretion (Glick and Malhotra 1998; Mironov et al. 1998). Further work is needed to establish which of the above two models of GPC biogenesis is more satisfactory.
Some novel interesting features of GPCs have also emerged from the analysis of their fusion with the PM. GPCs fuse with the PM directly and en bloc, without any previous dramatic shape change or breakdown into small fragments. Fusion is preceded, in many cases, by a period of up to minutes during which GPCs are tethered or docked to the PM (Toomre et al. 1999) and exhibit frequent oscillations. A similar prefusion behavior has been reported in the case of secretory granules, and might be related to events preparing the carrier for the final fusion step (Steyer et al. 1997). However, some GPCs end their run through the cytosol by directly and immediately dissolving in the PM. These carriers might be already mature for fusion when they contact the cell surface. Also, some docked GPCs appear to establish continuity with the extracellular space before completing fusion and cargo secretion. This behavior occurs in ∼50% of the cases, and again, has been described previously for secretory granules. It might be due to transient, intermittent openings of the fusion pores between GPCs and PM, a phenomenon called flickering, extensively characterized in the case of granules in mast cells (Monck and Fernandez 1996). Finally, we note that our observation that GPCs discharge cargo directly onto the PM does not appear to support the idea proposed earlier, that constitutive cargo transits through the endocytic compartment (Sariola et al. 1995) (also, colocalization of VSVG–GFP with endocytic tracers has been reported recently by Toomre et al. [1998]). However, we find that GPCs can make close contacts with endosomes. Thus, it remains possible that at least part of the cargo might enter endocytic structures through transient interactions between the two organelles.
Acknowledgments
We thank H.-P. Hauri, J. Lippincott-Schwartz, K. Simons, T. Braulke, C. Isidoro, B. Goud, and J. Rose for the generous gift of antibodies and cDNAs; Dr. C.P. Berrie for critical reading of the manuscript; and A. Sese for technical assistance with the confocal microscope.
This research was supported by a grant to A. Luini from the Italian Association for Cancer Research (AIRC) (Consiglio Nazionale delle Ricerche, Contract 980068104 and P.F. Biotecnologie Contract 99.00133.49), and by a grant to A.A. Mironov from Telethon (E.1105). R.S. Polishchuk was the recipient of an Alfredo Leonardi Fellowship. P. Marra was supported by a fellowship from Federazione Italiana Ricerca sul Cancro.
Footnotes
R.S. Polishchuk and E.V. Polishchuk contributed equally to this paper.
Abbreviations used in this paper: 3D, three-dimensional; GFP, green fluorescent protein; GPC, Golgi-to-PM carrier; MT, microtubule; PM, plasma membrane; TI, transport intermediate; VSVG, vesicular stomatitis virus G protein; WGA, wheat germ agglutinin.
References
- Alberti S., Miotti S., Stella M., Klein C.E., Fornaro M., Menard S., Colnaghi M.I. Biochemical characterization of Trop-2, a cell surface molecule expressed by human carcinomasformal proof that the monoclonal antibodies T16 and MOv-16 recognize Trop-2. Hybridoma. 1992;11:539–545. doi: 10.1089/hyb.1992.11.539. [DOI] [PubMed] [Google Scholar]
- Arvan P., Castle D. Sorting and storage during secretory granule biogenesislooking backward and looking forward. Biochem. J. 1998;332:593–610. doi: 10.1042/bj3320593. [DOI] [PMC free article] [PubMed] [Google Scholar]
- Bannykh S.I., Balch W.E. Membrane dynamics at the endoplasmic reticulum–Golgi interface. J. Cell Biol. 1997;138:1–4. doi: 10.1083/jcb.138.1.1. [DOI] [PMC free article] [PubMed] [Google Scholar]
- Bannykh S.I., Rowe T., Balch W.E. The organization of endoplasmic reticulum export complexes. J. Cell Biol. 1997;135:19–35. doi: 10.1083/jcb.135.1.19. [DOI] [PMC free article] [PubMed] [Google Scholar]
- Bergmann J.E. Using temperature-sensitive mutants of VSV to study membrane protein biogenesis. Methods Cell Biol. 1989;32:85–110. doi: 10.1016/s0091-679x(08)61168-1. [DOI] [PubMed] [Google Scholar]
- Bonfanti L., Mironov A.A., Jr., Martinez-Menarguez J.A., Martella O., Fusella A., Baldassarre M., Buccione R., Geuze H.J., Mironov A.A., Luini A. Procollagen traverses the Golgi stack without leaving the lumen of cisternaeevidence for cisternal maturation. Cell. 1998;95:993–1003. doi: 10.1016/s0092-8674(00)81723-7. [DOI] [PubMed] [Google Scholar]
- Brown J.C., Salomonsky N.L. Site-specific maturation of enveloped viruses in L cells treated with cytochalasin B. J. Cell Biol. 1985;100:357–363. doi: 10.1083/jcb.100.2.357. [DOI] [PMC free article] [PubMed] [Google Scholar]
- Clermont Y., Rambourg A., Hermo L. Trans-Golgi network (TGN) of different cell typesthree-dimensional structural characteristics and variability. Anat. Rec. 1995;242:289–301. doi: 10.1002/ar.1092420302. [DOI] [PubMed] [Google Scholar]
- El Sewedy T., Fornaro M., Alberti S. Cloning of the murine TROP2 geneconservation of a PIP2-binding sequence in the cytoplasmic domain of TROP-2. Int. J. Cancer. 1998;75:324–330. doi: 10.1002/(sici)1097-0215(19980119)75:2<324::aid-ijc24>3.0.co;2-b. [DOI] [PubMed] [Google Scholar]
- Gallione C.J., Rose J.K. A single amino acid substitution in a hydrophobic domain causes temperature-sensitive cell-surface transport of a mutant viral glycoprotein. J. Virol. 1985;54:374–382. doi: 10.1128/jvi.54.2.374-382.1985. [DOI] [PMC free article] [PubMed] [Google Scholar]
- Glick B.S., Malhotra V. The curious status of the Golgi apparatus. Cell. 1998;95:883–889. doi: 10.1016/s0092-8674(00)81713-4. [DOI] [PubMed] [Google Scholar]
- Griffiths G., Pfeiffer S., Simons K., Matlin K. Exit of newly synthesized membrane proteins from the trans cisterna of the Golgi complex to the plasma membrane. J. Cell Biol. 1985;101:949–964. doi: 10.1083/jcb.101.3.949. [DOI] [PMC free article] [PubMed] [Google Scholar]
- Griffiths G., Parton R.G., Lucocq J., van Deurs B., Brown D., Slot J.W., Geuze H.J. The immunofluorescent era of membrane traffic. Trends Cell Biol. 1993;3:214–219. doi: 10.1016/0962-8924(93)90114-g. [DOI] [PubMed] [Google Scholar]
- Heim R., Tsien R.Y. Engineering green fluorescent protein for improved brightness, longer wavelengths and fluorescence resonance energy transfer. Curr. Biol. 1996;6:178–182. doi: 10.1016/s0960-9822(02)00450-5. [DOI] [PubMed] [Google Scholar]
- Hirschberg K., Miller C.M., Ellenberg J., Presley J.F., Siggia E.D., Phair R.D., Lippincott-Schwartz J. Kinetic analysis of secretory protein traffic and characterization of Golgi to plasma membrane transport intermediates in living cells. J. Cell Biol. 1998;143:1485–1503. doi: 10.1083/jcb.143.6.1485. [DOI] [PMC free article] [PubMed] [Google Scholar]
- Hopkins C.R., Gibson A., Shipman M., Miller K. Movement of internalized ligand-receptor complexes along a continuous endosomal reticulum. Nature. 1990;346:335–339. doi: 10.1038/346335a0. [DOI] [PubMed] [Google Scholar]
- Keller P., Simons K. Post-Golgi biosynthetic trafficking. J. Cell Sci. 1997;110:3001–3009. doi: 10.1242/jcs.110.24.3001. [DOI] [PubMed] [Google Scholar]
- Ladinsky M.S., Kremer J.R., Furcinitti P.S., McIntosh J.R., Howell K.E. HVEM tomography of the trans-Golgi networkstructural insights and identification of a lace-like vesicle coat. J. Cell Biol. 1994;127:29–38. doi: 10.1083/jcb.127.1.29. [DOI] [PMC free article] [PubMed] [Google Scholar]
- Lippincott-Schwartz J. Cytoskeletal proteins and Golgi dynamics. Curr. Opin. Cell Biol. 1998;10:52–59. doi: 10.1016/s0955-0674(98)80086-0. [DOI] [PubMed] [Google Scholar]
- Mironov A.A., Weidman P., Luini A. Variations on the intracellular transport themematuring cisternae and trafficking tubules. J. Cell Biol. 1997;138:481–484. doi: 10.1083/jcb.138.3.481. [DOI] [PMC free article] [PubMed] [Google Scholar]
- Mironov A.A., Luini A., Buccione R. Constitutive transport between the trans-Golgi network and the plasma membrane according to the maturation model. A hypothesis. FEBS Lett. 1998;440:99–102. doi: 10.1016/s0014-5793(98)01439-2. [DOI] [PubMed] [Google Scholar]
- Monck J.R., Fernandez J.M. The fusion pore and mechanisms of biological membrane fusion. Curr. Opin. Cell Biol. 1996;8:524–533. doi: 10.1016/s0955-0674(96)80031-7. [DOI] [PubMed] [Google Scholar]
- Murphy R.F., Schmid J., Fuchs R. Endosome maturationinsights from somatic cell genetics and cell-free analysis. Biochem. Soc. Trans. 1993;21:716–720. doi: 10.1042/bst0210716. [DOI] [PubMed] [Google Scholar]
- Musch A., Cohen D., Rodriguez-Boulan E. Myosin II is involved in the production of constitutive transport vesicles from the TGN. J. Cell Biol. 1997;138:291–306. doi: 10.1083/jcb.138.2.291. [DOI] [PMC free article] [PubMed] [Google Scholar]
- Nakata T., Terada S., Hirokawa N. Visualization of the dynamics of synaptic vesicle and plasma membrane proteins in living axons. J. Cell Biol. 1998;140:659–674. doi: 10.1083/jcb.140.3.659. [DOI] [PMC free article] [PubMed] [Google Scholar]
- Pelham H.R. SNAREs and the organization of the secretory pathway. Eur. J. Cell Biol. 1997;74:311–314. [PubMed] [Google Scholar]
- Polishchuk R.S., Polishchuk E.V., Mironov A.A. Coalescence of Golgi fragments in microtubule-deprived living cells. Eur. J. Cell Biol. 1999;78:170–185. doi: 10.1016/S0171-9335(99)80096-X. [DOI] [PubMed] [Google Scholar]
- Presley J.F., Cole N.B., Schroer T.A., Hirschberg K., Zaal K.J., Lippincott-Schwartz J. ER-to-Golgi transport visualized in living cells. Nature. 1997;389:81–85. doi: 10.1038/38001. [DOI] [PubMed] [Google Scholar]
- Rothman J.E., Wieland F.T. Protein sorting by transport vesicles. Science. 1996;272:227–234. doi: 10.1126/science.272.5259.227. [DOI] [PubMed] [Google Scholar]
- Salamero J., Sztul E.S., Howell K.E. Exocytic transport vesicles generated in vitro from the trans-Golgi network carry secretory and plasma membrane proteins. Proc. Natl. Acad. Sci. USA. 1990;87:7717–7721. doi: 10.1073/pnas.87.19.7717. [DOI] [PMC free article] [PubMed] [Google Scholar]
- Sariola M., Saraste J., Kuismanen E. Communication of post-Golgi elements with early endocytic pathwayregulation of endoproteolytic cleavage of Semliki Forest virus p62 precursor. J. Cell Sci. 1995;108:2465–2475. doi: 10.1242/jcs.108.6.2465. [DOI] [PubMed] [Google Scholar]
- Scales S.J., Pepperkok R., Kreis T.E. Visualization of ER-to-Golgi transport in living cells reveals a sequential mode of action for COPII and COPI. Cell. 1997;90:1137–1148. doi: 10.1016/s0092-8674(00)80379-7. [DOI] [PubMed] [Google Scholar]
- Schekman R., Orci L. Coat proteins and vesicle budding. Science. 1996;271:1526–1533. doi: 10.1126/science.271.5255.1526. [DOI] [PubMed] [Google Scholar]
- Schekman R., Mellman I. Does COPI go both ways? Cell. 1997;90:197–200. doi: 10.1016/s0092-8674(00)80326-8. [DOI] [PubMed] [Google Scholar]
- Sciaky N., Presley J., Smith C., Zaal K.J., Cole N., Moreira J.E., Terasaki M., Siggia E., Lippincott-Schwartz J. Golgi tubule traffic and the effects of brefeldin A visualized in living cells. J. Cell Biol. 1997;139:1137–1155. doi: 10.1083/jcb.139.5.1137. [DOI] [PMC free article] [PubMed] [Google Scholar]
- Steyer J.A., Horstmann H., Almers W. Transport, docking and exocytosis of single secretory granules in live chromaffin cells. Nature. 1997;388:474–478. doi: 10.1038/41329. [DOI] [PubMed] [Google Scholar]
- Toomre D., Keller P., White J., Olivo J.C., Simons K. Dual-color visualization of trans-Golgi network to plasma membrane traffic along microtubules in living cells. J. Cell Sci. 1999;112:21–33. doi: 10.1242/jcs.112.1.21. [DOI] [PubMed] [Google Scholar]
- Van der Sluijs P., Bennett M.K., Antony C., Simons K., Kreis T.E. Binding of exocytic vesicles from MDCK cells to microtubules in vitro. J. Cell Sci. 1990;95:545–553. doi: 10.1242/jcs.95.4.545. [DOI] [PubMed] [Google Scholar]
- Wacker I., Kaether C., Kromer A., Migala A., Almers W., Gerdes H.H. Microtubule-dependent transport of secretory vesicles visualized in real time with a GFP-tagged secretory protein. J. Cell Sci. 1997;110:1453–1463. doi: 10.1242/jcs.110.13.1453. [DOI] [PubMed] [Google Scholar]
- Weidman P. Anterograde transport through the Golgi complexdo Golgi tubules hold the key? Trends Cell Biol. 1995;5:302–305. doi: 10.1016/s0962-8924(00)89046-7. [DOI] [PubMed] [Google Scholar]
- Weidman P., Roth R., Heuser J. Golgi membrane dynamics imaged by freeze-etch electron microscopyviews of different membrane coatings involved in tubulation versus vesiculation. Cell. 1993;75:123–133. [PubMed] [Google Scholar]