A Dual Role for Src Homology 2 Domain–Containing Inositol-5-Phosphatase (Ship) in Immunity: Aberrant Development and Enhanced Function of B Lymphocytes in Ship−/− Mice (original) (raw)
Abstract
In this report, we demonstrate that the Src homology 2 domain–containing inositol-5-phosphatase (SHIP) plays a critical role in regulating both B cell development and responsiveness to antigen stimulation. SHIP−/− mice exhibit a transplantable alteration in B lymphoid development that results in reduced numbers of precursor B (fraction C) and immature B cells in the bone marrow. In vitro, purified SHIP−/− B cells exhibit enhanced proliferation in response to B cell receptor stimulation in both the presence and absence of Fcγ receptor IIB coligation. This enhancement is associated with increased phosphorylation of both mitogen-activated protein kinase and Akt, as well as with increased survival and cell cycling. SHIP−/− mice manifest elevated serum immunoglobulin (Ig) levels and an exaggerated IgG response to the T cell–independent type 2 antigen trinitrophenyl Ficoll. However, only altered B cell development was apparent upon transplantation into nonobese diabetic–severe combined immunodeficient (NOD/SCID) mice. The in vitro hyperresponsiveness, together with the in vivo findings, suggests that SHIP regulates B lymphoid development and antigen responsiveness by both intrinsic and extrinsic mechanisms.
Keywords: signal transduction, B cell receptor, FcγRIIB, immunoglobulin, antigen response
Introduction
Src homology (SH) 2 domain–containing inositol-5-phosphatase (SHIP) was initially identified as a 145- kD protein that becomes tyrosine phosphorylated and associated with Shc after stimulation of numerous cytokine receptors, as well as the B cell receptor (BCR) and the TCR 1. The cDNA was cloned independently by three groups, and was found to encode a protein with an NH2-terminal SH2 domain, a central 5-phosphatase domain, two NPXY sequences that can bind phosphotyrosine domains when phosphorylated, and a proline-rich COOH terminus 2 3 4. Numerous smaller isoforms of SHIP, arising as a consequence of both differential splicing and proteolytic digestion, are detected in various cell populations depending on the cell type and stage of maturation 5 6. SHIP specifically recognizes and cleaves the 5′ phosphate group from phosphatidylinositol–3,4,5-trisphosphate (PIP3), the product of phosphatidylinositol 3-kinase 7 and, at least in vitro, from inositol-1,3,4,5-tetrakisphosphate 3.
Limited data exist regarding the expression of SHIP at various stages of B and T cell development. In the murine thymus, SHIP expression can be detected by FACS® in the single positive CD4+ and CD8+ populations, and at a lower level in the double positive population 8. Similar expression studies have also revealed the presence of SHIP in single positive T cells isolated from human adult bone marrow, suggesting that SHIP expression in the T cell lineage is higher in more mature populations 9. In contrast, SHIP appears to be expressed throughout B cell development in both mice and humans, although the relative levels of expression have yet to be determined 8 9. These observations suggest that SHIP may be important in B cell development and in the function of both mature B and T cells.
In this regard, SHIP has been shown to play a major role in the attenuation of BCR signaling 10 11. Immune complex binding coligates the BCR and the low-affinity IgG receptor FcγRIIB, resulting in a decrease in calcium influx 12, decreased B cell proliferation 13 14, and increased apoptosis of mature B cell populations 15 16. Under these conditions, phosphorylated SHIP associates with the immunoreceptor tyrosine–based inhibitory motif of FcγRIIB 17 18. In addition, in vitro studies suggest that SHIP becomes tyrosine phosphorylated, albeit to a lesser extent, with BCR activation alone 19 20. After activation, SHIP associates with Shc and Grb2 to form a ternary complex that may serve to localize SHIP to the plasma membrane 21. Taken together, these biochemical studies suggest that SHIP may be involved in both the activating and inhibitory BCR signaling pathways.
Functional studies with the avian leukosis virus–transformed bursal B cell line DT40 22 provided initial insights into the role of SHIP in B cells. Targeted disruption of SHIP in these cells prevents the FcγRIIB-mediated inhibition of calcium influx, suggesting that SHIP is the dominant mediator of the negative signals associated with FcγRIIB coligation 10. Paradoxically, after coligation of BCR and FcγRIIB, these SHIP−/− DT40 cells also exhibit reduced proliferation and increased apoptosis 10 compared with SHIP-expressing cells, despite enhanced phosphorylation and activation of the serine/threonine kinase Akt (protein kinase B [23]). The DT40 cell line has also been used to provide evidence that SHIP is involved in regulating activation signals through the BCR. SHIP−/− DT40 cells demonstrate increased intracellular Ca2+ levels 24, increased membrane association of Btk 25, and enhanced Akt phosphorylation and activation 23 compared with SHIP+/+ cells after BCR stimulation. These observations suggest that SHIP may play a critical role in establishing the thresholds for BCR signaling under both activating and inhibitory conditions.
Recombination activating gene (RAG) chimeric mice generated with SHIP+/− and SHIP−/− embryonic stem cells have been used as a starting point to further address these issues in the context of primary B cells. In this model, proliferation of mature SHIP−/− B cells was greater than SHIP+/− B cells under inhibitory (intact antibody resulting in FcγRIIB coligation) conditions, but not after BCR activation with a F(ab′)2 fragment 26. This increased proliferation correlated with enhanced levels of intracellular calcium and increased mitogen-activated protein kinase (MAPK) phosphorylation, consistent with the DT40 studies.
To examine the role of SHIP in vivo, we have carried out targeted gene disruption using homologous recombination in embryonic stem cells 27. Mice bearing a homozygous deletion of SHIP are viable and fertile, but they fail to thrive, and a significant mortality is observed by 14 wk of age. Consolidation of the lungs due to infiltration by myeloid cells is a major contributing factor. These mice exhibit a myeloproliferative disorder consistent with an enhanced responsiveness of myeloid progenitors to numerous growth factors. This study suggests that SHIP is an important negative regulator of cytokine signaling.
Intriguingly, our preliminary analysis suggested that the numbers and percentages of B220+ cells in the bone marrow of these SHIP−/− mice were reduced 27, as were both the frequency and absolute number of progenitors capable of forming precursor B (pre-B) cell colonies in IL-7 containing methylcellulose. In contrast, T cell subsets within the thymus appeared normal. These observations prompted us to examine the consequences of SHIP deficiency on immune function in greater detail.
In this paper, we report that SHIP deficiency leads to aberrant B cell development with a consequent decrease in pre- and immature B cell pools in the bone marrow, and increased B cell numbers in the spleen and lymph nodes. Strikingly, serum Ig levels are elevated in SHIP−/− mice, and immunization with TNP-Ficoll, a T cell–independent type 2 (TI-2) antigen, leads to an enhanced antibody response. Thus, SHIP appears to play a role in limiting the extent of the immune response to surface IgM–cross-linking antigens. We also demonstrate that the alterations in B cell development are transplantable to lymphoid-deficient nonobese diabetic (NOD)/SCID recipients, and thus appear to be cell intrinsic. In contrast, both the elevations in circulating Ig and the enhanced TI-2 response are abrogated after transplantation. These observations suggest that SHIP plays a critical role in regulating the development and antigen responsiveness of B lymphoid cells by both intrinsic and extrinsic mechanisms.
Materials and Methods
Animals.
The generation of SHIP−/− mice has been described previously 27. All mice used in these experiments were F2 or F3 littermates (4–8 wk of age) that were bred and maintained with sterilized food, water, and bedding in microisolator units at the Joint Animal Facility of the British Columbia Cancer Research Centre. Regular testing of sentinel animals was performed to ensure that the animal stocks were free of bacterial, viral, and parasitic infections. NOD/SCID mice (The Jackson Laboratory) were bred and maintained as described above.
Flow Cytometry.
Bone marrow, spleen, or lymph node cells at a density of 5–10 × 106 cells/ml were incubated on ice for 30 min with 4–6 μg/ml 2.4G2 (murine anti-IgG FcR antibody). Directly conjugated FITC-, PE-, or cyanine 5 succinimidyl ester–labeled antibodies were added, and incubations were continued on ice for an additional 30–40 min. Cells were washed once in HBSS (StemCell Technologies) containing 2% fetal bovine serum (HF) at 4°C, and propidium iodide (Sigma Chemical Co.) at a concentration of 1 μg/ml was included in the final wash. Cells were analyzed on a FACStarPLUS™ or FACSort™ (Becton Dickinson). All antibodies used for these analyses were purchased from PharMingen, with the exception of the anti-IgM and anti-IgD antibodies that were from Southern Biotechnology Associates.
Expression Analysis by Reverse Transcription PCR and Global cDNA Amplification.
Bone marrow and spleen cells were labeled with the indicated antibodies as described above, and the various B cell populations were collected using a FACStarPLUS™. Cells were lysed with a guanidine isothiocyanate solution for isolation of RNA, and reverse transcription and global cDNA amplification were carried out using methods, described previously, that have been shown to preserve the difference between frequent and rare transcripts over a wide range of cell numbers 28.
Aliquots of the resulting cDNA populations were separated on an agarose gel and passively transferred onto an ionic nylon membrane (Zeta-Probe; Bio-Rad). Probes were labeled with [32P]dCTP (3,000 Ci/mmol; Amersham Pharmacia Biotech) by random priming, and were purified on Sephadex G50 columns (Amersham Pharmacia Biotech) before use. Blots were hybridized and washed as described previously. Probes used in this study include the chicken β-actin cDNA and the 5′ SacI fragment of the SHIP cDNA 3.
PhosphorImager® analysis using a Storm 860 PhosphorImager® and ImageQuant® software (Molecular Dynamics) was used to determine signal intensities for both actin and SHIP. The relative level of SHIP expression was calculated by dividing the signal intensity for SHIP by the signal intensity for actin. Results are shown normalized to expression levels on the B220+c-kit+ population.
B Cell Purification.
Total spleen cells (pooled from three or four mice) were resuspended to a density of 1 × 10⁷ cells/ml in PBS solution (StemCell Technologies) supplemented with 2% fetal bovine serum. Mature B cells were purified by negative selection using the StemSep™ (StemCell Technologies) magnetic separation technique in accordance with the manufacturer's instructions. Purity was confirmed by FACS® analysis using antibodies against B220, CD4, CD8, Mac-1, and Gr-1, and was generally >85%.
Proliferation Assays.
A 50-μl aliquot of purified B cells (1 × 10⁵) was added to triplicate wells of a 96-well plate (Falcon) in a final volume of 200 μl RPMI 1640 (StemCell Technologies) supplemented with 10% fetal bovine serum, 2 mM glutamine, and 10−4 M β-mercaptoethanol (RFM). Cultures were supplemented with the indicated concentrations of goat anti–mouse IgM antibody (intact or F[ab′]2 fragment; Jackson ImmunoResearch Laboratories) or Escherichia coli LPS (Sigma Chemical Co.). IL-4 was supplied as a culture supernatant from the transfected cell line X63114 29, and the anti-CD40 antibody as a culture supernatant from the FGK45 hybridoma 30. Cultures were incubated for ∼60 h before the addition of 1 μCi of [3H]thymidine (New England Nuclear) for the final 6 h of incubation. Results represent the mean ± SD of triplicate wells.
Western Blot Analysis.
Purified wild-type and SHIP−/− B cells were resuspended at a density of 2 × 10⁷ cells/ml in RFM, and were incubated with 20 μg/ml of goat anti–mouse IgM antibody (either intact or the F[ab′]2 fragment) at room temperature for the indicated amounts of time. Cells were washed once in PBS, and were lysed at 5 × 10⁷ cells/ml at 4°C with 1% Triton X-100 in phosphorylation solubilization buffer (50 mM Hepes, pH 7.4; 100 mM NaF; 10 mM Na4P2O7; 2 mM Na3VO4; 4 mM EDTA; 2 mM PMSF; 10 μg/ml leupeptin; and 2 μg/ml aprotinin). After centrifugation, supernatants (total cell lysates) were subjected to SDS-PAGE, and Western analysis was carried out using antiphospho-MAPK or antiphospho-Akt antibodies as described previously 31. Blots were stripped and reprobed for Akt or MAPK to control for the amount of protein loaded. Antiphospho-MAPK, antiphospho-Akt, and anti-Akt antibodies were from New England Biolabs, and anti–extracellular signal–regulated kinase (ERK)-1 COOH-terminal antibodies were purchased from Upstate Biotechnology.
Analysis of Cell Survival, Apoptosis, and Cell Cycling.
Purified wild-type and SHIP−/− B cells were resuspended at 2 × 10⁵ cells/ml in RFM with the indicated concentrations of goat anti–mouse IgM antibody (intact or F[ab′]2 fragment), IL-4, or anti-CD40. At various times, cultures were harvested, and the numbers of viable and dead cells were determined microscopically using the vital stain eosin. Cells were washed one time with HF, and were resuspended by vortexing in ∼100 μl of HF. 1 ml of ice-cold 70% ethanol was added dropwise while vortexing, and the cells were fixed at 4°C for at least 24 h before staining with propidium iodide at a concentration of 10 μg/ml. The percentages of apoptotic and cycling cells were determined by FACS® analysis using the FACSort™ and CELLQuest™ software (Becton Dickinson).
Determination of Serum Ig Levels.
Serum Ig levels in SHIP−/− mice and littermate controls were determined by ELISA. In brief, ELISA 96-well plates were coated with goat anti–mouse Ig subclass–specific antibodies (Southern Biotechnology Associates), and were incubated with serial dilutions of mouse serum. After 2 h, the plates were washed with PBS, and were incubated for an additional 2 h with IgM-, IgG1-, IgG2a-, IgG2b-, and IgG3-specific alkaline phosphatase–labeled goat anti–mouse antibodies (Southern Biotechnology Associates). The plates were washed, and the presence of alkaline phosphatase was detected by the addition of 4-nitrophenyl phosphate. The OD was determined at 405 nm. Calibrated mouse serum (The Binding Site) was used as a standard.
Antigenic Challenge of Wild-Type and SHIP−/− Mice.
Wild-type and SHIP−/− mice, 4–6 wk of age, were injected subcutaneously with 100 μg TNP-KLH in CFA (T cell dependent), or were injected intravenously with 10 μg TNP-Ficoll (a gift from P.J.L. Lane, University of Birmingham, Birmingham, UK) in PBS (T independent). To elicit a secondary T cell–dependent immune response, mice were challenged by intravenous injection of 10 μg TNP-KLH in PBS at 35 d after the primary immunization. Serum samples were collected at the indicated times, and serial dilutions were incubated in 96-well ELISA plates coated with TNP-coupled ovalbumin to detect TNP-specific antibodies using the protocol above. Antibody titers are expressed as the inverse serum concentrations at the background OD + 3SD.
Transplantation of NOD/SCID Mice.
NOD/SCID mice, 6–8 wk of age, were intravenously injected with 1 × 10⁷ bone marrow cells from SHIP+/+ or SHIP−/− littermates. The engraftment of donor-derived cells was assessed by FACS® analysis of peripheral blood cells for the presence of the Ly5.2 (CD45.2) cell surface antigen. Dual staining of single cell suspensions from peripheral blood, spleen, bone marrow, or lymph nodes with antibodies against Ly5.2 and various lineage-specific antigens allowed an estimation of the donor-derived contribution to lymphoid and myeloid cell compartments.
Results
Aberrant B Cell Development in SHIP−/− Mice.
Our initial characterization of SHIP−/− mice had revealed a reduction in both the percentage and number of B220+ cells in the bone marrow of young (4–8-wk-old) animals. Bone marrow B cell development progresses through several stages characterized on the basis of surface antigen expression and Ig gene rearrangements, as well as responsiveness to stromal interactions and IL-7 32 33 34 35 36 37. Hematopoietic stem cells give rise to B lymphoid–restricted progenitor B (pro-B) cells that mature progressively to pre-B I cells (fractions A–C), pre-B II cells (fractions C′ and D), and finally to immature (surface Ig–positive) and mature IgM+IgD+ B cells 38 39. To determine the stage(s) at which the perturbations in B cell development occur in SHIP−/− mice, we carried out a more detailed FACS® analysis of bone marrow and peripheral B cell subsets.
Table indicates, as our previous data showed 27, that both the percentage and number of bone marrow B220+ cells are reduced in SHIP−/− mice. Closer analysis reveals that numbers of the earliest committed B220+CD43+ B cells (pro-B and pre-B I) are not reduced compared with wild-type in either fraction A (heat-stable antigen [HSA]−) or fraction B (HSA+). However, the BP-1+CD43+ cell population (fraction C) is reduced to ∼50% of normal numbers. Similarly, the pre-B II cell compartment defined as B220loCD43−IgM− (fraction D) is slightly reduced in both percentage and numbers in the marrow. Numbers of B2202+IgM+ B cells are reduced to ∼30%, whereas the number of mature IgM+IgD+ B cells is reduced to ∼25% of normal levels (Table ). Thus, the greatest decreases in bone marrow B lymphocyte numbers in SHIP−/− mice are observed at the intermediate and late stages of B cell maturation.
Table 1.
B Lymphoid Populations in 4–5-wk-old Wild-Type and SHIP − _/_− Mice
| Percentage of positive cells | No. of positive cells | |||
|---|---|---|---|---|
| +/+ | −/− | +/+ | −/− | |
| ×106 | ×106 | |||
| Bone marrow (per femur) | ||||
| B220+ | 31.9 ± 2.7 | 20.2 ± 2.2 | 4.7 ± 1.8 | 2.6 ± 1.0 |
| B220lo | 24.4 ± 3.4 | 16.3 ± 1.7 | 3.7 ± 1.6 | 2.1 ± 0.8 |
| B220hi | 7.6 ± 1.5 | 3.9 ± 1.2 | 1.1 ± 0.2 | 0.5 ± 0.2 |
| B220+CD43+ | ||||
| HSA− (fraction A) | 3.7 ± 2.1 | 3.6 ± 1.7 | 0.5 ± 0.3 | 0.5 ± 0.3 |
| HSA+ (fractions B and C) | 4.9 ± 1.9 | 6.4 ± 1.1 | 0.8 ± 0.5 | 0.8 ± 0.3 |
| BP-1+CD43+ (fraction C) | 4.0 ± 1.2 | 2.8 ± 1.0 | 0.6 ± 0.2 | 0.3 ± 0.1 |
| B220loCD43−IgM− (fraction D) | 13.8 ± 3.7 | 9.7 ± 0.7 | 2.0 ± 0.8 | 1.2 ± 0.4 |
| B220+IgM+ (fraction E) | 6.8 ± 3.8 | 6.3 ± 4.1 | 1.1 ± 0.9 | 0.8 ± 0.7 |
| B2202+IgM+ (fraction F) | 4.2 ± 2.1 | 1.8 ± 1.0 | 0.6 ± 0.2 | 0.2 ± 0.1 |
| IgM+IgD+ | 5.9 ± 1.3 | 3.9 ± 1.3 | 0.8 ± 0.1 | 0.2 ± 0.1 |
| Spleen | ||||
| B220+ | 43.7 ± 12.8 | 36.9 ± 13.7 | 42 ± 13 | 68 ± 17 |
| IgM+IgD+ | 36.3 ± 8.4 | 33.9 ± 7.3 | 63 ± 23 | 109 ± 17 |
| Peripheral blood | ||||
| IgM+IgD+ | 28.9 ± 8.3 | 12.1 ± 4.1 | ND | ND |
| Peritoneum | ||||
| IgM+IgD+ | 31.6 ± 2.8 | 16.8 ± 1.3 | 1.0 ± 0.1 | 1.85 ± 0.1 |
| IgM+CD5+ | 53.3 ± 3.4 | 43.2 ± 4.9 | 1.6 ± 0.1 | 4.8 ± 0.5 |
Further definition of the stage at which differences in B cell development become apparent was achieved by limiting dilution analysis of pre-B colony formation on an S17 stromal layer in the presence of IL-7 40. Stromal cell and IL-7 responsiveness is characteristic of the earliest B cell progenitors (pro- and pre-B cells), although the requirement for both is lost in the transition to the small pre-B II fraction (fraction D [32, 41]). Using this assay, the frequency of pre-B colony-forming cells in the bone marrow of SHIP−/− mice was similar to that observed in wild-type mice (1 in 216 compared with 1 in 258). Clonogenic B cell progenitors detected by colony formation in IL-7 containing methylcellulose culture, predominantly pre-B II or immature B cells, were reduced by ∼50% in SHIP−/− mouse bone marrow, with absolute numbers per femur reduced to 30% of wild-type levels 27. These functional observations are also consistent with a role for SHIP in the intermediate stages of B cell development.
Peripheral B cell pools were examined by FACS® to determine if the alterations in SHIP−/− bone marrow compartments extended beyond the earliest stages of B lymphopoiesis. Surprisingly, the percentages of various B cell populations present in the spleen (Table ) and lymph nodes (data not shown) of SHIP−/− mice were not significantly altered. In fact, absolute numbers of splenic B220+ and IgM+IgD+ cells were slightly increased (1.6- and 1.7-fold, respectively), reflecting the splenomegaly exhibited by these young SHIP knockout mice. In contrast, the percentage of IgM+IgD+ mature B cells detected in the peripheral blood was reduced by 40–50% compared with littermate controls (Table ).
B-1a cells represent the predominant B cell population within the peritoneal cavity, and appear to arise as a distinct B cell lineage generated from fetal and neonatal progenitors 42 43. Despite the reduced frequency of IgM+ IgD+conventional B cells, no significant difference was detected in the percentages of IgM+CD5+ B-1a cells found in the peritoneal cavity of SHIP−/− and wild-type mice (Table ). However, as in the spleen, significantly more nucleated cells are present in the peritoneum of SHIP−/− mice (11.0 ± 1.8 × 10⁶ vs. 3.0 ± 0.7 × 10⁶ for SHIP−/− and wild-type, respectively; P = 0.006). Thus, there is a consequent increase in absolute numbers of mature IgM+ IgD+ cells and B-1a cells compared with littermate controls (Table ). These observations confirm that, despite reduced numbers of bone marrow B lymphocytes, SHIP−/− mice have increased numbers of mature conventional B cells in the spleen, lymph nodes, and peritoneum, as well as increased numbers of CD5+ B-1a cells in the peritoneal cavity.
Expression of SHIP in B Lymphoid Populations.
Selected B cell populations from the bone marrow and spleen were examined to determine if SHIP mRNA expression correlated with the stages at which B cell development shows the greatest perturbations. As shown in Fig. 1, SHIP is expressed in all B cell populations examined, but at variable levels. The highest relative expression levels are detected in the B220+c-kit+ fraction of the bone marrow that corresponds to the pro-B and pre-B cell pools (fractions A–C). There is a progressive decrease in SHIP expression throughout the remainder of the B cell developmental program within the marrow. Expression in the B220+CD43+ population (intermediate to late pro-B cell stage) is reduced by ∼50% compared with the expression in the earliest B cell compartment. Although comparatively smaller, further decreases in SHIP expression occur in the transition from pre-B to immature to mature bone marrow B cell. Thus, the highest levels of SHIP mRNA expression are detected in the earliest B cell progenitors.
Figure 1.


Expression of SHIP in B cell subsets. (A) Southern blots of amplified total cDNA prepared from phenotypically defined bone marrow and spleen B cell subsets, as well as total bone marrow (TBM), were sequentially hybridized with probes specific for SHIP and actin as indicated. (B) Signal intensities after hybridization were quantified by PhosphorImager® analysis, and expression levels of SHIP relative to actin were calculated. Average expression levels from two determinations are shown normalized to expression in the B220+c-kit+ population.
Two B cell populations isolated from the spleen also show dramatically different levels of SHIP mRNA expression. The IgM2+IgD+ population, which corresponds to the immature and marginal zone B cell pools 44 45, expresses levels of SHIP that approximate those observed in the bone marrow B220+c-kit+ population. In contrast, the follicular IgM+IgD+ population expresses lower levels of SHIP than detected in any other B cell population. Thus, as in the bone marrow, splenic B cells show a biphasic pattern of SHIP mRNA expression, with the highest levels detected in the less mature populations.
Enhanced Proliferative Responsiveness of SHIP− _/_− B Cells.
Since SHIP has been postulated to play a negative role in regulating B cell signaling 11, deficiency of this protein might be expected to lead to enhanced or prolonged BCR activation. The proliferative response of purified splenic B220+ cells from SHIP−/− mice incubated with an intact anti-IgM antibody in the presence of 2.4G2 to block FcγRIIB coligation led to significantly increased thymidine incorporation compared with wild-type controls (Fig. 2 A). Coligation of the BCR with FcγRIIB using intact antibody alone significantly reduced the proliferation of wild-type B cells, but not SHIP−/− B cells, at all antibody concentrations (Fig. 2 A). In addition, under coligation conditions, the reduced proliferation of the wild-type cells correlated with a decreased calcium influx (data not shown), whereas no difference was observed with the SHIP−/− cells. The enhanced proliferation of SHIP−/− B cells in response to BCR activation was also observed using the F(ab′)2 fragment of goat anti–mouse IgM (Fig. 2 B), although only at higher antibody concentrations. Analysis of calcium influx under these conditions revealed no significant differences between wild-type and SHIP−/− B cells (data not shown).
Figure 2.

Proliferation of purified B cells in response to various stimuli. (A) Purified splenic B cells from wild-type (•) or SHIP−/− (♦) mice were incubated with intact goat anti–mouse IgM antibody in the presence (solid line) or absence (broken line) of the anti-FcR antibody 2.4G2 for 60 h before addition of [3H]thymidine for determination of specific incorporation. Results are the mean ± SEM of triplicate determinations (four experiments with cells pooled from three or four mice per experiment). Purified splenic B cells from wild-type (•, solid line) and SHIP−/− (♦, broken line) mice were incubated with various concentrations of the F(ab′)2 fragment of goat anti–mouse IgM antibody (B) or bacterial LPS (C), and proliferation was determined as above. (D) Purified splenic B cells from wild-type (white bars) and SHIP−/− (black bars) mice were incubated with the indicated concentrations of IL-4 or anti-CD40 culture supernatants. (E) Wild-type (•, solid line) and SHIP−/− (♦, broken line) B cells were incubated with 1% IL-4 supernatant and the indicated percentages of anti-CD40 supernatant for determination of proliferation as indicated above. Statistical analysis between similarly treated wild-type and SHIP−/− cells was carried out using the Student's t test. *P ≤ 0.05; **P ≤ 0.005.
To determine if the enhanced proliferative response was restricted to stimulation through the BCR, +/+ and −/− B cells were incubated with a variety of other reagents. Wild-type and SHIP−/− cells responded similarly to bacterial LPS (Fig. 2 C) and either anti-CD40 or IL-4 alone (Fig. 2 D). However, SHIP−/− B cells displayed an enhanced proliferation in response to combinations of anti-CD40 plus IL-4 (Fig. 2 E; data not shown). Together, these results strongly implicate SHIP in the negative regulation of B cell proliferative responses.
Increased Phosphorylation of MAPK and Akt in SHIP− _/_− B Cells.
We sought to identify biochemical differences that might underlie the enhanced proliferation of SHIP−/− B cells by assessing the phosphorylation of relevant proteins after BCR stimulation with either the F(ab′)2 fragment or intact goat anti–mouse IgM. For example, the ERKs p42 and p44 (ERK2 and ERK1), both members of the MAPK family, are activated during signaling through the BCR 46 47 48 and are well-established mediators of cell proliferation in many cell types 49 50. Although BCR stimulation induces MAPK phosphorylation in both wild-type and SHIP−/− cells, the SHIP−/− cells exhibit higher levels of MAPK phosphorylation at early times, especially when the BCR is coligated with FcγRIIB using the intact antibody (Fig. 3).
Figure 3.

Phosphorylation of Akt and MAPK after BCR stimulation of purified B cells. Western blot analysis showing the time course of Akt (Akt-P) and MAPK (p44-P and p42-P) phosphorylation in wild-type (+/+) and knockout (−/−) B cells after BCR stimulation with the F(ab′)2 (left) or intact (right) goat anti–mouse IgM. Protein levels of Akt and MAPK are shown to indicate relative expression levels.
Elevations in PIP3 after BCR activation have been shown to result in the phosphorylation and activation of the survival factor Akt in B cells 23. Since SHIP has been implicated in the regulation of Akt 51 52, we examined the phosphorylation of Akt in response to BCR signaling. Coligation of BCR and FcγRIIB using an intact antibody to mimic inhibitory signaling results in significantly higher levels of Akt phosphorylation in the SHIP−/− cells (Fig. 3). Western blot analysis using the antiphosphotyrosine antibody 4G10 revealed that this enhanced tyrosine phosphorylation of MAPK and Akt under coligating conditions is specific, and is not due to a generalized increase in protein phosphorylation (data not shown). Similarly, stimulation with the F(ab′)2 fragment also leads to increased phosphorylation in the SHIP−/− B cells, although to a lesser extent (Fig. 3). These observations suggest that the enhanced activation of Akt and MAPK may contribute to the increased proliferation of SHIP−/− B cells by increasing survival, altering the number of actively cycling cells, or increasing the rate of progression through the cell cycle.
Survival, Apoptosis, and Cell Cycle Analysis.
To gain further insight into the mechanisms underlying the increased proliferation of SHIP−/− B cells, we examined cell viability, and determined the proportion of cells in the apoptotic and cycling fractions at various times throughout the 60-h incubation period (Table ). Although the viability of freshly isolated wild-type and SHIP−/− B cells was similar as assessed by eosin exclusion, the SHIP−/− population contained a larger apoptotic fraction as well as an increased proportion of actively cycling cells. Regardless of the stimulation used or the genotype of the cells, absolute numbers of viable cells were reduced to ∼30% of input by 24 h.
Table 2.
Analysis of Viability, Apoptosis, and Cell Cycle in Response to B Cell Stimulation
| Percent viable(by dye exclusion) | Percent apoptotic | Percent cycling | |||||
|---|---|---|---|---|---|---|---|
| Time | +/+ | −/− | +/+ | −/− | +/+ | −/− | |
| h | <2n | >2n | |||||
| Unstimulated | 0 | 95–98 | 95–98 | 0.35 | 6.7 | 13.2 | 21.7 |
| IgM F(ab′)2 | 24 | 68.9 | 72.0 | 1.3 | 1.2 | 20.4 | 22.3 |
| 48 | 89.2 | 85.5 | 0.5 | 0.2 | 69.8 | 68.5 | |
| 60 | 90.0 | 77.0 | 52.2 | 19.6 | 25.7 | 30.9 | |
| IgM intact | 24 | 45.5 | 56.3 | 10.9 | 5.3 | 23.1 | 20.1 |
| 48 | 43.9 | 77.3 | 5.4 | 2.9 | 50.0 | 46.5 | |
| 60 | 43.0 | 61.0 | 23.7 | 29.2 | 17.6 | 22.5 | |
| anti-CD40 + IL-4 | 24 | 87.3 | 66.3 | 1.1 | 2.2 | 21.9 | 24.2 |
| 48 | 53.0 | 66.0 | 3.3 | 4.2 | 20.3 | 27.0 | |
| 60 | 59.0 | 67.0 | ND | ND | ND | ND |
At all time points examined, stimulation of wild-type B cells with intact IgM reduced the proportion of viable cells by approximately one half compared with treatment with the F(ab′)2 fragment (Table ). In contrast, little difference in the percentages of viable SHIP−/− B cells was detected under either condition. This observation alone may account for the enhanced proliferation of the SHIP−/− B cells under coligating conditions (Fig. 2 A). Indeed, there were only slight differences between wild-type and SHIP−/− cultures in the percentages of apoptotic and cycling cells at any time point after stimulation with intact IgM antibody (Table ).
Activation of the BCR using the F(ab′)2 fragment of IgM does not result in significant differences between wild-type and SHIP−/− B cells at 24 or 48 h (Table ) for any of the parameters examined. However, by 60 h, ∼50% of the wild-type B cells are apoptotic, compared with only 20% of the SHIP−/− B cells. In addition, a slightly increased frequency of the SHIP−/− B cells were actively cycling. Taken together, these observations may explain the modest increases observed in [3H]thymidine incorporation by the SHIP−/− B cells at this F(ab′)2 fragment concentration (Fig. 2 B).
Finally, stimulation of wild-type and SHIP−/− B cells with anti-CD40 plus IL-4 resulted in increases both in cell viability (at 48 and 60 h) and in the proportion of actively cycling cells in the SHIP−/− cultures at all time points examined (Table ). These observations are consistent with the increased proliferation of SHIP−/− B cells in response to this stimulation (Fig. 2 E).
Elevated Serum Ig and Enhanced Responsiveness to a TI-2 Antigen.
The in vivo consequences of this enhanced B cell responsiveness in SHIP−/− mice were determined by examining the circulating levels of Ig. SHIP−/− mice have significantly elevated levels of IgM, IgG2a, IgG2b, and IgG3, whereas levels of IgG1 were marginally elevated (Fig. 4). The magnitude of increase ranged from two- to sevenfold, depending on the Ig isotype.
Figure 4.

Serum Ig levels in 4–8-wk-old SHIP wild-type (+/+), heterozygous (+/−), and knockout (−/−) mice. Serial dilutions of serum obtained from age-matched mice (n = 8–9) were used. Symbols represent levels in individual animals, and the bar represents the mean value. Statistical analysis was carried out using the Student's t test. *P ≤ 0.05; **P ≤ 0.01; ***P ≤ 0.005.
Inasmuch as SHIP deficiency increases the sensitivity of mature B cells to BCR signaling, we examined the ability of SHIP−/− mice to respond to antigenic challenge. Mice were challenged with the TI-2 antigen TNP-Ficoll, and TNP-specific antibody titers were examined at 8 d after immunization. SHIP−/− mice exhibited a significantly increased IgG, but not IgM, response to the antigen (Fig. 5 A). Surprisingly, the heterozygous mice showed an intermediate enhancement in responsiveness. Further analysis of the IgG isotypes revealed that IgG1, IgG2a, and IgG3 responses were all significantly elevated (∼10–15 times for each) compared with the wild-type controls (results not shown). In contrast, SHIP−/− mice and their littermate controls responded similarly to the T cell–dependent antigen TNP-KLH in both the primary and secondary challenges (Fig. 5 B). Thus, SHIP deficiency increases the Ig production in response to a TI-2 antigen, but not to a T cell–dependent antigen.
Figure 5.

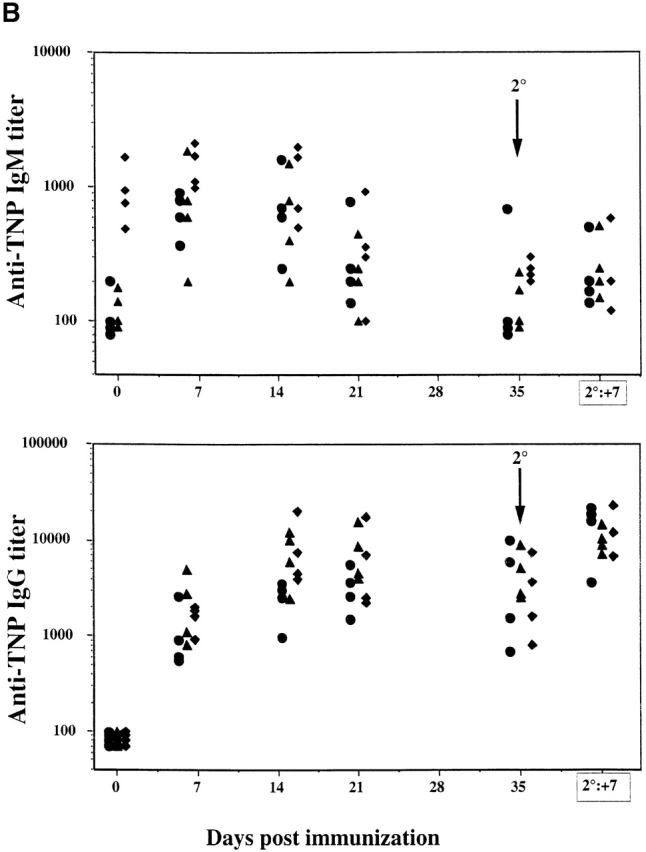
Serum Ig levels after antigenic challenge. (A) Anti-TNP–specific Ig levels before (d0) and 8 d (d8) after immunization with the TI-2 antigen TNP-Ficoll. (B) Anti-TNP–specific Ig at the indicated times after injection of the T cell–dependent antigen TNP-KLH. Symbols represent levels in individual animals, and the column represents the mean value. Statistical analysis was carried out using the Student's t test. *P ≤ 0.05.
Altered B Cell Development, but Not TI-2 Hyperresponsiveness, Is Transplantable.
One question arising from these observations is whether the perturbations in B cell development and function are solely intrinsic to the B cell populations, or whether they may also reflect alterations in accessory cells. In an attempt to address this issue, total bone marrow cells from wild-type or SHIP−/− mice were transplanted into nonirradiated NOD/SCID mice. These mice are immunodeficient, lack lymphoid cells, and show little or no serum Ig with age 53. Under these conditions, it was anticipated that the lymphoid populations would be derived from the transplant, whereas the myeloid compartment would be chimeric for both endogenous and transplanted cells.
Peripheral blood samples were examined at various times from 7 wk to 7 mo after transplant for circulating levels of total (B220+) and mature (IgM+IgD+) B cell populations. NOD/SCID mice transplanted with bone marrow from SHIP−/− mice had significantly reduced levels of both B cell populations (Fig. 6). In contrast, the percentage of donor-derived cells expressing the Ly5.2+ antigen was not significantly different (69.2 ± 23.9% for wild-type; 53.0 ± 30.5% for SHIP−/−), suggesting, as observed in the knockout mouse, specific alterations in B cell development in the absence of SHIP. Further examination revealed that the percentage of donor-derived Mac-1+Gr-1+ cells in the peripheral blood was also similar (Fig. 6) in recipients of wild-type and SHIP−/− marrow. Importantly, there were no differences in the cellularity of peripheral blood, spleen, or bone marrow between recipients of wild-type and SHIP−/− bone marrow. These observations, together with the absence of any detectable alterations in the proportion of myeloid cells in blood or other organs (see below), suggest that transplanted nonirradiated NOD/SCID mice are a useful model in which to examine the role of SHIP in B cell development and immune function independent of the myeloproliferative syndrome.
Figure 6.

B lymphocyte and myeloid populations in transplanted NOD/SCID mice. FACS® analysis was carried out on peripheral blood cells isolated from NOD/SCID mice transplanted with wild-type (•) or SHIP knockout (♦) bone marrow cells to determine the percentages of cells expressing B220 or IgM plus IgD. Nontransplanted mice exhibited undetectable levels of these markers (not shown). In addition, the percentages of transplant-derived cells expressing the Mac-1 and Gr-1 surface antigens were determined (Ly5.2+Mac+Gr+). Results are shown for 4–10 mice. Numbers above the column represent the mean ± SD for the indicated animals. Statistical analysis was carried out using the Student's t test. *P ≤ 0.005.
A reduced frequency of B220+IgM+ cells was detected in the bone marrow of SHIP−/− transplant recipients at 7 mo after transplant (Table ; n = 2). As in the peripheral blood, no significant differences were detected in the percentage of Ly5.2+ donor-derived cells in the bone marrow. This observation suggests a B cell–specific alteration in development that occurs, as in the SHIP−/− mouse, during the intermediate stages of maturation. Surprisingly, significant decreases in the frequency of B220+ and IgM+IgD+ populations in the spleen were also observed (Table ). However, no obvious differences in the proportion of Ly5.2+ cells expressing B cell markers were detected (data not shown), suggesting that the decrease in splenic B cells merely reflects a decreased percentage of Ly5.2+ cells in this organ (Table ). No significant differences were observed in the percentages of transplant-derived CD4+, CD8+, or Mac-1+Gr-1+ cells in either the lymph nodes or spleen (data not shown; Table ).
Table 3.
FACS® Analysis of Selected Tissues from NOD/ SCID Mice Transplanted with Wild-Type or SHIP−/− Bone Marrow Cells
| Percentage of positive cells | ||
|---|---|---|
| +/+ | −/− | |
| Bone marrow | ||
| Ly5.2+ | 44.5 ± 11.5 | 59.6 ± 16.3 |
| B220+ | 14.8 ± 1.1 | 10.2 ± 4.0 |
| CD43+B220+ | 3.0 ± 0.9 | 2.6 ± 0.1 |
| IgM+B220lo | 3.1 ± 0.1 | 1.5 ± 1.0 |
| IgM+B220hi | 3.5 ± 1.1 | 0.6 ± 0.3 |
| Spleen | ||
| Ly5.2+ | 85.5 ± 9.6 | 61.9 ± 5.1 |
| B220+ | 54.5 ± 11.3 | 35.2 ± 1.1 |
| IgM+IgD+ | 50.0 ± 8.5 | 29.1 ± 4.4 |
| Mac-1+Gr-1+ | 8.8 ± 0.5 | 12.5 ± 0.3 |
| Lymph nodes | ||
| Ly5.2+ | 99.3 ± 0.1 | 86.2 ± 12.7 |
| B220+ | 36.1 ± 0.1 | 40.7 ± 6.1 |
| IgM+IgD+ | 32.4 ± 1.6 | 33.0 ± 7.5 |
| Mac-1+Gr-1+ | 12.4 ± 8.4 | 3.0 ± 0.7 |
Serum Ig levels were analyzed to determine if the inappropriate elevations observed in SHIP-deficient mice were transplantable. Surprisingly, as shown in Fig. 7 A, recipients of wild-type and SHIP−/− bone marrow cells displayed similar levels of IgM and IgG. Thus, although the reduction in bone marrow B cell numbers associated with the absence of SHIP was transplantable, the elevation in serum Ig levels was not.
Figure 7.


Serum Ig and anti-TNP–specific antibody levels in NOD/SCID mice transplanted with wild-type or SHIP−/− bone marrow cells. (A) Serum Ig levels were determined by ELISA measurements on serial dilutions of serum taken from representative mice transplanted with wild-type (•) or SHIP−/− (♦) bone marrow. (B) Nonirradiated NOD/SCID mice with equivalent levels of Ly5.2+B220+ cells in the peripheral blood were injected intravenously with TNP-Ficoll, and serum samples were collected 9 d after immunization. ELISAs were carried out to determine the levels of anti-TNP–specific antibodies in recipients of wild-type (•) or SHIP−/− (♦) bone marrow. Statistical analysis was carried out using the Student's t test. **P ≤ 0.01; ***P ≤ 0.005.
We next examined whether bone marrow transplantation was sufficient to confer hyperresponsiveness to a TI-2 antigen. To address this question, five mice from each transplant group that exhibited similar levels of Ly5.2+ B220+ cells in the peripheral blood were challenged by intravenous injection of TNP-Ficoll. Mice transplanted with cells of either genotype had similar basal levels of anti-TNP antibodies (data not shown). However, in response to the antigenic challenge, recipients of wild-type cells showed increased anti-TNP titers of all IgG isotypes (Fig. 7 B) at 9 d after immunization. Surprisingly, the responsiveness of mice transplanted with the SHIP−/− bone marrow was significantly impaired compared with that observed in recipients of wild-type marrow. Therefore, although the decreases in bone marrow B lymphopoiesis are transplantable, the hyperresponsiveness to the TI-2 antigen is not. These observations argue that SHIP plays a primary role in the developmental B cell defect. However, the enhanced Ig production by SHIP−/− B lymphocytes may be the consequence of altered accessory cell function.
Discussion
SHIP has emerged as a major regulatory molecule in both lymphopoiesis and myelopoiesis. We have demonstrated previously that targeted disruption of SHIP leads to a myeloproliferative disorder associated with pronounced lung pathology and a shortened life span 27. In this report, we demonstrate that SHIP deficiency has a profound effect on both the generation and function of B lymphocytes. Our analyses indicate that SHIP is required for normal proliferative responses to BCR stimulation, both in the presence and absence of FcγRIIB coligation. Furthermore, SHIP plays a pivotal role in regulating the normal serum Ig levels as well as the antibody response to specific antigenic challenge.
Coligation of the BCR and FcγRIIB by antibody–antigen immune complexes is one mechanism by which the immune response is regulated. This cross-linking has been shown to result in apoptosis of normal mature B cells 15 16, but the molecular mechanisms underlying the inhibitory nature of the FcγRIIB signal have only recently been identified. Coligation induces the tyrosine phosphorylation of FcγRllB at its intracellular immunoreceptor tyrosine–based inhibitory motif sequences, with a consequent attraction of both SHIP and SH2 domain–bearing protein tyrosine phosphatase 1 (SHP-1) to the ligated receptor 18 54. This results in a decrease in calcium influx and a decrease in the proliferative and survival signals within the B cell. Studies using genetically altered chicken DT40 cells indicate that SHIP, and not SHP-1, is the mediator responsible for this inhibitory signal 10. Our data showing an enhanced proliferative response of SHIP−/− splenic B cells to IgM coligation argue that this also holds for primary murine lymphoid cells. Increased phosphorylation of the serine/threonine kinase Akt and MAPK (Fig. 3) may play a significant role in this response. Indeed, at all time points examined, SHIP−/− B cell cultures stimulated with intact anti-IgM contained a higher percentage of viable cells (Table ), suggesting that Akt phosphorylation enhances B cell survival. This observation contradicts the DT40 cell line studies, in which increased apoptosis and decreased proliferation were observed in SHIP−/− cells 10, perhaps reflecting differences between primary B cells and B cell lines.
Positive stimulation through the BCR alone using F(ab′)2 anti-IgM antibody also induced an enhanced proliferative response in B cells derived from the SHIP knockout mice, which occurs with only slight increases in BCR-mediated phosphorylation of Akt and MAPK (Fig. 3). There are also no pronounced differences in cell survival, apoptosis, or cell cycle status until later stages of the stimulation (Table ). These observations suggest that alternative pathways may play a more significant role in the enhanced proliferation of SHIP−/− B cells in response to BCR signaling. Indeed, the explanation may reside in the recruitment and activation of other signaling moieties. For example, antigen binding to the BCR results in the activation of intracellular protein tyrosine kinases such as members of the Src family (i.e., Lyn), Syk, and Btk 55 56, with the consequent phosphorylation of numerous proteins including SHIP, SHP-1, CD19, and CD22. CD19 phosphorylation induces the association and activation of phosphatidylinositol 3-kinase that is responsible for the synthesis of PIP3, a substrate for SHIP. Prolonged elevations in PIP3 levels or alterations in the ratio of PIP3 to PI-3,4-biphosphate have the potential to alter numerous cellular functions regulating cell survival and proliferation 57. The role of SHIP in regulating phosphoinositide levels after BCR activation requires further investigation. However, whether it is through its phosphatase activity or its association with other recruited proteins, SHIP may be required for regulating the intensity and duration of BCR signaling. Thus, absence of SHIP might lead to changes in gene transcription that could enhance proliferation and/or decrease apoptosis over the long term. For example, it has recently been shown that activation of Akt results in the phosphorylation of a forkhead transcription factor, leading to a transcription-dependent increase in cell survival 58.
The highest levels of SHIP expression within the B cell compartment of the bone marrow were detected in the most immature B cell subset (B220+c-kit+; Fig. 1). The extent to which these mRNA levels reflect protein expression and which isoforms 5 6 are predominant in each fraction require further investigation. Regardless, the frequency and number of cells in this immature population are not altered in SHIP−/− mice. Instead, differences are detected in the more mature B cell compartments, suggesting that SHIP plays an important role in regulating the normal developmental transition from pre-B I to pre-B II cells. This perturbation may be due to intrinsic alterations in responsiveness to cytokine signals, as observed in the myeloid compartment 27, or it may result from defects in the microenvironment. For example, increased accumulations of myeloid cells may alter the composition of the marrow sufficiently to interfere with the generation and survival of these B cell populations. Arguing against this, we also observed a reduced frequency of mature B cells within the marrow of NOD/SCID mice transplanted under conditions that favor the generation of donor-derived lymphoid, but not necessarily myeloid, cells (Table ). These observations suggest that the alterations in B cell development are cell intrinsic. One intriguing possibility is that the absence of SHIP leads to an accelerated differentiation with a consequent reduction in the numbers of immature bone marrow B cells. In support of this, SHIP−/− mice have elevated numbers of mature B cells in both the spleen (Table ) and the lymph nodes (not shown).
We and others 26 have now demonstrated, using in vitro proliferation assays, that SHIP−/− B cells do not respond negatively to coligation of BCR and FcγRIIB. Thus, it is likely that immune complex–mediated negative feedback on antibody production may also be drastically reduced in vivo. Indeed, SHIP−/− mice display elevated serum Ig levels (Fig. 4) and an enhanced Ig response to immune challenge with the TI-2 antigen TNP-Ficoll (Fig. 5 A). In contrast to FcγRIIB-deficient mice that display an enhanced Ig response to both T cell–dependent and T cell–independent antigens 59, SHIP−/− mice do not show an enhanced antigenic response to TNP-KLH. This observation is confounded by the in vitro proliferation data indicating that SHIP−/− B cells show an increased proliferation in response to anti-CD40 plus IL-4 stimulation (Fig. 2). Clearly, further analysis of B and T cell interactions in the SHIP−/− mice is required. However, the fact that SHIP−/− mice are not globally hypersensitive to antigenic challenge suggests that other pathways may be involved in the enhanced TI-2 response. Indeed, B cell responses to TI-2 antigens are also dependent on various cytokines generated by accessory cells (i.e., macrophages and mast cells 60). Inasmuch as SHIP−/− myeloid cells are hyperresponsive to cytokine signaling 7 27, it is possible that they also respond more vigorously to the presence of antigen, leading to enhanced cytokine production that may play a role in the elevated Ig levels. This possibility requires further investigation. However, the observations that NOD/SCID mice transplanted with SHIP−/− bone marrow do not exhibit a disproportionate contribution to the myeloid compartment (Table ) and do not show an enhanced Ig response to TNP-Ficoll (Fig. 7) support the hypothesis that accessory cells are a critical component of the hyperresponsiveness to TNP-Ficoll.
Thus, all three murine models—the SHIP−/− mouse and the transplanted NOD/SCID mice described in this report, as well as the SHIP−/− RAG chimeric mice 26—suggest that SHIP plays a critical role in bone marrow B cell development. Interestingly, it is debatable whether the enhanced production of serum Ig is intrinsic or at least partially dependent on external stimuli. Both the SHIP−/− mice and the RAG chimeras exhibit elevated Ig, although the isotypes affected and the increases observed are variable, perhaps reflecting differences in cytokine levels regulating isotype switching. The fact that NOD/SCID mice transplanted with either wild-type or SHIP−/− bone marrow cells display similar Ig levels supports the hypothesis that the microenvironment is involved in regulation of Ig production. Perhaps the most striking difference among the three models is observed in the responses to antigenic challenge. Both SHIP−/− mice (TNP-KLH) and SHIP−/− RAG chimeric mice (vesicular stomatitis virus [26]) respond similarly to T cell–dependent antigenic challenge. Although the RAG chimeric mice were not challenged with a TI-2 antigen, we observed that SHIP−/− mice exhibit an enhanced IgG response to TNP-Ficoll compared with wild-type mice, whereas SHIP−/− transplanted NOD/SCID mice are impaired in their responsiveness. These observations support the hypothesis that B cell–extrinsic factors play an important role in the TI-2 response. A second possible explanation for the reduced responses of the SHIP−/− cells in the NOD/SCID mice may be an inability of the transplanted cells to form proper follicles in the spleen and lymph nodes after immunological challenge. Preliminary evidence suggests that the recipients of SHIP−/− cells have a deficiency of B cell–rich areas within these organs (data not shown). Clearly, further investigation is required to examine the role of SHIP in regulating immune responses to antigenic challenge.
We have demonstrated previously that SHIP plays a pivotal role in myelopoiesis 27 and in the response of bone marrow–derived mast cells to antigenic 61 and cytokine 7 stimulation. In this report, we provide evidence that SHIP is also an important regulator of B lymphocyte development and immune function. As a consequence, young SHIP−/− mice exhibit a myeloproliferative disorder, elevated Ig levels, and enhanced responses to specific antigenic challenge. Numerous studies have demonstrated that lymphocyte hyperactivity correlates with an increased susceptibility to autoimmune diseases 62 63. Thus, the long-term consequences of SHIP deficiency require careful examination.
Acknowledgments
The authors wish to thank J.C. Cambier and A. Brauweiler for helpful discussions and for their critical reading of this manuscript, P.J.L. Lane for the generous gift of TNP-Ficoll, F. Melchers for the FGK45 hybridoma and the X63114 cell line, and P.M. Rosten and R. Grewal for genotyping and maintaining the mice.
This work was supported by the National Cancer Institute of Canada with funds from the Canadian Cancer Society and the Terry Fox Run, and by the Medical Research Council of Canada.
Footnotes
C.D. Helgason and C.P. Kalberer contributed equally to this paper.
Abbreviations used in this paper: BCR, B cell receptor; ERK, extracellular signal–regulated kinase; HF, HBSS containing 2% fetal bovine serum; HSA, heat-stable antigen; MAPK, mitogen-activated protein kinase; NOD, nonobese diabetic; PIP3, phosphatidylinositol-3,4,5-trisphosphate; pre-B cell, precursor B cell; pro-B cell, progenitor B cell; RAG, recombination activating gene; RFM, RPMI 1640 supplemented with 10% fetal bovine serum, 2 mM glutamine, and 10−4 β-mercaptoethanol; SH, Src homology; SHIP, SH2 domain–containing inositol-5-phosphatase; TI-2, T cell–independent type 2.
References
- Liu L., Damen J.E., Ware M., Hughes M., Krystal G. SHIP, a new player in cytokine-induced signalling. Leukemia. 1997;11:181–184. doi: 10.1038/sj.leu.2400559. [DOI] [PubMed] [Google Scholar]
- Lioubin M.N., Algate P.A., Tsai S., Carlberg K., Aeborsold R., Rohrschneider L.R. p150Ship, a signal transduction molecule with inositol polyphosphate-5-phosphatase activity. Genes Dev. 1996;10:1084–1095. doi: 10.1101/gad.10.9.1084. [DOI] [PubMed] [Google Scholar]
- Damen J.E., Liu L., Rosten P., Humphries R.K., Krystal G. The 145-kDa protein induced to associate with Shc by multiple cytokines is an inositol tetraphosphate and phosphatidyl 3,4,5-trisphosphate 5-phosphatase. Proc. Natl. Acad. Sci. USA. 1996;93:1689–1693. doi: 10.1073/pnas.93.4.1689. [DOI] [PMC free article] [PubMed] [Google Scholar]
- Kavanaugh W.M., Pot D.A., Chin S.M., Deuter-Reinhard M., Jefferson A.B., Norris F.A., Masiarz F.R., Cousens L.S., Majerus P.W., Williams L.T. Multiple forms of an inositol polyphosphate 5-phosphatase form signalling complexes with Shc and Grb2. Curr. Biol. 1996;6:438–445. doi: 10.1016/s0960-9822(02)00511-0. [DOI] [PubMed] [Google Scholar]
- Damen J.E., Liu L., Ware M., Ermolaeva M., Majerus P.W., Krystal G. Multiple forms of the SH2-containing inositol phosphatase, SHIP, are generated by C-terminal truncation. Blood. 1998;92:1199–1205. [PubMed] [Google Scholar]
- Lucas D.M., Rohrschneider L.R. A novel spliced form of SH2-containing inositol phosphatase is expressed during myeloid development. Blood. 1999;93:1922–1933. [PubMed] [Google Scholar]
- Huber M., Helgason C.D., Scheid M.P., Duronio V., Humphries R.K., Krystal G. Targeted disruption of SHIP leads to Steel factor-induced degranulation of mast cells. EMBO (Eur. Mol. Biol. Organ.) J. 1998;17:7311–7319. doi: 10.1093/emboj/17.24.7311. [DOI] [PMC free article] [PubMed] [Google Scholar]
- Liu Q., Shalaby F., Jones J., Bouchard D., Dumont D.J. The SH2-containing inositol polyphosphate 5-phosphatase, ship, is expressed during hematopoiesis and spermatogenesis. Blood. 1998;91:2753–2759. [PubMed] [Google Scholar]
- Geier S.J., Algate P.A., Carlberg K., Flowers D., Friedman C., Trask B., Rohrschneider L.R. The human SHIP gene is differentially expressed in cell lineages of the bone marrow and blood. Blood. 1997;89:1876–1885. [PubMed] [Google Scholar]
- Ono M., Hidetaka O., Bolland S., Yanagi S., Kurosaki T., Ravetch J.V. Deletion of SHIP or SHP-1 reveals two distinct pathways for inhibitory signaling. Cell. 1997;90:293–301. doi: 10.1016/s0092-8674(00)80337-2. [DOI] [PubMed] [Google Scholar]
- Coggeshall K.M. Inhibitory signaling by B cell FcγRIIb. Curr. Opin. Immunol. 1998;10:306–312. doi: 10.1016/s0952-7915(98)80169-6. [DOI] [PubMed] [Google Scholar]
- Diegel M.L., Rankin B.M., Bolen J.B., Dubois P.M., Kiener P.A. Cross-linking of Fcγ receptor to surface immunoglobulin on B cells provides an inhibitory signal that closes the plasma membrane calcium channel. J. Biol. Chem. 1994;269:11409–11416. [PubMed] [Google Scholar]
- Phillips N.E., Parker D.C. Cross-linking of B lymphocyte Fcγ receptors and membrane immunoglobulin inhibits anti-immunoglobulin-induced blastogenesis. J. Immunol. 1984;132:627–632. [PubMed] [Google Scholar]
- Pani G., Kozlowski M., Cambier J.C., Mills G.B., Siminovitch K.A. Identification of the tyrosine phosphatase PTP1C as a B cell antigen receptor–associated protein involved in the regulation of B cell signaling. J. Exp. Med. 1995;181:2077–2084. doi: 10.1084/jem.181.6.2077. [DOI] [PMC free article] [PubMed] [Google Scholar]
- Ashman R.F., Peckham D., Stunz L.L. Fc receptor off-signal in the B cell involves apoptosis. J. Immunol. 1996;157:5–11. [PubMed] [Google Scholar]
- Yamashita Y., Miyake K., Miura Y., Kaneko Y., Yagita H., Suda T., Nagata S., Nomura J., Sakaguchi N., Kimoto M. Activation mediated by RP105 but not CD40 makes normal B cells susceptible to anti-IgM–induced apoptosisa role for Fc receptor coligation. J. Exp. Med. 1996;184:113–120. doi: 10.1084/jem.184.1.113. [DOI] [PMC free article] [PubMed] [Google Scholar]
- Chacko G.W., Tridandipani S., Damen J.E., Liu L., Krystal G., Coggeshall K.M. Negative signaling in B lymphocytes induces tyrosine phosphorylation of the 145-kDa inositol polyphosphate 5-phosphatase, SHIP. J. Immunol. 1996;157:2234–2238. [PubMed] [Google Scholar]
- Ono M., Bolland S., Tempst P., Ravetch J.V. Role of the inositol phosphatase SHIP in negative regulation of the immune system by the receptor FcγRIIB. Nature. 1996;383:263–266. doi: 10.1038/383263a0. [DOI] [PubMed] [Google Scholar]
- Saxton T.M., van Oostveen I, Bowtell D., Aebersold R., Gold M.R. B cell antigen receptor cross-linking induces phosphorylation of the p21ras oncoprotein activators SHC and mSOS1 as well as assembly of complexes containing SHC, GRB-2, mSOS-1, and a 145-kDa tyrosine-phosphorylated protein. J. Immunol. 1994;153:623–636. [PubMed] [Google Scholar]
- Crowley M.T., Harmer S.L., DeFranco A.L. Activation-induced association of a 145-kDa tyrosine-phosphorylated protein with Shc and Syk in B lymphocytes and macrophages. J. Biol. Chem. 1996;271:1145–1152. doi: 10.1074/jbc.271.2.1145. [DOI] [PubMed] [Google Scholar]
- Harmer S.L., DeFranco A.L. The Src homology domain 2-containing inositol phosphatase SHIP forms a ternary complex with Shc and Grb2 in antigen receptor-stimulated B lymphocytes. J. Biol. Chem. 1999;274:12183–12191. doi: 10.1074/jbc.274.17.12183. [DOI] [PubMed] [Google Scholar]
- Buerstedde J.M., Takeda S. Increased ratio of targeted to random integration after transfection of chicken B cell lines. Cell. 1991;67:179–188. doi: 10.1016/0092-8674(91)90581-i. [DOI] [PubMed] [Google Scholar]
- Aman M.J., Lamkin T.D., Okada H., Kurosaki T., Ravichandran K.S. The inositol phosphatase SHIP inhibits Akt activation in B cells. J. Biol. Chem. 1998;273:33922–33928. doi: 10.1074/jbc.273.51.33922. [DOI] [PubMed] [Google Scholar]
- Okada H., Bolland S., Hashimoto A., Kurosaki M., Kabuyama Y., Iino M., Ravetch J.V., Kurosaki T. Cutting edgerole of the inositol phosphatase SHIP in B cell receptor-induced Ca2+ oscillatory response. J. Immunol. 1998;161:5129–5132. [PubMed] [Google Scholar]
- Bolland S., Pearse R.N., Kurosaki T., Ravetch J.V. SHIP modulates immune receptor responses by regulating membrane association of Btk. Immunity. 1998;8:509–516. doi: 10.1016/s1074-7613(00)80555-5. [DOI] [PubMed] [Google Scholar]
- Liu Q., Oliveira-Dos-Santos A.J., Mariathasan S., Bouchard D., Jones J., Sarao R., Kozieradzki I., Ohashi P.S., Penninger J.M., Dumont D.J. The inositol polyphosphate 5-phosphatase ship is a crucial negative regulator of B cell antigen receptor signaling. J. Exp. Med. 1998;188:1333–1342. doi: 10.1084/jem.188.7.1333. [DOI] [PMC free article] [PubMed] [Google Scholar]
- Helgason C.D., Damen J.E., Rosten P., Grewal R., Sorensen P., Chappel S.M., Borowski A., Jirik F., Krystal G., Humphries R.K. Targeted disruption of SHIP leads to hemopoietic perturbations, lung pathology, and a shortened life span. Genes Dev. 1998;12:1610–1620. doi: 10.1101/gad.12.11.1610. [DOI] [PMC free article] [PubMed] [Google Scholar]
- Sauvageau G., Lansdorp P.M., Eaves C.J., Hogge D.E., Dragowski W.H., Reid D.S., Largman C., Lawrence H.J., Humphries R.K. Differential expression of homeobox genes in functionally distinct CD34+ subpopulations of human bone marrow cells. Proc. Natl. Acad. Sci. USA. 1994;91:12223–12227. doi: 10.1073/pnas.91.25.12223. [DOI] [PMC free article] [PubMed] [Google Scholar]
- Karasuyama H., Melchers F. Establishment of mouse cell lines which constitutively secrete large quantities of interleukin 2, 3, 4 or 5 using modified cDNA expression vectors. Eur. J. Immunol. 1988;18:97–104. doi: 10.1002/eji.1830180115. [DOI] [PubMed] [Google Scholar]
- Rolink A., Andersson J., Melchers F. The SCID but not the RAG-2 gene product is required for Su-Se heavy chain class switching. Immunity. 1996;5:319–330. doi: 10.1016/s1074-7613(00)80258-7. [DOI] [PubMed] [Google Scholar]
- Liu L., Damen J.E., Hughes M.R., Babic I., Jirik F.R., Krystal G. The Src homology 2 (SH2) domain of SH2-containing inositol phosphatase (SHIP) is essential for tyrosine phosphorylation of SHIP, its association with Shc, and its induction of apoptosis. J. Biol. Chem. 1997;272:8983–8988. doi: 10.1074/jbc.272.14.8983. [DOI] [PubMed] [Google Scholar]
- Nishikawa S., Ogawa M., Nishikawa S., Kunisada T., Kodama H. B lymphopoiesis on stromal cell clonestromal cell clones acting on different stages of B cell differentiation. Eur. J. Immunol. 1988;18:1767–1771. doi: 10.1002/eji.1830181117. [DOI] [PubMed] [Google Scholar]
- Hardy R.R., Carmack C.E., Shinton S.A., Kemp J.D., Hayakawa K. Resolution and characterization of pro-B and pre–pro-B cell stages in normal mouse bone marrow. J. Exp. Med. 1991;173:1213–1225. doi: 10.1084/jem.173.5.1213. [DOI] [PMC free article] [PubMed] [Google Scholar]
- Osmond D.G. Proliferation kinetics and the lifespan of B cells in central and peripheral lymphoid organs. Curr. Opin. Immunol. 1991;3:179–185. doi: 10.1016/0952-7915(91)90047-5. [DOI] [PubMed] [Google Scholar]
- Rolink A., Melchers F. B lymphopoiesis in the mouse. Adv. Immunol. 1993;53:123–156. doi: 10.1016/s0065-2776(08)60499-x. [DOI] [PubMed] [Google Scholar]
- Rolink A., Grawunder U., Haasner D., Strasser A., Melchers F. Immature surface Ig+ B cells can continue to rearrange kappa and lambda L chain gene loci. J. Exp. Med. 1993;178:1263–1270. doi: 10.1084/jem.178.4.1263. [DOI] [PMC free article] [PubMed] [Google Scholar]
- Rolink A., Grawunder U., Winkler T.H., Karasuyama H., Melchers F. IL-2 receptor α chain (CD25, TAC) expression defines a crucial stage in pre-B cell development. Int. Immunol. 1994;6:1257–1264. doi: 10.1093/intimm/6.8.1257. [DOI] [PubMed] [Google Scholar]
- Osmond D.G., Rolink A., Melchers F. Murine B lymphopoiesistowards a unified model. Immunol. Today. 1998;19:65–68. doi: 10.1016/s0167-5699(97)01203-6. [DOI] [PubMed] [Google Scholar]
- Rolink A., Andersson J., Ghia P., Grawunder U., Kalberer C., Karasuyama H., Oka Y., Boekel E.T., Winkler T.H., Melchers F. Molecular mechanisms guiding B cell development. In: Ochs H.D., Smith C.I.E., Puck J.M., editors. Primary Immunodeficiency DiseasesA Molecular and Genetic Approach. Oxford University Press; New York: 1999. pp. 55–65. [Google Scholar]
- Collins L.S., Dorshkind K. A stromal cell line from myeloid long-term bone marrow cultures can support myelopoiesis and B lymphopoiesis. J. Immunol. 1987;138:1082–1087. [PubMed] [Google Scholar]
- Faust E.A., Saffran D.C., Witte O.N. Regulation of B-cell differentiation by stromal cells. In: Honjo T., Alt F.W., editors. Immunoglobulin Genes. Academic Press; London: 1995. pp. 103–128. [Google Scholar]
- Hayakawa K., Hardy R.R., Herzenberg L.A., Herzenberg L.A. Progenitors for Ly-1 B cells are distinct from progenitors of other cells. J. Exp. Med. 1985;161:1554–1568. doi: 10.1084/jem.161.6.1554. [DOI] [PMC free article] [PubMed] [Google Scholar]
- Kantor A.B., Herzenberg L.A. Origin of murine B cell lineages. Annu. Rev. Immunol. 1993;11:501–538. doi: 10.1146/annurev.iy.11.040193.002441. [DOI] [PubMed] [Google Scholar]
- Kroese F.G., Butcher E.C., Lalor P.A., Stall A.M., Herzenberg L.A. The rat B cell systemthe anatomical localization of flow cytometry-defined B cell subpopulations. Eur. J. Immunol. 1990;20:1527–1534. doi: 10.1002/eji.1830200718. [DOI] [PubMed] [Google Scholar]
- Wells S.M., Stall A.M., Kantor A.B., Herzenberg L.A. Development of B-cell subsets. In: Honjo T., Alt F.W., editors. Immunoglobulin Genes. Academic Press; London: 1995. pp. 83–101. [Google Scholar]
- Healy J.I., Dolmetsch R.E., Timmerman L.A., Cyster J.G., Thomas M.L., Crabtree G.R., Lewis R.S., Goodnow C.C. Different nuclear signals are activated by the B cell receptor during positive versus negative signaling. Immunity. 1997;6:419–428. doi: 10.1016/s1074-7613(00)80285-x. [DOI] [PubMed] [Google Scholar]
- Healy J.I., Goodnow C.C. Positive versus negative signaling by lymphocyte antigen receptors. Annu. Rev. Immunol. 1998;16:645–670. doi: 10.1146/annurev.immunol.16.1.645. [DOI] [PubMed] [Google Scholar]
- Jiang A., Craxton A., Kurosaki T., Clark E.A. Different protein tyrosine kinases are required for B cell antigen receptor–mediated activation of extracellular signal–regulated kinase, c-jun NH2-terminal kinase 1, and p38 mitogen-activated protein kinase. J. Exp. Med. 1998;188:1297–1306. doi: 10.1084/jem.188.7.1297. [DOI] [PMC free article] [PubMed] [Google Scholar]
- Su B., Karin M. Mitogen-activated protein kinase cascades and regulation of gene expression. Curr. Opin. Immunol. 1996;8:402–411. doi: 10.1016/s0952-7915(96)80131-2. [DOI] [PubMed] [Google Scholar]
- Treisman R. Regulation of transcription by MAP kinase cascades. Curr. Opin. Cell Biol. 1996;8:205–215. doi: 10.1016/s0955-0674(96)80067-6. [DOI] [PubMed] [Google Scholar]
- Alessi D.R., Cohen P. Mechanism of activation and function of protein kinase B. Curr. Opin. Genet. Dev. 1998;8:55–62. doi: 10.1016/s0959-437x(98)80062-2. [DOI] [PubMed] [Google Scholar]
- Downward J. Mechanisms and consequences of activation of protein kinase B/Akt. Curr. Opin. Cell Biol. 1998;10:262–267. doi: 10.1016/s0955-0674(98)80149-x. [DOI] [PubMed] [Google Scholar]
- Shultz L.D., Schweitzer P.A., Christianson S.W., Gott B., Schweitzer I.B., Tennent B., McKenna S., Mobraaten L., Rajan T.V., Greiner D.L., Leiter E.H. Multiple defects in innate and adaptive immunologic function in NOD/LtSz-scid mice. J. Immunol. 1995;154:180–191. [PubMed] [Google Scholar]
- D'Ambrosia D., Hippen K.L., Minskoff S.A., Mellman I., Pani G., Siminovitch K.A., Cambier J.C. Recruitment and activation of PTP1C in negative regulation of antigen receptor signaling by FcγRIIB1. Science. 1995;268:293–297. doi: 10.1126/science.7716523. [DOI] [PubMed] [Google Scholar]
- Cambier J.C., Pleiman C.M., Clark M.R. Signal transduction by the B cell antigen receptor and its coreceptors. Annu. Rev. Immunol. 1994;12:457–486. doi: 10.1146/annurev.iy.12.040194.002325. [DOI] [PubMed] [Google Scholar]
- DeFranco A.L. The complexity of signaling pathways activated by the BCR. Curr. Opin. Immunol. 1997;9:296–308. doi: 10.1016/s0952-7915(97)80074-x. [DOI] [PubMed] [Google Scholar]
- Rameh L.E., Cantley L.C. The role of phosphoinositide 3-kinase lipid products in cell function. J. Biol. Chem. 1999;274:8347–8350. doi: 10.1074/jbc.274.13.8347. [DOI] [PubMed] [Google Scholar]
- Brunet A., Bonni A., Zigmond M.J., Lin M.Z., Juo P., Hu L.S., Anderson M.J., Arden K.C., Blenis J., Greenberg M.E. Akt promotes cell survival by phosphorylating and inhibiting a forkhead transcription factor. Cell. 1999;96:857–868. doi: 10.1016/s0092-8674(00)80595-4. [DOI] [PubMed] [Google Scholar]
- Takai T., Ono M., Hikida M., Ohmori H., Ravetch J.V. Augmented humoral and anaphylactic responses in FcγRII-deficient mice. Nature. 1996;379:346–349. doi: 10.1038/379346a0. [DOI] [PubMed] [Google Scholar]
- Mond J.J., Lees A., Snapper C.M. T cell-independent antigens type 2. Annu. Rev. Immunol. 1995;13:655–692. doi: 10.1146/annurev.iy.13.040195.003255. [DOI] [PubMed] [Google Scholar]
- Huber M., Helgason C.D., Damen J.E., Liu L., Humphries R.K., Krystal G. The src homology 2-containing inositol phosphatase (SHIP) is the gatekeeper of mast cell degranulation. Proc. Natl. Acad. Sci. USA. 1998;95:11330–11335. doi: 10.1073/pnas.95.19.11330. [DOI] [PMC free article] [PubMed] [Google Scholar]
- Theofilopoulos A.N. The basis of autoimmunityPart l. Mechanisms of aberrant self-recognition. Immunol. Today. 1995;16:90–98. doi: 10.1016/0167-5699(95)80095-6. [DOI] [PubMed] [Google Scholar]
- Mohan C., Morel L., Yang P., Wakeland E.K. Genetic dissection of systemic lupus erythematosus pathogenesis. J. Immunol. 1997;159:454–465. [PubMed] [Google Scholar]