Distribution and activation of voltage-gated potassium channels in cell-attached and outside-out patches from large layer 5 cortical pyramidal neurons of the rat (original) (raw)
Abstract
- Voltage-gated potassium channels were studied in cell-attached and outside-out patches from the soma and primary apical dendrite of large layer 5 pyramidal neurons in acute slices of rat sensorimotor cortex (22–25 °C).
- Ensemble averages revealed that some patches contained only fast, _I_A-like channels, others contained only _I_K-like channels that did not inactivate or inactivated slowly, and the remainder contained mixtures of both channel types. _I_A and _I_K channels had mean unitary conductances of 8.5 and 20.3 pS, respectively, and had distinctive patterns of gating.
- Peak activation curves for ensemble-averaged currents were described by the Boltzmann equation with half-maximal voltage (_V_½) and slope factor (k) values of −24.5 mV and 16.9 mV for _I_A and −7.6 mV and 10.1 mV for _I_K (patches < 250 μm from the soma) or −22.9 mV and 16.2 mV for _I_A (patches > 250 μm from the soma). The steady-state inactivation curve for _I_A gave _V_½ and k values of −72.3 mV and −5.9 mV (< 250 μm from the soma) or −83.1 mV and −6.5 mV (> 250 μm from the soma). These values were similar to the corresponding data for _I_A and _I_K in nucleated patches from the same cell type.
- The amount of _I_A and _I_K present in patches depended weakly on distance along the primary apical dendrite from the soma. The amplitude of _I_A increased, on average, by 2.3 pA per 100 μm, while the amplitude of _I_K decreased by 0.4 pA per 100 μm.
- _I_A and _I_K channels in dendritic cell-attached patches were activated by the passage of a back-propagating action potential past the tip of the patch electrode. These results show directly that these potassium channels participate in action potential repolarisation, and thus contribute to the process of synaptic integration in these neurons.
Large pyramidal neurons in layer 5 of the rat neocortex are being studied increasingly for the light they shed on the mechanisms of synaptic integration (Stuart et al. 1997_b_). Despite their prominence as an experimental system, little is known about the types and distribution of ion channels in these neurons. Sodium channels have been directly mapped in the dendrites (Stuart & Sakmann, 1994) but information about other channel types is sparse. The aim of work described in this and the companion paper (Bekkers, 2000) was to characterise the different kinds of voltage-gated potassium channels present in large layer 5 pyramidal neurons of the rat sensorimotor cortex.
The first paper (Bekkers, 2000) showed that nucleated outside-out patches from large layer 5 pyramids contain two kinds of voltage-gated potassium conductance, _I_A and _I_K. In this second paper these experiments are extended to the single-channel level. It is confirmed that two types of potassium channel are readily distinguished in cell-attached and outside-out somatic and dendritic patches from these pyramidal neurons, corresponding to _I_A and _I_K. The distribution of these channels along the primary apical dendrite is presented. Finally, it is shown that physiological activation of these channels by back-propagating action potentials can be studied directly in cell-attached dendritic patches.
Some of these data have been presented in an abstract (Bekkers & Stuart, 1998).
METHODS
Slice preparation
Neocortical slices were prepared from Wistar rats aged between 13 and 28 days. No systematic effect of age was observed in the experiments reported here. Standard procedures were used which were approved by the Animal Experimentation Ethics Committee of the Australian National University (Stuart et al. 1993). Animals were killed by decapitation using a small-animal guillotine. Slices (300 μm thick) were cut under ice-cold slicing solution (composition below) using a Campden vibrating slicer (Loughborough, UK). They were maintained at room temperature in a holding chamber until use (1-5 h after slicing).
Solutions
The recording chamber was perfused continuously at 1.5 ml min−1 with the external solution comprising (mM): 125 NaCl, 3 KCl, 25 NaHCO3, 1.25 NaH2PO4, 1 MgCl2, 2 CaCl2, 10 or 25 glucose; 300 or 315 mosmol kg−1, pH 7.4 when bubbled with carbogen. The slicing solution was the same as the external solution except that it contained 6 mM MgCl2 and 1 mM CaCl2. For cell-attached patch experiments the electrode solution was the same as the external solution except that 10 mM Hepes (pH 7.4 with NaOH) was substituted for NaHCO3 and NaH2PO4 and the osmolality was adjusted to 290 mosmol kg−1 with sorbitol. This solution also contained 0.5-1 μM tetrodotoxin (TTX). For whole-cell or outside-out patch recordings the electrode contained (mM): 140 potassium methylsulphate (KMeSO4), 7 NaCl, 5 EGTA, 2 Mg-ATP, 10 Hepes; 280 mosmol kg−1, pH 7.2 when adjusted with KOH. All compounds were obtained from Sigma, except TTX (Alomone, Jerusalem, Israel).
Cell-attached and outside-out patch recording
The recording methods were the same as in the companion paper (Bekkers, 2000) except in the following respects. Patch pipettes were coated with Sylgard and polished, and had resistances of 8–15 MΩ when filled with Hepes-buffered external solution. _R_s compensation was not used. Patches (seal resistance > 2 GΩ) were obtained on the soma or primary apical dendrite of identified large layer 5 pyramidal neurons. The distance from the soma (Fig. 6) was measured from the centre of the nucleus.
Figure 6. Distribution of _I_A and _I_K channels along the primary apical dendrite.
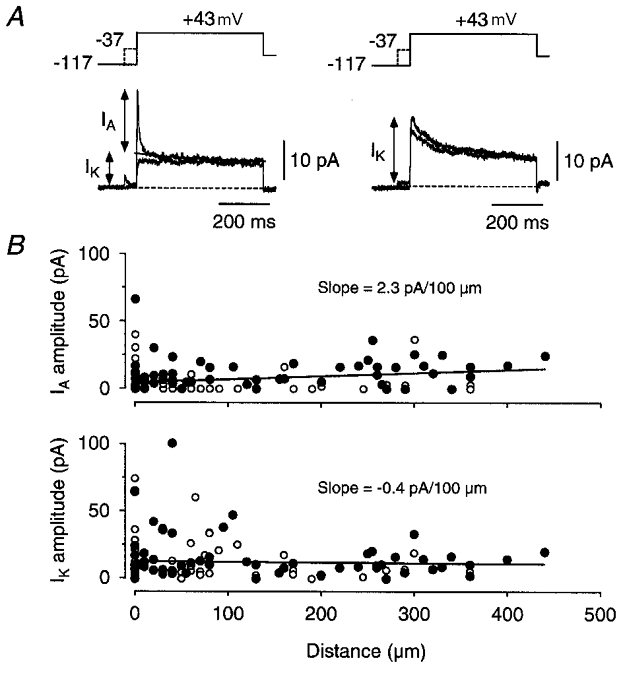
A, potassium currents in two different patches, showing how _I_A and _I_K were assayed. Currents were measured with and without a 50 ms prepulse to -37 mV to inactivate _I_A, if present. In most patches _I_A and _I_K were kinetically distinct (e.g. left traces) and their amplitudes were estimated by fitting the sum of two exponentials to the decaying phase of the current measured without the -37 mV prepulse (larger current, left). In patches containing only _I_A or _I_K (e.g. right traces, showing only _I_K) the current was measured from the peak response without the -37 mV prepulse (larger current, right). The patches shown here were obtained 260 μm (left; outside-out configuration) and 75 μm (right; cell-attached configuration) from the soma. Each trace is an average of 20 episodes. B, plots of peak _I_A (top) and peak _I_K (bottom) versus distance from the soma. Each circle represents the current recorded in a different patch, either in cell-attached (○, mostly overlapping at the soma; _n_= 73) or outside-out configuration (•; _n_= 55). The superimposed fits are given by _I_= 0.023 _d_+ 4.7 (_I_A) and _I_=−0.004 _d_+ 13.0 (_I_K) where I is the current in pA and d is distance in μm.
The membrane potential of cell-attached patches depended on the resting potential of the neuron. Immediately upon breaking into these large layer 5 pyramids, the resting potential recorded by the patch clamp amplifier averaged about -62 mV. However, it has been reported that the resting potential of hippocampal interneurons and pyramidal neurons, measured using a non-invasive technique, was on average 15 mV more negative than the value measured in whole-cell current clamp recordings, probably because of a Donnan potential (Verheugen et al. 1999; Fricker et al. 1999). Thus, the resting potential of layer 5 pyramids was assumed to be -62 – 15 =−77 mV and the membrane potentials for cell-attached patches were estimated on this basis. Since all conductances were calculated with respect to the measured reversal potential, any error in this estimate of the resting potential would simply shift the activation and inactivation curves along the voltage axis without changing their shapes (Figs 4 and 5).
Figure 4. Peak activation data for _I_A and _I_K.
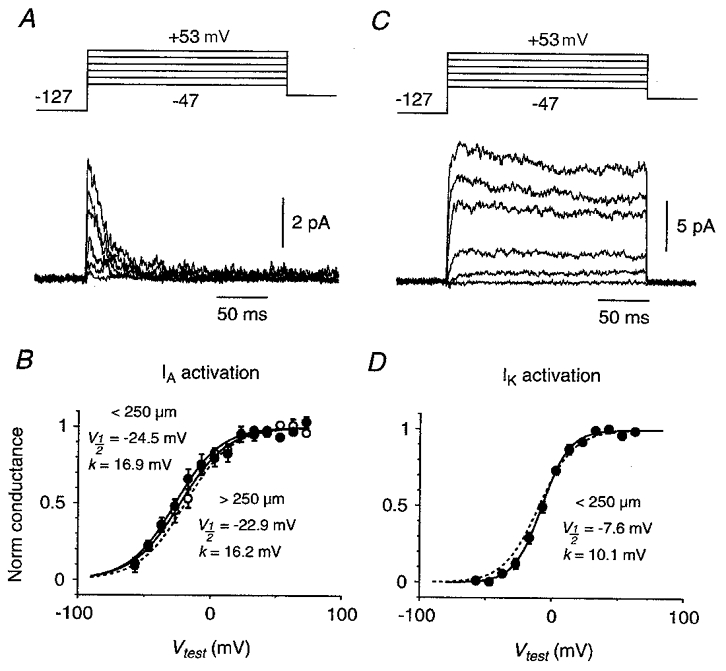
A, activation family for a cell-attached somatic patch containing pure _I_A. Following a 300 ms prepulse to -127 mV, the membrane potential was stepped to a test potential ranging from -47 to +53 mV in 20 mV increments. Each trace is an average of 10 episodes. Linear leak and capacitance currents have been subtracted. B, averaged, normalised peak activation plot for _I_A, measured in patches on the soma or on the primary apical dendrite <250 μm from the soma (•; _n_= 10) or >250 μm from the soma (○; _n_= 4). Error bars are ±s.e.m. The superimposed continuous curves are Boltzmann functions with the indicated fit parameters. The dashed curve is the Boltzmann fit to _I_A activation data measured in nucleated patches in TEA from the same cell type (Fig. 7_C_, Bekkers, 2000). C, activation family for a cell-attached dendritic patch (90 μm from the soma) containing a pure _I_K-like current. Recording conditions were identical to those in A, except that each trace is an average of 20 episodes. D, averaged, normalised peak activation plot for both inactivating and non-inactivating variants of _I_K-like current <250 μm from the soma (_n_= 26). The continuous curve is the Boltzmann function with the indicated fit parameters; the dashed curve is the fit for _I_K activation in nucleated patches in 4-AP (Fig. 7_F_, Bekkers, 2000).
Figure 5. Steady-state inactivation data for _I_A.
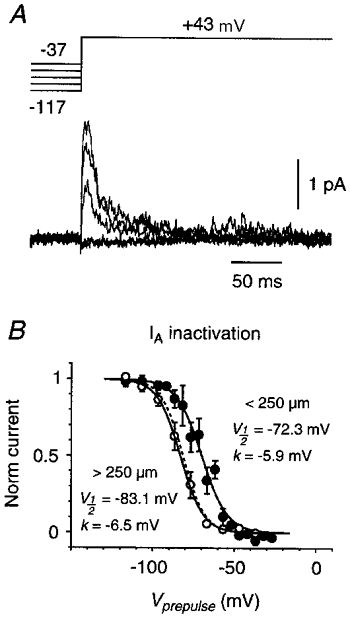
A, inactivation family for pure _I_A, measured in a cell-attached somatic patch. The prepulse voltage ranged from -117 to -37 mV in 20 mV increments, and its duration was 300 ms. Each trace is an average of 20 episodes. Leak currents have been subtracted. B, averaged, normalised steady-state inactivation plot for _I_A, measured in patches on the soma or on the primary apical dendrite <250 μm from the soma (•; _n_= 8) or >250 μm from the soma (○; _n_= 4). Error bars are ±s.e.m. Continuous curves are Boltzmann functions with the indicated fit parameters; the dashed curve is the fit for _I_A inactivation in nucleated patches in TEA (Fig. 6_B_, Bekkers, 2000).
Cell-attached patches were held at the resting membrane potential by clamping the interior of the electrode at 0 mV. Voltage clamp protocols were applied on the assumption that the resting potential of the neuron remained constant at -77 mV. Membrane potentials of outside-out patches were corrected for the measured liquid junction potential of -7 mV. Leak subtraction was applied to all recordings as in Bekkers (2000). Leak-subtracted currents were averaged 10–50 times for each pulse pattern. The stability of the recordings was confirmed by repeating some of the earlier command potentials at the end of the sequence (‘bracketing’). Individual episodes, without leak subtraction, were also stored in order to measure single-channel properties. After loss of the patch, the electrode offset was measured and found to be within the range ±1.5 mV. Experiments were done at room temperature (22-25°C).
Data analysis
Analysis was done using AxoGraph (Axon Instruments, Foster City, CA, USA). Amplitudes of averaged, leak-subtracted currents were measured by averaging over a time window chosen to be appropriate to the noise and kinetics of the currents (1-50 ms duration). In patches containing a mixture of _I_A and _I_K (e.g. Fig. 1_D_) the amplitude of each current was estimated by fitting the sum of two exponentials to the decaying phase, starting at the peak. Current (I) was converted to conductance using _G = I/(V_t_- E_K), where _V_t is the test potential and E_K is the measured reversal potential for I (see Results). Activation and inactivation plots were fitted to the Boltzmann relation f(V) = G_max/(1 + exp((V_½–_V)/k)), where _G_max is the maximal conductance, _V_½ is the voltage at which activation or inactivation is half-maximal, and k is the slope factor (a positive number for activation, a negative one for inactivation). To generate averaged, normalised activation and inactivation plots (Figs 4 and 5), the plots for individual experiments were normalised by dividing by the fitted _G_max.
Figure 1. Averaged outward currents in cell-attached somatic patches from large layer 5 cortical pyramidal cells show patch-to-patch kinetic diversity.
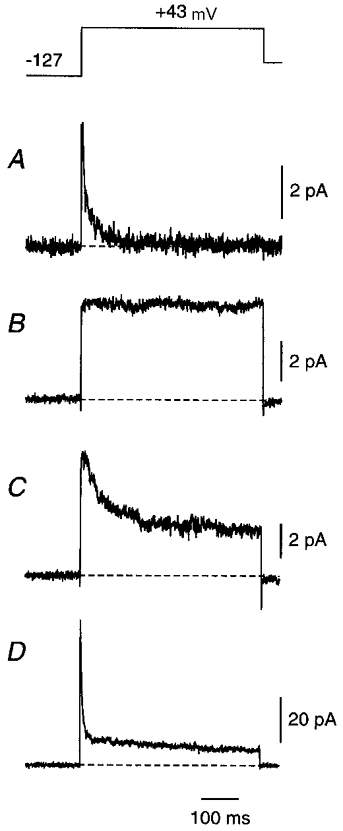
Following a 300 ms prepulse to -127 mV, the membrane potential was stepped to +43 mV for 500 ms (top). Capacitance transients and linear leak currents have been subtracted using an online subtraction protocol (Methods). A fast _I_A-like current was apparent in some patches, either in isolation (A) or with a slower _I_K-like current (D). In some patches the _I_K-like current inactivated during the test pulse (C) and in other patches it did not (B). All electrodes contained external solution plus 1 μM TTX but no other blockers. Each trace is an average of 10 (A and D), 20 (C) or 40 (B) episodes. Each patch is from a different neuron. Similar diversity was seen in dendritic patches and in outside-out patches.
Single-channel current amplitude at each test potential was estimated by fitting the sum of two Gaussian functions to averaged all-points histograms obtained from portions of episodes containing clear unitary steps. The difference between the means of the fitted Gaussian functions was taken as the single-channel current. The standard deviation (s.d.) of the Gaussian fit to the open channel level is shown as the error bars (± 1 s.d.) in Figs 2 and 3.
Figure 2. A smaller-conductance channel underlies the _I_A-like current.
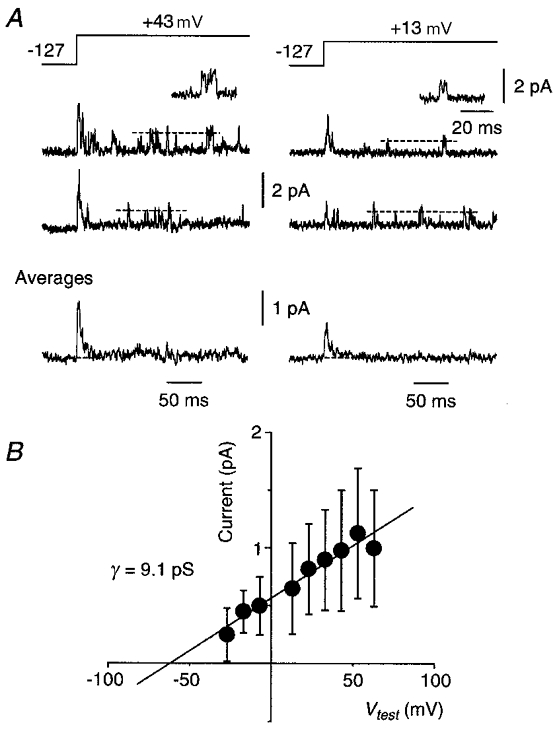
A, representative single episodes (top two data traces) recorded in a cell-attached somatic patch during a voltage step to two different test potentials (pulse protocol at top). Insets show on an expanded time scale the channel openings immediately below. Horizontal dashed lines indicate the mean open-channel current at each potential. Averages of 10 such episodes are shown at the bottom. Leak and capacitance currents have been subtracted. B, plot of mean single-channel current (±s.d.) versus membrane potential for this patch. The s.d. was obtained from a Gaussian fit to the amplitude histogram at each potential (Methods). The fitted straight line gave a single-channel conductance (γ) of 9.1 pS. The electrode solution contained 1 μM TTX but no other blockers.
Figure 3. A larger-conductance channel underlies the different inactivation variants of the _I_K-like current.
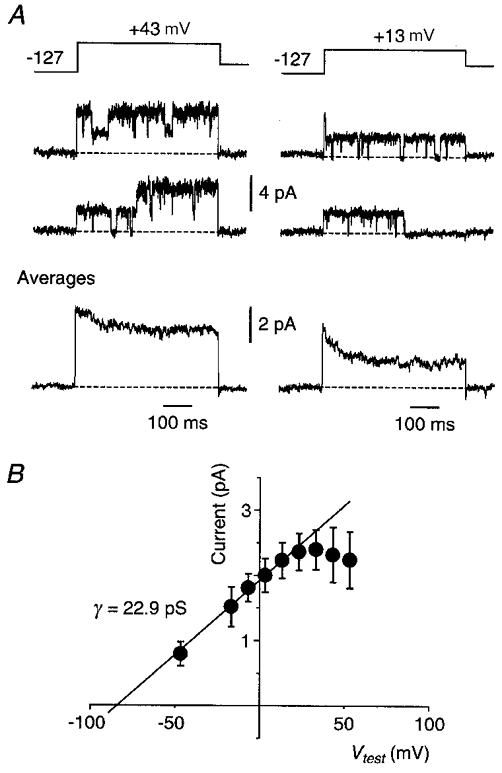
A, representative single episodes (top) and averages (_n_= 20; bottom) recorded in a somatic cell-attached patch at two different test potentials (pulse protocol at top). Horizontal dashed lines indicate the closed state. Linear leak and capacitance currents have been subtracted. Similar single-channel properties were seen for the channels underlying both inactivating (Fig. 1_C_) and non-inactivating (Fig. 1_B_) variants of the _I_K-like current. B, plot of mean single-channel current (±s.d.) versus membrane potential for this patch. Note the inward rectification at more strongly depolarised potentials. The straight line, fitted over the range -50 to +30 mV, gave a single-channel conductance of 22.9 pS. The electrode solution contained 1 μM TTX but no other blockers.
Curve fits were done using the Simplex algorithm built into AxoGraph, with the sum of squared errors as the minimisation parameter. Unless otherwise stated, errors are given as ±s.e.m., with n being the number of patches.
RESULTS
Kinetic diversity of outward currents in cell-attached and outside-out patches
Figure 1 shows averaged outward currents recorded from different cell-attached patches on the somata of large layer 5 cortical pyramidal neurons following a depolarising voltage clamp step. Much kinetic diversity is apparent. In these recordings linear leak and capacitance currents have been subtracted, and the electrode solution contained 1 μM TTX to block sodium channels. Blockers of calcium channels were not used, but inward channels were rarely seen. Note that in none of the experiments reported in this paper was 4-aminopyridine (4-AP) or tetraethylammonium (TEA) present in any solution (cf. Bekkers, 2000).
The kinetic diversity apparent in Fig. 1 contrasts with the stereotyped kinetics of outward currents recorded in nucleated patches pulled from the same cell type, presumably because nucleated patches contain many more channels (Bekkers, 2000). Two general classes of outward current were seen in cell-attached patches, as in nucleated patches. A fast transient current resembled _I_A (Fig. 1_A_). This current, when present in a cell-attached patch, was very consistent in all its properties (below). A slow transient or plateau current was also observed, which may correspond to _I_K (Fig. 1_B_ and C). Surprisingly, however, the _I_K-like current was variable in its inactivation behaviour: in some cell-attached patches it inactivated like _I_K in nucleated patches (Fig. 1_C_); in other patches it did not inactivate at all during a 500 ms test pulse (Fig. 1_B_). In some patches, particularly those containing many channels, a mixture of _I_A and _I_K was seen (Fig. 1_D_). The same kinetic diversity was also apparent in outside-out patches (not illustrated).
In order to further distinguish these different types of current, single-channel recordings were analysed.
Two types of single-channel outward currents
Two distinct types of single-channel currents were observed in cell-attached and outside-out somatic patches (Figs 2 and 3). One type of channel had shorter open times and a mean conductance of 8.5 ± 0.3 pS (±s.e.m., _n_= 3; Fig. 2). Averages of this channel type gave a pure _I_A-like current (Fig. 2_A_). Although it was only possible to measure the single-channel amplitude of this channel at times well past the peak of the average (Fig. 2_A_, dashed lines), these delayed events were completely inactivated by a depolarising prepulse, just like the early events comprising the _I_A-like average (Fig. 2_A_; see Fig. 5).
Another channel seen in these patches had longer open times, exhibited prominent open-channel noise, was inwardly rectifying at strongly depolarised potentials, and had a mean conductance of 20.3 ± 1.2 pS (_n_= 7; Fig. 3). Ensemble averages of this type of channel gave pure _I_K-like currents in different patches, both inactivating (_n_= 3; Figs 1_C_ and 3_A_) and non-inactivating variants (_n_= 4; Fig. 1_B_). Thus it appears that a single type of channel underlies the different forms of the slow, _I_K-like current, but its inactivation properties may vary.
For convenience, the fast transient and slowly inactivating/ non-inactivating currents seen in these patches will henceforth be called _I_A and _I_K, respectively.
Reversal potentials
Single-channel current-voltage plots for _I_K gave a mean reversal potential of -82 ± 6 mV (_n_= 5), close to the mean reversal potential for _I_K in nucleated patches (-86 mV; Bekkers, 2000). Similar experiments for _I_A gave unreliable results, owing to the larger measurement errors for these smaller, faster channels (Fig. 2). Thus, the reversal potential for _I_A was assumed to be 16 mV depolarised to that of _I_K, as was found for nucleated patches (Bekkers, 2000). This yielded an estimated reversal potential for _I_A of about -66 mV.
Peak current activation
Averaged voltage clamp families were used to construct peak current activation plots for _I_A and _I_K. Following a 300 ms prepulse to -127 mV, the membrane potential was stepped to a range of test potentials (Fig. 4). For each patch, measurements of peak mean current at each test potential were converted to conductance using the appropriate reversal potential. Each conductance versus test potential plot was fitted to the Boltzmann equation (Methods).
Averaged fit parameters for _I_A were _V_½=−24.5 ± 3.7 mV and _k_= 16.9± 1.9 mV (_n_= 10) for patches on the soma or on the primary apical dendrite < 250 μm from the soma (Fig. 4_B_, filled circles), and _V_½=−22.9 ± 3.6 mV and _k_= 16.2± 0.8 mV (_n_= 4) for patches > 250 μm from the soma (Fig. 4_B_, open circles). For _I_K the values were _V_½=−7.6 ± 1.5 mV and _k_= 10.1± 0.6 mV (_n_= 26) for patches on the soma or < 250 μm (Fig. 4_D_). Insufficient data were obtained for _I_K in patches > 250 μm from the soma. The mean fit parameters for inactivating (Fig. 1_C_) and non-inactivating (Fig. 1_B_) variants of _I_K were not significantly different (P > 0.1, t test). Mean activation plots for _I_A and _I_K recorded in cell-attached or outside-out patches were similar to those obtained in nucleated patches (dashed curves in Fig. 4_B_ and D are from Bekkers, 2000).
The fitted maximal conductance, _G_max, was very variable between patches for both _I_A and _I_K. Dividing _G_max by the appropriate single-channel conductance (Figs 2 and 3) gave estimates of the minimum number of channels in each patch. This was in the range 1–54 for _I_A (mean ±s.e.m., 39 ± 5, _n_= 14) and 1–46 for _I_K (9 ± 2, _n_= 26).
Steady-state inactivation
Inactivation families of _I_A currents were acquired by stepping from a 300–500 ms prepulse potential (ranging from -117 to -27 mV) to a fixed test potential of +43 mV (Fig. 5_A_). Averaged Boltzmann fit parameters were _V_½=−72.3 ± 2.8 mV and _k_=−5.9± 0.8 mV (_n_= 7) for patches on the soma or < 250 μm from the soma (Fig. 5_B_, filled circles), and _V_½=−83.1 ± 2.6 mV and _k_=−6.5± 0.2 mV (_n_= 4) for patches > 250 μm from the soma (Fig. 5_B_, open circles). The dashed curve (Fig. 5_B_) is the corresponding Boltzmann fit for _I_A in nucleated patches (Bekkers, 2000).
Steady-state inactivation plots for _I_K were very variable (not illustrated), reflecting their variable inactivation kinetics (Fig. 1), and were not examined further.
Kinetic fits
Averaged potassium currents recorded in these patches were generally too noisy to permit reliable fits to their entire time course (cf. nucleated patch currents; Bekkers, 2000). However, the inactivation kinetics of _I_A could be estimated with reasonable accuracy by fitting a single exponential to the decay of traces like those in Fig. 4_A_. As for _I_A in nucleated patches, the decay time constant was nearly voltage independent in the range -37 to +63 mV (not illustrated). It had a mean value of 9.4 ± 0.7 ms (_n_= 11) compared with 6.9 ± 0.2 ms for nucleated patches from the same cell type (Bekkers, 2000).
The inactivation kinetics of the decaying form of _I_K were variable. Fits of a single exponential plus a constant to traces like those in Fig. 1_C_ gave time constants in the range ∼50-200 ms (_n_= 15) with little voltage dependence (not illustrated).
Distribution of _I_A and _I_K along the primary apical dendrite
A standard pulse protocol was used to assay the amount of _I_A and _I_K in cell-attached and outside-out patches at different distances from the soma along the primary apical dendrite (Fig. 6_A_). Following a 500 ms conditioning prepulse to -117 mV, the membrane potential was stepped to a test pulse of +43 mV (producing the larger currents, Fig. 6_A_). In most patches _I_A and _I_K were kinetically distinct and their amplitudes could be estimated either by fitting the sum of two exponentials to the decaying phase (Fig. 6_A_, left) or, in cases where _I_A or _I_K was absent, from the peak amplitude (e.g. Fig. 6_A_, right). In order to check this identification of _I_A and _I_K, a 50 ms-long prepulse to -37 mV, which fully inactivates _I_A in nucleated patches (Bekkers, 2000), was inserted before the test pulse (Fig. 6_A_, top). This confirmed the kinetic separation.
Plots of the amplitude of _I_A and I_K_versus distance from the soma showed that both types of conductance were rather uniformly distributed along the primary apical dendrite, at least, for distances less than ∼400 μm (Fig. 6_B_; _n_= 128 patches). The unconstrained fit of a straight line to the data points gave a slope of 2.3 pA/100 μm for _I_A and -0.4 pA/100 μm for _I_K.
Activation of _I_K by back-propagating action potentials
Recording of channel activity in situ in cell-attached patches enables not only a study of the response to step depolarisations, as done above, but also the effect of more physiological stimulus patterns, such as might be provided by action potentials. An example of such an experiment is shown in Fig. 7. Two patch electrodes were placed on the same large layer 5 cortical pyramidal neuron, one to record in whole-cell mode at the soma, the other to record in cell-attached mode from the primary apical dendrite (inset, top, Fig. 7). The interior of the dendritic electrode was held at 0 mV, so that the membrane potential of the patch was equal to the resting potential of the neuron.
Figure 7. Back-propagating action potentials activate voltage-gated dendritic potassium channels.
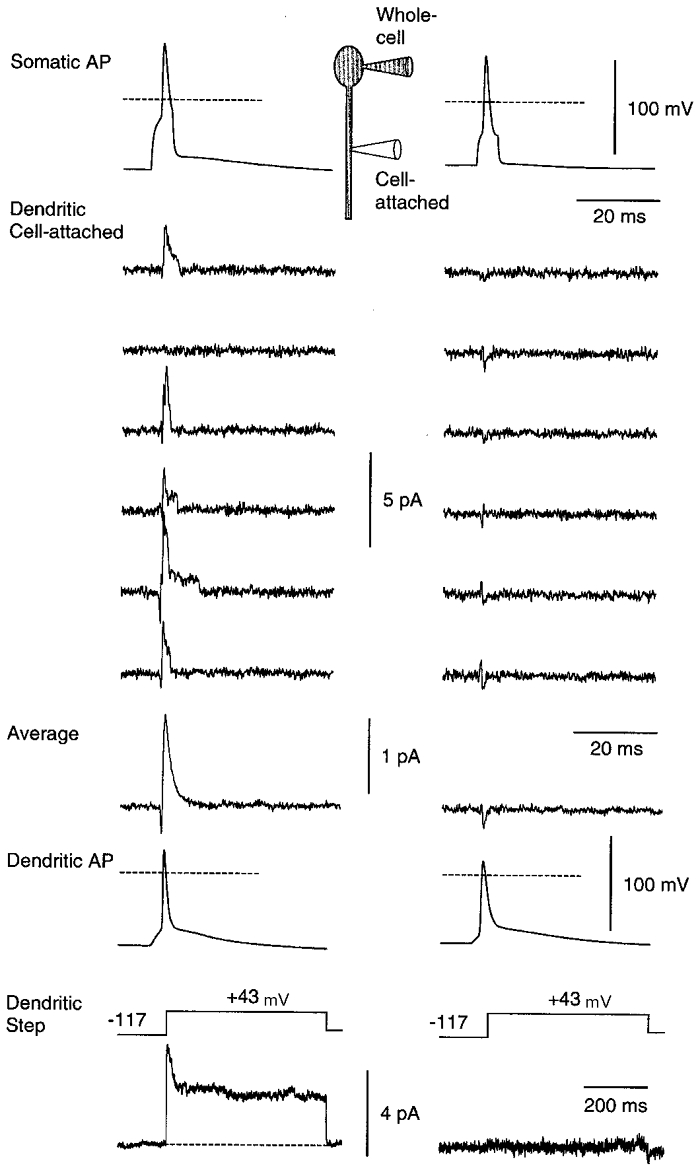
Each column shows data from a different neuron. The inset (top) shows schematically the recording configuration. A 5 ms-long 400 pA current step was injected at the soma, evoking an action potential (Somatic AP; horizontal dashed line is 0 mV). A cell-attached patch electrode on the primary apical dendrite 100 μm (left) or 135 μm (right) from the soma was used to record single potassium channels activated by the passage of the back-propagating action potential (Dendritic Cell-attached). Typical consecutive trials are shown. The interior of this dendritic electrode, which contained Hepes-buffered external solution plus 0.5 μM TTX, was voltage clamped at 0 mV. A capacitance artefact, due to the passage of the action potential past the tip of the dendritic electrode, has been subtracted (see text). Occasional downward spikes are subtraction artefacts resulting from jitter in the timing of the action potentials. Clear channel activity is apparent in the left patch, but not in the right patch. Averages of 99 (left) or 60 (right) trials are shown (Average). The left-hand average has a decay time constant of 1.5 ms. A depolarising voltage step applied to the dendritic patch via the dendritic electrode revealed a mixed _I_A and _I_K current in the left patch, but no channels in the right patch (Dendritic Step). Finally, the membrane under the tip of the dendritic electrode was ruptured in order to measure the action potential at the recording site (Dendritic AP).
A depolarising current step at the soma fired a back-propagating action potential (Somatic AP, Fig. 7) which generated a capacitance current (∼20 pA amplitude) in the cell-attached electrode as it passed by the electrode tip (not illustrated). Because this capacitance artefact overlay single-channel activity in the patch, it was removed as follows. After acquiring a number of test episodes with the interior of the dendritic electrode held at 0 mV, the electrode interior was clamped at +100 mV. This hyperpolarised the patch by 100 mV, preventing activation of channels by the action potential depolarisation passing the tip of the electrode. The capacitance current was unaffected by this hyperpolarisation. A number of such capacitance artefacts were averaged together and subtracted from each test episode. This revealed the channel activity with minimal contamination (Dendritic Cell-attached). Occasional downward spikes in the subtracted episodes result from jitter in the timing of the action potentials.
Averaging the subtracted episodes in the left-hand column, Fig. 7, gave a current that decayed with a time constant of 1.5 ms (Average). The mean decay time constant in seven experiments was 2.2 ± 0.2 ms (±s.e.m.) and did not seem to depend on whether the patch contained only _I_A or _I_K or a mixture of the two. Voltage steps were subsequently applied to the dendritic patch via the cell-attached electrode, revealing that the patch in the left-hand column contained both _I_A and _I_K channels (Dendritic Step). Finally, the dendritic patch was ruptured and the dendritic action potential at the recording site was measured (Dendritic AP).
The patch in the right-hand column of Fig. 7 contained no channels as assayed by the dendritic step, and also showed no channel activity following the dendritic action potential. This confirms the validity of the subtraction procedure. The same result was obtained in four control experiments of this sort.
DISCUSSION
This paper extends the results of the previous one (Bekkers, 2000) by examining at the single-channel level the properties of voltage-gated potassium conductances in large layer 5 cortical pyramidal neurons, and by mapping the dendritic distribution of the channels. Two types of potassium channel were seen in patches, based on the conductance, kinetics and voltage dependence of activation and inactivation. These two channel types resembled the two kinds of potassium current, _I_A and _I_K, seen in nucleated outside-out patches pulled from the same neurons, with some differences that will be discussed below. These results therefore confirm the separation of channel types established in Bekkers (2000). The results also show that these channels are rather uniformly distributed along the primary apical dendrite (Fig. 6), and that the channels can be activated under quasi-physiological conditions by dendritic action potentials (Fig. 7).
Comparison with nucleated patches
The _I_A-like current seen in cell-attached and conventional outside-out patches was, for every measured property, similar to _I_A in nucleated patches. The decay time constant was fast (7-9 ms) and voltage independent in both preparations. The voltage dependence of activation was nearly identical (Fig. 4_B_), as was inactivation in patches > 250 μm from the soma (open circles, Fig. 5_B_). Inactivation in patches < 250 μm from the soma was depolarised by about 10 mV compared with nucleated patches (filled circles, Fig. 5_B_), which might reflect measurement errors or the possibility that _I_A is slightly modified by the process of pulling a nucleated patch.
The _I_K-like current was also similar to the corresponding current in nucleated patches. The voltage dependence of activation was almost identical (Fig. 4_D_) and the decay kinetics were similarly slow. However, unlike I_K in nucleated patches, which inactivated with stereotypical time constants of about 460 ms and 4.2 s (Fig. 9_A, Bekkers, 2000), _I_K in cell-attached and outside-out patches displayed highly variable inactivation (Fig. 1). In some patches _I_K did not inactivate at all during a 500 ms test pulse (e.g. Fig. 1_B_). It is unlikely that different channel classes underlie these differences, because single-channel recording revealed that the same kind of 20 pS inwardly rectifying channel comprised both inactivating and non-inactivating variants (Fig. 3). An alternative explanation is that a single class of channel is differentially inactivated from patch to patch, or enters distinct, long-lived inactivation ‘modes’ (Bossu & Gähwiler, 1996). Inactivation of potassium channels has been reported to be modulated by phosphorylation (Perozo et al. 1991), oxidation state (Ruppersberg et al. 1991) and cytosolic calcium (Hasegawa & Russell, 1998), amongst other factors. It is possible that spatial or temporal variations in these factors could alter the inactivation process.
Single-channel properties
Many kinds of single potassium channels have been identified in neurons, giving rise to a large and confusing literature. Comparisons are often difficult because of unphysiological recording conditions (e.g. high external potassium) and lack of information relating the single-channel activity to whole-cell currents in the same neuron. The experiments presented here sought to alleviate both of these concerns by recording with quasi-physiological solutions from a cell type in which the whole-cell currents previously had been characterised.
Two distinct types of single potassium channel were resolved in these experiments, although it is possible that more careful study would reveal further subdivisions. The ∼9 pS channel underlying an _I_A-like current (Fig. 2) has a similar conductance to a channel that generates _I_A in rat CA1 pyramidal neurons under similar recording conditions (7.5 pS; Hoffman et al. 1997). Multiple conductance sublevels have been reported for _I_A-like channels when recording with high external potassium (Forsythe et al. 1992; Kang et al. 2000). Sublevels were not convincingly resolved here, when recording with physiological potassium concentrations, because of the brief open times of the channels (Fig. 2_A_). The ∼20 pS channel underlying an _I_K-like current (Fig. 3) has the same conductance as a delayed rectifier channel in dissociated cultures of rat hippocampus (Linsdell & Stanfield, 1993). This hippocampal channel also exhibits inward rectification at strongly depolarised membrane potentials (cf. Fig. 3_B_), which is attributed to block by internal cations (Linsdell & Stanfield, 1993).
An _I_K-like channel that is blocked by 100 μM 4-AP and 20 mM TEA (_I_K(AT)) has been identified in rat CA3 pyramidal neurons in organotypic cultures (Bossu & Gähwiler, 1996). _I_K(AT) channels have the same unitary conductance as the _I_K channels found here, and exhibit similarly prolonged burst durations (Fig. 3_A_). Interestingly, _I_K(AT) channels are reported to switch between ‘transient’ and ‘sustained’ current modes, generating averaged currents which resemble the different forms of _I_K shown in Fig. 1_B_ and C. Thus, the presence of this kind of channel in large layer 5 neurons could explain the highly variable inactivation of _I_K that was observed here. A difficulty with this idea is that, unlike _I_K(AT) current, _I_K in nucleated patches from layer 5 pyramids was little affected by low concentrations of extracellular 4-AP (Bekkers, 2000). However, it is possible that 4-AP blocks these channels via cytoplasmic messengers that are washed out of nucleated patches (Bossu & Gähwiler, 1996). Future work would need to establish whether this is the case and, if so, what factors might cause these channels to switch between different inactivation modes.
Dendritic distribution and back-propagating action potentials
The amplitudes of _I_A and _I_K depended weakly on distance along the primary apical dendrite from the soma, at least for distances less than about 400 μm (Fig. 6_B_). The distribution of _I_K is similar in hippocampal CA1 pyramidal neurons, but that of _I_A is strikingly different (Hoffman et al. 1997; slope 12.5 pA per 100 μm, cf. 2.3 pA per 100 μm here). The larger _I_A conductance in the distal dendrites of CA1 pyramids, compared with layer 5 pyramids, is expected to produce differences in dendritic processing in the two cell types. In layer 5 pyramids the half-width of the action potential increases as it propagates into the primary apical dendrite (Stuart et al. 1997_a_). It would be useful to examine whether CA1 pyramids, with their large dendritic _I_A conductance to terminate the dendritic spike, show a weaker prolongation of action potential half-width with dendritic distance.
The participation of _I_A and _I_K in action potential repolarisation was demonstrated directly by measuring potassium channels that opened following the passage of a single dendritic spike (Fig. 7). The ensemble average of this channel activity decayed with a time constant of about 1.5 ms, which is slightly slower than the decay of the action potential recorded at the same location (∼1 ms; Fig. 7). This contrasts with a recent report that _I_A channels, measured in cell-attached patches on the somata of layer 5 pyramidal neurons, close slowly (over tens of milliseconds) after being opened by an action potential (Kang et al. 2000). The discrepancy might be related to the use by Kang et al. (2000) of a high-potassium external solution in their electrodes.
In future work it would be interesting to measure potassium channel activity during bursts of action potentials. In particular, _I_K, with its slow inactivation, might have a powerful and prolonged dampening effect on burst firing, when the membrane potential remains elevated for tens of milliseconds (Schwindt & Crill, 1997; Larkum et al. 1999). Furthermore, both _I_A and _I_K being subject to neuromodulation (Bossu & Gähwiler, 1996; Colbert & Pan, 1999), they are expected to have a tunable effect on the excitability and integrative properties of these neurons.
Acknowledgments
I thank Professor Bert Sakmann, in whose laboratory this work was begun, the Ramaciotti Foundations and the Wellcome Trust for a travel grant, and the Alexander von Humboldt Foundation for the award of a Research Fellowship. I am grateful to Dr Greg Stuart for the use of equipment and his participation in some of the experiments, and to Dr Matthew Larkum for his advice on preparing cortical slices. Drs Pankaj Sah, Greg Stuart and Stephen Williams provided helpful comments on the manuscript.
References
- Bekkers JM. Properties of voltage-gated potassium currents in nucleated patches from large layer 5 cortical pyramidal neurons of the rat. The Journal of Physiology. 2000;525:593–609. doi: 10.1111/j.1469-7793.2000.t01-1-00593.x. [DOI] [PMC free article] [PubMed] [Google Scholar]
- Bekkers JM, Stuart G. Distribution and properties of potassium channels in the soma and apical dendrites of layer 5 cortical pyramidal neurons. Society for Neuroscience Abstracts. 1998;24:2019. [Google Scholar]
- Bossu J-L, Gähwiler BH. Distinct modes of channel gating underlie inactivation of somatic K+ current in rat hippocampal pyramidal cells in vitro. The Journal of Physiology. 1996;495:383–397. doi: 10.1113/jphysiol.1996.sp021601. [DOI] [PMC free article] [PubMed] [Google Scholar]
- Colbert CM, Pan E. Arachidonic acid reciprocally alters the availability of transient and sustained dendritic K+ channels in hippocampal CA1 pyramidal neurons. Journal of Neuroscience. 1999;19:8163–8171. doi: 10.1523/JNEUROSCI.19-19-08163.1999. [DOI] [PMC free article] [PubMed] [Google Scholar]
- Forsythe ID, Linsdell P, Stanfield PR. Unitary A-currents of rat locus coeruleus neurones grown in cell culture: rectification caused by internal Mg2+ and Na+ The Journal of Physiology. 1992;451:553–583. doi: 10.1113/jphysiol.1992.sp019179. [DOI] [PMC free article] [PubMed] [Google Scholar]
- Fricker D, Verheugen JAH, Miles R. Cell-attached measurements of the firing threshold of rat hippocampal neurones. The Journal of Physiology. 1999;517:791–804. doi: 10.1111/j.1469-7793.1999.0791s.x. [DOI] [PMC free article] [PubMed] [Google Scholar]
- Hasegawa Y, Russell JT. Modulation of delayed rectifier potassium currents in rat pineal cells by cytosolic Ca2+ Society for Neuroscience Abstracts. 1998;24:1083. [Google Scholar]
- Hoffman DA, Magee JC, Colbert CM, Johnston D. K+ channel regulation of signal propagation in dendrites of hippocampal pyramidal neurons. Nature. 1997;387:869–875. doi: 10.1038/43119. [DOI] [PubMed] [Google Scholar]
- Kang J, Huguenard JR, Prince DA. Voltage-gated potassium channels activated during action potentials in layer V neocortical pyramidal neurons. Journal of Neurophysiology. 2000;83:70–80. doi: 10.1152/jn.2000.83.1.70. [DOI] [PubMed] [Google Scholar]
- Larkum ME, Zhu JJ, Sakmann B. A new cellular mechanism for coupling inputs arriving at different cortical layers. Nature. 1999;398:338–341. doi: 10.1038/18686. [DOI] [PubMed] [Google Scholar]
- Linsdell P, Stanfield PR. Unitary delayed rectifier channels of rat hippocampal neurons: properties of block by external tetraethylammonium ions. Pflügers Archiv. 1993;425:41–53. doi: 10.1007/BF00374502. [DOI] [PubMed] [Google Scholar]
- Perozo E, Jong DS, Bezanilla F. Single channel studies of the phosphorylation of K+ channels in the squid giant axon. Journal of General Physiology. 1991;98:19–34. doi: 10.1085/jgp.98.1.19. [DOI] [PMC free article] [PubMed] [Google Scholar]
- Ruppersberg JP, Stocker M, Pongs O, Heinemann SH, Frank R, Koenen M. Regulation of fast inactivation of cloned mammalian IK(A) channels by cysteine oxidation. Nature. 1991;352:711–714. doi: 10.1038/352711a0. [DOI] [PubMed] [Google Scholar]
- Schwindt PC, Crill WE. Modification of current transmitted from apical dendrite to soma by blockade of voltage- and Ca+-dependent conductances in rat neocortical pyramidal neurons. Journal of Neurophysiology. 1997;78:187–198. doi: 10.1152/jn.1997.78.1.187. [DOI] [PubMed] [Google Scholar]
- Stuart G, Schiller J, Sakmann B. Action potential initiation and propagation in rat neocortical pyramidal neurons. The Journal of Physiology. 1997a;505:617–632. doi: 10.1111/j.1469-7793.1997.617ba.x. [DOI] [PMC free article] [PubMed] [Google Scholar]
- Stuart G, Spruston N, Sakmann B, Häusser M. Action potential initiation and backpropagation in neurons of the mammalian CNS. Trends in Neurosciences. 1997b;20:125–131. doi: 10.1016/s0166-2236(96)10075-8. [DOI] [PubMed] [Google Scholar]
- Stuart GJ, Dodt H-U, Sakmann B. Patch-clamp recordings from the soma and dendrites of neurons in brain slices using infrared video microscopy. Pflügers Archiv. 1993;423:511–518. doi: 10.1007/BF00374949. [DOI] [PubMed] [Google Scholar]
- Stuart GJ, Sakmann B. Active propagation of somatic action potentials into neocortical pyramidal cell dendrites. Nature. 1994;367:69–72. doi: 10.1038/367069a0. [DOI] [PubMed] [Google Scholar]
- Verheugen JAH, Fricker D, Miles R. Noninvasive measurements of the membrane potential and GABAergic action in hippocampal interneurons. Journal of Neuroscience. 1999;19:2546–2555. doi: 10.1523/JNEUROSCI.19-07-02546.1999. [DOI] [PMC free article] [PubMed] [Google Scholar]