Complex behavior in solution of homodimeric SecA (original) (raw)
Abstract
SecA, a homodimeric protein involved in protein export in Escherichia coli, exists in the cell both associated with the membrane translocation apparatus and free in the cytosol. SecA is a multifunctional protein involved in protein localization and regulation of its own expression. To carry out these functions, SecA interacts with a variety of proteins, phospholipids, nucleotides, and nucleic acid and shows two enzymic activities. It is an ATPase and a helicase. Its role during protein localization involves interaction with the precursor polypeptides to be exported, the cytosolic chaperone SecB, and the SecY subunit of the membrane-associated translocase, as well as with acidic phospholipids. At the membrane, SecA undergoes a cycle of binding and hydrolysis of ATP coupled to conformational changes that result in translocation of precursors through the cytoplasmic membrane. The helicase activity of SecA and its affinity for its mRNA are involved in regulation of its own expression. SecA has been reported to exist in at least two conformational states during its functional cycle. Here we have used analytical centrifugation, as well as column chromatography coupled with multiangle light scatter, to show that in solution SecA undergoes at least two monomer-dimer equilibrium reactions that are sensitive to temperature and to concentration of salt.
Keywords: SecA, protein export, homodimer, equilibrium constant, light scatter
SecA is the peripherally membrane-bound ATPase that is required for the export of proteins from the bacterial cytoplasm to the periplasm and outer membrane (Fekkes and Driessen 1999 for a review), as well as for insertion into the cytoplasmic membrane (Qi and Bernstein 1999; Tian et al. 2000). It is a part of the membrane translocase that contains two additional integral membrane heterotrimeric protein complexes, one comprising SecY, SecE, and SecG and the other comprising SecD, SecF, and YajC. SecA receives the precursors of exported proteins, either from the chaperone SecB, to which it also binds, or directly from the cytosol or other chaperones. It initiates translocation in the presence of ATP by forcing a portion of the precursor to the periplasmic side of the membrane. Repeated cycles of hydrolysis of ATP cause further translocation of the precursor molecule in vitro, whereas in vivo the electrochemical membrane potential is also required.
In vivo, ∼50% of the SecA is found at the membrane and the remainder is free in the cytosol (Akita et al. 1991; Cabelli et al. 1991). The active form at the membrane is a homodimer with subunits of molecular weight 102,000 (Driessen 1993). Because SecA functions as a dimer, it is critical to characterize the self-association reaction. Here we investigate that reaction in solution and find evidence for multiple equilibria characterized by dissociation constants that, depending on temperature and ionic strength, vary from 0.1 to 1 μM.
Results
Demonstration of monomer-dimer equilibria
When purified SecA was subjected to size exclusion column chromatography, the elution volume of the protein increased with decreasing concentration of the sample applied to the column (Fig. 1 ▶). This behavior is characteristic of an oligomeric protein undergoing dissociation as it traverses the column. The position of elution of such a protein is dependent on the weighted average size of the molecules in the population. For a dimer like SecA, at low concentration the probability is high that the molecules are monomeric and thus the protein elutes late. In contrast, at high concentration the dimeric state is populated with high probability, and the weight average mass approaches that of dimer, which elutes early. Also consistent with a monomer-dimer equilibrium is the asymmetric shape of the peaks of SecA shown in Figure 1 ▶. They have relatively sharp leading edges and long trailing edges, as would be expected because lower concentrations generate greater proportions of monomer and therefore slower movement through the column. The leading edge will be self-sharpening because it continues to be overtaken by higher concentrations and the trailing edge will trail more and more.
Fig. 1.

Size-exclusion chromatography of SecA at various concentrations. Two-hundred μL samples of pure SecA were subjected to size-exclusion chromatography at 8°C. The concentration of SecA in samples loaded on the column were 1, 2, 4, 8, 12, and 20 μM (expressed as monomer). The peak of absorbance at 280 nm eluted at ∼18.3 mL for the 1 μM sample. The peak eluted earlier as the sample concentration was increased. Absorbance at 280 nm was normalized to the maximum peak height of the individual runs for comparison.
Behavior characteristic of a self-associating oligomeric protein could also be shown using boundary sedimentation velocity centrifugation. Just as the movement of the protein population through the column depends on the average molar mass of the population, the movement of the boundary of protein away from the meniscus during centrifugation is a function of the average mass of the population. During centrifugation, the boundary not only sediments but also spreads because of diffusion. For analysis of the data, we used the method of van Holde and Weischet (1978) because it is the only analytical method that eliminates the effect of diffusional spreading. In this analysis, the sedimenting boundaries are divided into 50 equally spaced segments along the concentration axis (Fig. 2A ▶), and the apparent sedimentation coefficient, s*, for each segment is calculated. As one moves through the sedimenting boundary from the center of rotation to the bottom of the cell, the protein in the boundary fractions below the midpoint is that behind the boundary toward the meniscus, and protein in the upper boundary fractions lies on the side toward the bottom of the cell. The midpoint of the boundary is boundary fraction 0.5. As one can see from Figure 2B ▶, the protein in fractions below the midpoint sediments apparently slower, and that in fractions above the midpoint apparently faster, than does the protein at the midpoint. These apparent differences in s value are the effect of diffusion and do not reflect the true s values of the molecules in the population. Plots of s* as a function of the inverse of the square root of time allows extrapolation to infinite time, and because diffusion is proportional to the square root of time, whereas sedimentation is proportional to the time of centrifugation, the effect of diffusion is eliminated (Fig. 2B ▶). In the case of a pure protein, the extrapolated values converge on the y-axis and thus a plot of these extrapolated s values versus the fraction of the boundary gives a vertical distribution of s that is characteristic of the average molar mass of the sedimenting population. A detailed description of this analysis is given by Demeler et al. (1997). Figure 2C ▶ shows that as the concentration of SecA was increased from 1.6 μM to 6 μM, the s value increased. Further increases in concentration did not change the s value. Thus it can be concluded that the equilibrium constant is in the micromolar range. SecA could not be analyzed at concentrations below 1.6 μM because the absorbance was too low to give a reasonable signal above the level of noise.
Fig. 2.
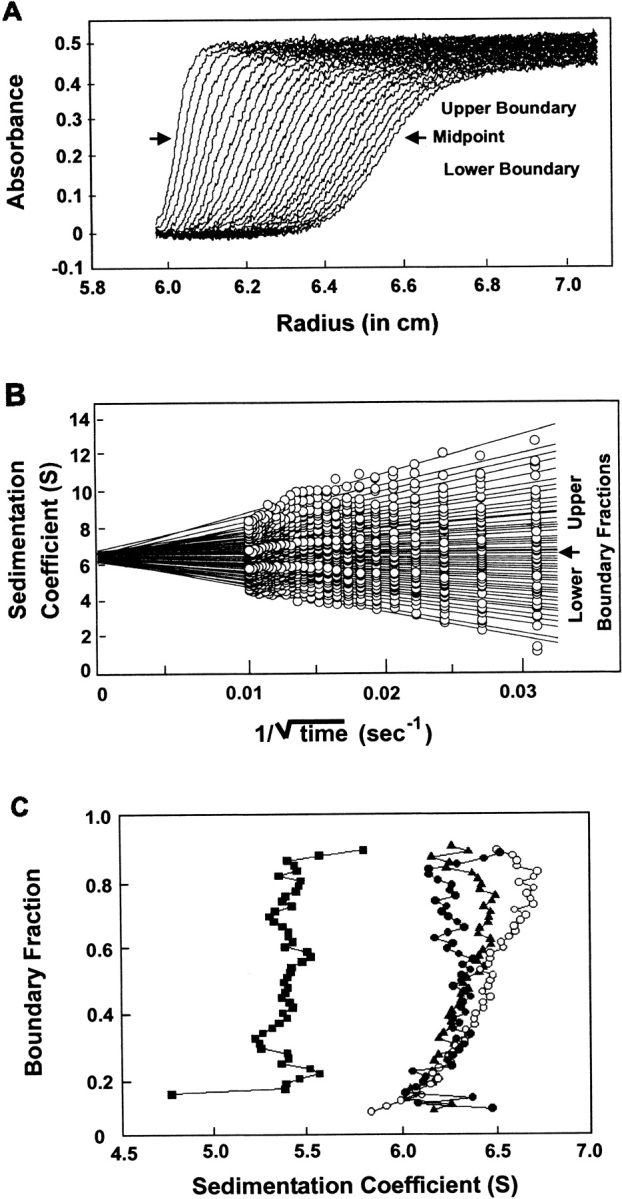
Sedimentation velocity centrifugation of SecA at 6°C. (A) The analytical ultracentrifuge cell contained 10 μM SecA monomer in 10 mM HEPES, 300 mM K+ acetate, 5 mM Mg+2 acetate, 1 mM TCEP, pH 7.5. Twenty-eight successive scans are shown. Scans 3–28 were subjected to analysis as shown in panel B. The middle 90% of the boundary was divided into 50 sections as described in the text. The midpoint of the boundary is indicated by the arrow. (B) The raw data shown in panel A were subjected to analysis by the method of Van Holde and Weischet (1978). Each point is the apparent sedimentation coefficient (s*) of each fraction of the boundary, and each vertical array of 50 points represents one boundary. Each line is the best fit through the points for a particular boundary fraction. The arrow indicates boundary fraction 0.5. (C) SecA was subjected to centrifugation, and the data were analyzed as described above. The intercepts of each line in the van Holde-Weischet analysis were plotted vs. the boundary fraction to which the line pertained. The concentrations of SecA monomer subjected to centrifugation were 1.6 μM (▪), 6 μM (•), 10 μM (▴), and 24 μM (○).
Chromatography performed at room temperature revealed that the situation is more complicated than a simple monomer-dimer equilibrium. Figure 3 ▶ shows that at room temperature, SecA eluted as two peaks in addition to a peak at 14.2 mL that had a molar mass determined to be between 200,000 and 210,000 (see later section for data), which is consistent with a dimeric species. The protein that eluted as a dimer was likely to have been oxidized and held together by covalent disulfide bonds. As expected, this species eluted at the same position irrespective of the concentration at which the sample was applied. In contrast, the two major peaks that are seen in all three chromatograms shown in Figure 3 ▶ both eluted later as the concentration of protein applied to the column decreased, indicating that each was undergoing dissociation during chromatography. This indicates that each peak represents a separate monomer-dimer equilibrium, and, in light of the difference from the chromatograms in Figure 1 ▶, that at least one of the equilibria is sensitive to temperature. At high concentration it is apparent that more than a single monomer-dimer equilibrium is present even at 8°C, as indicated by the shoulder in the trailing edge of the earliest eluting peak shown in Figure 1 ▶.
Fig. 3.

Size-exclusion chromatography of SecA at 24°C. Two-hundred μL samples of pure SecA were subjected to size-exclusion chromatography at 24°C. The concentrations of SecA monomer of the samples loaded on the column were 4 μM (dotted line), 8 μM (dashed line), and 12 μM (solid line). Absorbance at 280 nm was normalized to the maximum height of the SecA peak eluting earliest.
Size exclusion chromatography separates molecules based on their hydrodynamic radius, so earlier elution does not always mean an increase in molar mass. Conformational differences can be important. We were able to determine the molar mass of the SecA independent of the position of elution or calibration of the column by passing the eluant through a UV detector to provide a measure of concentration in series with a multiangle light scatter detector. The intensity of light scatter is proportional to the product of the concentration and the weight average molar mass of proteins in solution. Thus, the absolute molar mass of SecA was obtained throughout the entire eluant from the column from data acquired in intervals of 0.5 sec. Such analysis shows that when SecA was oxidized to form a covalent dimer, the molar mass was ∼200,000 as expected. SecA applied to the column at 8μM (monomer) at room temperature eluted with a molar mass of 160,000 at the leading edge of the peak compared with 125,000 when the chromatography was performed at 8°C (Fig. 4 ▶). This shows that at least one of the equilibrium constants is temperature dependent and an increase in temperature shifts the affected equilibrium toward dimer. Although analyses by velocity sedimentation centrifugation cannot distinguish a single equilibrium from multiple equilibria, it is clear by comparing the sedimentation of 3 μM SecA at 6°C with that at 20°C that increased temperature results in a faster sedimentary boundary, consistent with the population shifting toward dimer (Fig. 5 ▶).
Fig. 4.

Temperature dependence of SecA equilibrium reactions. SecA was applied at a concentration of 8 μM (monomer) and chromatography performed at 8°C and at 24°C. Oxidized SecA was applied at 5 μM (i.e., 2.5 μM dimer) and chromotographed at 8°C. Molar mass was determined as described in text. The lines represent relative absorbance at 280 nM. The symbols for molar mass are aligned with the peaks from which the values were derived as follows: Oxidized SecA (♦), SecA at 8°C (○), and SecA at 20°C (▪).
Fig. 5.

Sedimentation velocity centrifugation of SecA. Analyses were performed as described in the legend of Figure 2 ▶. SecA at 6 μM monomer was subjected to centrifugation at 6°C (♦) and at 20°C (•). Oxidized SecA, which is a covalent dimer, was centrifuged at 5 μM (expressed as monomer) at both 6°C (▪) and 20°C (▴). The backward curvature of the distribution at 20°C is indicative of non-ideal behavior, which might result from one of a number of causes including asymmetric shape of the particle or high charge density.
However, if the effect of temperature were simply to change the equilibrium constant, at the limit where the concentration is much greater than Keq, the s value would reach the same maximal value at both temperatures. This does not happen. At 6°C the maximal s value observed was between 6.3S and 6.5S (Fig 2C ▶, 10 μM, 24 μM) at concentrations so much higher than the estimated Keq (see later section for quantification) that the population should be greater than 80% dimer. At 20°C the binding is tighter, so that at the highest concentrations used (20 μM and 40 μM, data not shown) the population is probably at least 90% dimer; the s value was 7.5S to 7.7S. This difference in maximal sedimentation coefficients makes it likely that the two different reactions populate conformationally different dimers as the oligomeric form. It is also interesting to note that at both 6°C and 20°C the oxidized, covalent dimeric form of SecA has an s value of 9S, considerably higher than that of either equilibrium population (Fig 5 ▶). This may indicate yet another different mode of association of monomers or it may simply be that when a disulfide bond is formed, the extreme C-terminal regions (which contain the cysteine) are held in a compact conformation, resulting in a higher s value. None of these results can be accounted for by degradation of a subset of SecA. Analysis by SDS polyacrylamide gel electrophoresis of protein in the fractions across the entire eluant showed only one species of protein, and determination of the sequence of the first 7 amino acids of each analyzed here indicated that no more than 10% of the population was proteolytically clipped at the amino terminus (data not shown).
Estimation of apparent equilibrium constants
Because of the presence of multiple equilibria we could not rigorously determine equilibrium constants. However, we could estimate a weighted average apparent equilibrium constant by determining the weight average molar mass of the SecA as a function of concentration of the monomeric species present in the solution. To this end, we performed column chromatography on a series of SecA samples applied at increasingly greater concentration similar to those shown in Figure 1 ▶. Because of the complication of multiple equilibria, we worked at 8°C; at this temperature the two equilibrium reactions appear to have similar equilibrium constants, thereby simplifying this very complex situation. For each chromatogram, the molar mass determined was highest at the apex of the peak and fell off on the trailing side, indicating that equilibration was occurring relatively rapidly (Fig 6 ▶). Each chromatogram yielded one value for molar mass calculated from the light scatter data from the narrow region at the apex of the peak where the concentration was within 1% of the maximum. These values were plotted against the concentration, not of the sample applied, but of the protein in the same element of volume used for the mass calculation (Fig. 7 ▶). It is of interest to note that the dilution factor between the peak and sample applied was routinely between five- and tenfold.
Fig. 6.

Molar mass of SecA as it elutes from the size-exclusion column. A 200-μL sample of SecA, 12 μM monomer, was subjected to size-exclusion chromatography at 8°C. As the protein eluted from the column, absorbance at 280 nm was monitored (solid line) and the molar mass determined by light scatter (dots).
Fig. 7.

Estimation of apparent equilibrium constant. The weight average molar mass of the top 1% of the absorbance peak at 280 nm of SecA eluted from a size-exclusion column was determined as described. Circles represent wild-type SecA from three different protein preparations, and inverted triangles represent two preparations of SecAN880, a truncated form of SecA. Ideal curves are shown for a monomer-dimer equilibrium for which the monomer molar mass is 102 kD and the equilibrium constant expressed for the dissociation reaction is 0.5 μM (dotted line), 1.0 μM (solid line), 1.5 μM (dashed lined), and 2.0 μM (dotted-dashed line).
It is not reasonable to attempt a rigorous fit of the data given the complexity of the situation, but comparison of the data to the theoretical curves generated for equilibrium constants of dissociation ranging from 0.5 μM to 2 μM allows us to conclude that at 8°C the equilibrium is characterized by dissociation in the micromolar range. The data from three completely separate purifications of wild-type SecA and two preparations of the truncated form SecAN880 are consistent with similar equilibrium constants for the two forms at this level of approximation. SecA is a metalloprotein that contains one zinc per monomer (Fekkes et al.1999). The zinc does not play a significant role in the equilibria studied here because SecAN880 is lacking the C-terminal region that binds zinc. Analysis for zinc confirmed that preparations of SecAN880 contained no zinc, whereas the three preparations of wild-type SecA had zinc present at ratios of between 0.7 and 0.9 Zn2+ per monomer. When SecA was oxidized, no zinc was present, as would be expected because the cysteine residues normally involved in zinc binding form disulfide bonds.
The buffer conditions used for the determination of the equilibrium constant were chosen to mimic intracellular conditions. The solutions were buffered at pH 7.5 and 5 mM Mg2+ acetate was included because SecA is an ATPase. We used 300 mM K+ acetate as the salt in our studies because the cytosol of Escherichia coli contains high concentrations of K+. The thermodynamic activity of K+ was determined by Cayley et al. (1991) to vary between 0.14 M and 0.76 M depending on the osmolarity of the growth medium, whereas intracellular concentrations of Na+ (Rhoads et al. 1976; Castle et al. 1986) and NH4+ (Lubin and Ennis 1964) are low (<10 mM). Column chromatography performed in buffer containing different concentrations of K+ acetate showed that the equilibrium reactions SecA undergoes are sensitive to ionic strength. As the concentration of salt was decreased from 300 mM, the population of SecA shifted toward dimer. At 200 mM K+ acetate, when SecA was applied to the column at concentrations in the range required to shift the population toward monomer, the intensity of light scatter was too low to accurately determine the molar mass. Our best estimate of the approximate equilibrium constant at 200 mM K+ acetate at 8°C was 0.1 μM, based on several determinations of a mass of ∼140 kD when the protein in the peak was 0.1 μM (the weight average molar mass when half of the SecA is a dimeric form is 136 kD).
Discussion
The data presented here indicate that at micromolar concentrations, SecA exists in an equilibrium mixture of monomers and dimers. Not only does the position of elution of the protein during gel filtration chromatography become later and the average molar mass of the population become lower as the concentration applied to the column decreases, but the sedimentation coefficient also decreases with decreasing concentration. Such behavior is characteristic of a self-associating protein that is undergoing equilibrium reactions in solution. It is clear that the equilibrium mixture cannot be described by a single monomer-dimer reaction. Size exclusion chromatography at 20°C shows that soluble SecA contains at least two dissociating species. It is possible that these species are related to the different forms of SecA that have been identified previously (Ramamurthy and Oliver 1997; Chen et al. 1998) . Tai and his colleagues (Chen et al. 1998) used proteolysis to identify two different forms of SecA—one is found only associated with membrane and the other is both free in solution and membrane bound.
Ramamurthy and Oliver (1997) used a sulfhydryl-labeling reagent to show differences between soluble and membrane-bound SecA. The solution form identified by these groups might be a mixture of the equilibrating species described here and the membrane-bound form could represent the stabilization of one of the species present in solution. The two equilibrium reactions that we detect by column chromatography probably populate conformationally different dimeric states. The sedimentation velocity centrifugation studies provide support for different conformations. At high concentrations of SecA where the population was driven far toward dimer and the maximum velocity of sedimentation had been reached, that maximal value was different at 6°C and 20°C, indicating differences in shape. The species favored at 20°C has a higher s value consistent with a more compact state than that present at 6°C. It may be that SecA can form dimers by interaction at two different faces, such as front-to-front and back-to-back dimers. Alternatively, the dimeric interface might be the same with one form parallel and the other antiparallel. Another possibility is that the interface is the same but the C-terminal region might be extended in one form and compact in the other.
Because of the complication of the presence of at least two equilibrium reactions, we were only able to make estimates of apparent equilibrium constants. At 8°C with K+ acetate at 300 mM, both are in the micromolar range. At 20°C one of the equilibria is shifted more toward dimer than is the other, resulting in the resolution of two peaks during chromatography. Because two peaks resolve, the two equilibria are either not reversibly connected, as might be the case if there were two forms of SecA differing by covalent modification, or the equilibria might be connected by a very slow interconversion between two conformational states. Our best estimates of the equilibrium constant of dissociation for the reaction that becomes tighter at 20°C is between 0.25 μM and 0.5 μM. The tightening of the interactions at the interface with increased temperature indicates the involvement of hydrophobic interactions. The equilibria are sensitive not only to temperature but also to salt concentrations, indicating that electrostatic interactions must play a role. Association of the dimer was strengthened by decreasing the concentration of salt in the buffer. The decrease of K+ concentration from 300 mM to 200 mM resulted in a decrease in the equilibrium constant from micromolar to 0.1 μM, which corresponds to an increase of ∼15% in the binding energy. The equilibrium constant for SecA of <0.6 μM reported by Doyle et al. (2000) is consistent with our results. Their equilibrium centrifugation analysis was performed at 20°C and with very low salt concentration, conditions that we have shown drive the reaction toward dimer.
In vivo, the concentration of SecA is well above the equilibrium constant reported here, and because the effective concentration will be higher by a factor of 10 to 100 owing to excluded volume effects (Ross and Minton 1977; Cayley et al. 1991), it is clear that the majority of the population of SecA in the cell will be dimeric. However, it should be remembered that for a self-associating protein present at 10-fold above its equilibrium constant, only 80% of the mass is in the form of dimer. Considered in terms of molarity, this means that for every 4 μM dimer there would be a 2 μM monomer present. At 100-fold more than the equilibrium constant, 93% of the mass is dimer, or, in other words, there would be 4.65 μM dimer present for every 0.7 μM monomer. It is possible that in vivo the monomeric form plays a role in one of the many different interactions involving SecA.
The presence of a monomer-dimer equilibrium in solution will definitely affect the interpretation of a large number of studies performed in vitro. In many studies, soluble SecA has been used at low concentrations and at low temperature with the assumption that it remains a stable dimer. Under conditions in which the concentration of SecA is near its equilibrium constant, or the equilibrium constant of dissociation for SecA is near the Kd of a binding interaction under study, interpretation of data is complicated by the coupling of the dissociation reaction of SecA itself to the binding of other components. An experimentally determined Kd will necessarily incorporate the effects of the competing equilibria.
The population of SecA characterized here was purified from the soluble fraction of E. coli. It will be of interest to determine if the SecA that is purified from the membrane undergoes the same equilibrium reactions or will represent even another form. In any case, it is prudent to keep in mind the effects of temperature and buffer conditions on the oligomeric state of SecA.
Materials and methods
SecA purification
SecA was purified either from strain RR1/pMAN400 (Kawasaki et al. 1989) or Cy15077/pMAN400 (Ross et al. 1997), as described (Woodbury et al. 2000). The plasmid pMAN400 contains the secA gene under the control of the tac promoter and lac operator (Kawasaki et al. 1989). Cells were grown as described (Woodbury et al. 2000) at 35°C in M9 minimal salts medium supplemented with 0.4% glucose, 4μg/mL thiamine, 1% casamino acids, 100 μg/mL ampicillin, and 0.25 mM Trp in the case of CY15077, which is a tryptophan auxotroph. Because SecA contains zinc, ZnS04 was included in two of the three growths at either 0.1 or 0.2 mM. All preparations of SecA gave the same results irrespective of strain, growth medium, and method of purification. SecAN880, a truncated SecA consisting of the first 880 of 901 amino-acyl residues, was purified twice from strain JM109 harboring plasmid pAL81, once as described (Woodbury et al. 2000) and once using Blue Sepharose to replace the DEAE column. Disulfide-linked dimeric SecA was generated by incubation of purified SecA with the oxidative catalyst Cu2+ phenanthroline (Lee et al. 1994) followed by size exclusion chromatography to separate the dimer from the equilibrating mixture.
The zinc content of purified SecA was determined using a spectroscopic assay for zinc as described (Zhou et al. 1999). The purified proteins were each analyzed to determine the sequence of the first 7 amino-acyl residues using an Applied Biosystems 475A sequencing system with pulsed liquid update.
Size exclusion column chromatography and molar mass determination
High performance liquid size exclusion chromatography was performed on a TSK G3000SW column (7.5 mm internal diameter × 60 cm) in 10 mM HEPES-KOH, 300 mM KOAc, 5 mM Mg(OAc)2, 1 mM TCEP, pH 7.5. We were able to determine the absolute molar mass directly, independent of position of elution, of proteins chromatographed on size exclusion columns by monitoring the eluant using a multiangle laser light scatter detector, a differential refractometer (DAWN-EOS and Optilab, respectively; Wyatt Technology Corporation), and a UV detector. The molar mass was determined using a specific refractive index increment of 0.182 mL/gm, an extinction coefficient of 0.77 mL/mg cm, and the Debye plotting formalism of the Astra software supplied by Wyatt Technology Corporation. The relationship between the excess Rayleigh ratio, R(θ), which is the light scattered by the solution at angle θ in excess of that scattered by the pure solvent divided by the incident light intensity, and the weight average molar mass (Mw) is given by:
Where c is the concentration of the protein, A2 is the second viral coefficient and P(θ) is the form factor that describes the angular dependence of the scatter. K* is equal to 4π2 n02 (dn/dc) 2/[λ04 NA] where n0 is the refractive index of the solvent, dn/dc is the specific refractive index increment of the protein, NA is Avogadro's number, and λ is the vacuum wavelength of the incident light. Because the protein concentrations used in this study are low the equation is simplified to
Analysis of solutions by multiangle static light scatter yields the weight average molecular mass of the macromolecular solutes present. SecA, the protein studied here, is a dimer.
Assuming a simple monomer-dimer equilibrium, the equilibrium constant, K, can be related to the weight average molar mass, M, and the total concentration, C0, expressed in terms of monomer ([A]+2[A2]) by the equation:
(n is the molar mass of monomer, 102,000 Da for SecA)
Because we can measure C0 and M for any solution, we can obtain values of K. Conversely, we can predict values of M for any given K and C0 as shown in Figure 4 ▶. However, it should be noted that for measured values of M near the limits, for SecA 102,000 or 204,000, slight errors in the value will lead to large errors in K. Thus, one obtains the most robust estimates of K in the middle of the range. This analysis can only be applied rigorously if the mixture is at equilibrium. For Figure 7 ▶, the values used to calculate molar mass were taken from a narrow vertical section of the eluted peak: from the point on the leading edge where the concentration is 99% of the maximum to the equal point on the trailing edge. This is where the concentration is most constant, both with respect to time and volume. Although it is likely that the protein in this small element of volume has not reached true equilibrium, the fact that the molar mass does change across the peak of SecA indicates that equilibration is rapid relative to the dilution during chromatography.
Analytical ultracentrifugation
Solutions of SecA at indicated concentrations in 10mM HEPES-KOH, 300 mM KOAc, 5 mM Mg(OAc)2, 1 mM TCEP, pH 7.5 were subjected to centrifugation using the XL-A ultracentrifuge (Beckman Instruments). Samples were loaded into cells with two-sector centerpieces in the An-60 Ti rotor, equilibrated to the temperature indicated and centrifuged at 50,000 rpm for up to 4 h. Radial scans to measure the absorbance profile of the column of liquid in each of the three cells in a rotor were taken at 4-min intervals and the sedimentation coefficient of each sedimenting boundary was determined by the method of van Holde and Weischet (1978) using the Ultrascan Data Analysis Program version 4.1 from Borries Demeler (University of Texas Science Center, San Antonio, Texas). A minimum of 25 radial scans of each cell was subjected to this analysis. The values used for the density and viscosity of the buffer relative to water were 1.014 and 1.063, and the s values reported are all corrected to water at 20°C.
Acknowledgments
We thank Traci B. Topping for purified SecA and Gerhard Munske for determination of the amino acid sequence of the N-termini of the purified proteins. This work was supported in part by research grant GM29798 to LLR and a Biotechnology Training Grant T32 GM08336 from the National Institute of General Medicine. Portions of this work were submitted in partial fulfillment of the requirements of a Ph.D. in Genetics and Cell Biology at Washington State University by R.L.W.
The publication costs of this article were defrayed in part by payment of page charges. This article must therefore be hereby marked "advertisement" in accordance with 18 USC section 1734 solely to indicate this fact.
Article and publication are at http://www.proteinscience.org/cgi/doi/10.1110/ps.4090102.
References
- Akita, M., Shinkai, A., Matsuyama, S., and Mizushima, S. 1991. SecA, an essential component of the secretory machinery of Escherichia coli, exists as homodimer. Biochem. Biophys. Res. Commun. 174 211–216. [DOI] [PubMed] [Google Scholar]
- Cabelli, R.J., Dolan, K.M., Qian, L.P., and Oliver, D.B. 1991. Characterization of membrane-associated and soluble states of SecA protein from wild-type and SecA51(TS) mutant strains of Escherichia coli. J. Biol. Chem. 266 24420–24427. [PubMed] [Google Scholar]
- Castle, A.M., Macnab, R.M., and Shulman, R.G. 1986. Coupling between the sodium and proton gradients in respiring Escherichia coli cells measured by 23Na and 31P nuclear magnetic resonance. J. Biol. Chem. 261 7797–7806. [PubMed] [Google Scholar]
- Cayley, S., Lewis, B.A., Guttman, H.J., and Record, M.T., Jr. 1991. Characterization of the cytoplasm of Escherichia coli K-12 as a function of external osmolarity. Implications for protein-DNA interactions in vivo. J. Mol. Biol. 222 281–300. [DOI] [PubMed] [Google Scholar]
- Chen, X., Brown, T., and Tai, P.C. 1998. Identification and characterization of protease-resistant SecA fragments: secA has two membrane-integral forms. J. Bacteriol. 180 527–537. [DOI] [PMC free article] [PubMed] [Google Scholar]
- Demeler, B., Saber, H., and Hansen, J.C. 1997. Identification and interpretation of complexity in sedimentation velocity boundaries. Biophys. J. 72 397–407. [DOI] [PMC free article] [PubMed] [Google Scholar]
- Doyle, S.M., Braswell, E.H., and Teschke, C.M. 2000. SecA folds via a dimeric intermediate. Biochemistry 39 11667–11676. [DOI] [PubMed] [Google Scholar]
- Driessen, A.J. 1993. SecA, the peripheral subunit of the Escherichia coli precursor protein translocase, is functional as a dimer. Biochemistry 32 13190–13197. [DOI] [PubMed] [Google Scholar]
- Fekkes, P., de Wit, J.G., Boorsma, A., Friesen, R.H., and Driessen, A.J. 1999. Zinc stabilizes the SecB binding site of SecA. Biochemistry 38 5111–5116. [DOI] [PubMed] [Google Scholar]
- Fekkes, P. and Driessen, A.J. 1999. Protein targeting to the bacterial cytoplasmic membrane. Microbiol. Mol. Biol. Rev. 63 161–173. [DOI] [PMC free article] [PubMed] [Google Scholar]
- Kawasaki, H., Matsuyama, S., Sasaki, S., Akita, M., and Mizushima, S. 1989. SecA protein is directly involved in protein secretion in Escherichia coli. FEBS Lett 242 431–434. [DOI] [PubMed] [Google Scholar]
- Lee, G.F., Burrows, G.G., Lebert, M.R., Dutton, D.P., and Hazelbauer, G.L. 1994. Deducing the organization of a transmembrane domain by disulfide cross-linking. The bacterial chemoreceptor Trg. J. Biol. Chem. 269 29920–29927. [PubMed] [Google Scholar]
- Lubin, M. and Ennis, H.L. 1964. On the role of intramolecular potassium in protein synthesis. Biochim. Biophys. Acta. 80 614–631. [DOI] [PubMed] [Google Scholar]
- Qi, H.Y. and Bernstein, H.D. 1999. SecA is required for the insertion of inner membrane proteins targeted by the Escherichia coli signal recognition particle. J. Biol. Chem. 274 8993–8997. [DOI] [PubMed] [Google Scholar]
- Ramamurthy, V. and Oliver, D. 1997. Topology of the integral membrane form of Escherichia coli SecA protein reveals multiple periplasmically exposed regions and modulation by ATP binding. J. Biol. Chem. 272 23239–23246. [DOI] [PubMed] [Google Scholar]
- Rhoads, D.B., Waters, F.B., and Epstein, W. 1976. Cation transport in Escherichia coli. Potassium transport mutants. J. Gen. Physiol. 67 325–341. [DOI] [PMC free article] [PubMed] [Google Scholar]
- Ross, J.B., Szabo, A.G., and Hogue, C.W. 1997. Enhancement of protein spectra with tryptophan analogs: Fluorescence spectroscopy of protein–protein and protein–nucleic acid interactions. Methods Enzymol. 278 151–190. [DOI] [PubMed] [Google Scholar]
- Ross, P.D. and Minton, A.P. 1977. Analysis of non-ideal behavior in concentrated hemoglobin solutions. J. Mol. Biol. 112 437–452. [DOI] [PubMed] [Google Scholar]
- Tian, H., Boyd, D., and Beckwith, J. 2000. A mutant hunt for defects in membrane protein assembly yields mutations affecting the bacterial signal recognition particle and Sec machinery. Proc. Natl. Acad. Sci. 97 4730–4735. [DOI] [PMC free article] [PubMed] [Google Scholar]
- van Holde, K.E. and Weischet, W.O. 1978. Boundary analysis of sedimentation velocity experiments with monodisperse and paucidisperse solutes. Biopolymers 17 1387–1403. [Google Scholar]
- Woodbury, R.L., Topping, T.B., Diamond, D.L., Suciu, D., Kumamoto, C.A., Hardy, S.J.S., and Randall, L.L. 2000. Complexes between protein export chaperone SecB and SecA. Evidence for separate sites on SecA providing binding energy and regulatory interactions. J. Biol. Chem. 275 24191–24198. [DOI] [PubMed] [Google Scholar]
- Zhou, Z.S., Peariso, K., Penner-Hahn, J.E., and Matthews, R.G. 1999. Identification of the zinc ligands in cobalamin-independent methionine synthase (MetE) from Escherichia coli. Biochemistry 38 15915–15926. [DOI] [PubMed] [Google Scholar]