Analysis of Bacterial Community Composition by Oligonucleotide Fingerprinting of rRNA Genes (original) (raw)
Abstract
One of the first steps in characterizing an ecosystem is to describe the organisms inhabiting it. For microbial studies, experimental limitations have hindered the ability to depict diverse communities. Here we describe oligonucleotide fingerprinting of rRNA genes (OFRG), a method that permits identification of arrayed rRNA genes (rDNA) through a series of hybridization experiments using small DNA probes. To demonstrate this strategy, we examined the bacteria inhabiting two different soils. Analysis of 1,536 rDNA clones revealed 766 clusters grouped into five major taxa: Bacillus, Actinobacteria, Proteobacteria, and two undefined assemblages. Soil-specific taxa were identified and then independently confirmed through cluster-specific PCR of the original soil DNA. Near-species-level resolution was obtained by this analysis as clones with average sequence identities of 97% were grouped in the same cluster. A comparison of these OFRG results with the results obtained in a denaturing gradient gel electrophoresis analysis of the same two soils demonstrated the significance of this methodological advance. OFRG provides a cost-effective means to extensively analyze microbial communities and should have applications in medicine, biotechnology, and ecosystem studies.
How diverse are microbial communities? Does microbial diversity lead to ecosystem stability? What are the relationships between microbial community composition and ecosystem function? These questions, as well as many others, remain unresolved because of limitations of current experimental capabilities, including the difficulty of simply describing the organisms inhabiting an environment. Traditionally, microorganisms have been classified by characterizing their morphological and physiological traits in pure culture. However, such traits do not provide a meaningful framework for evolutionary classifications. Moreover, this approach is limited by its reliance on pure-culture techniques, which detect only a fraction of extant microorganisms (1). In the 1970s, Woese and colleagues described the use of comparative rRNA analysis for phylogenetic studies (13, 24, 31, 32). This work not only provided an evolutionary basis for prokaryotic taxonomy but also led to the three-domain organization of the living world (Archaea, Bacteria, and Eucarya) (31, 33). The subsequent development of strategies to analyze rRNA molecules and rRNA genes (rDNA) obtained from the environment provided a culture-independent means to examine the immense diversity of microorganisms inhabiting the natural world (3, 14, 21, 29).
Numerous rDNA-based strategies have been developed for microbial community analysis. Currently, most investigators analyze rDNA with methods such as denaturing gradient gel electrophoresis (DGGE) (20), terminal random fragment length polymorphism analysis (19), and ribosomal intergenic spacer analysis (5). Although these methods permit rapid analysis of numerous samples, they generate only superficial descriptions of microbial community composition. Thorough depictions of community composition can be obtained by extensive sequence analysis of rDNA clone libraries, yet this approach is not commonly used because of the high costs associated with examining diverse communities. The recent development of array-based methods, which permit thousands of hybridization events to be examined in parallel, has brought great promise to the field of microbial ecology. In this approach, labeled rRNA or rDNA from environmental samples are analyzed by hybridization to oligonucleotide probes attached to a substrate. While some successes have been reported (4, 15, 22, 23, 28), none of the methods described in previous studies demonstrated the potential to facilitate thorough depictions of microbial community composition. The most significant unresolved obstacle at this juncture appears to be probe design. For this approach to work, each oligonucleotide probe must hybridize to a specific rDNA sequence or group of sequences. However, the development of probes remains a significant challenge because of the highly conserved nature of rDNA and the extensive diversity of microbial life. An additional problem is designing probes for the multitude of microorganisms that have yet to be described.
In this report, we describe oligonucleotide fingerprinting of rRNA genes (OFRG), an alternative array-based approach in which the rDNA, not the oligonucleotide probes, are attached to a solid substrate. OFRG is an adaptation of a method used for gene expression profiling (9, 10, 18). Briefly, clone libraries are constructed from rDNA molecules that have been PCR amplified from environmental DNA (Fig. 1). The rDNA clones are then arrayed on nylon membranes and subjected to a series of hybridization experiments, each using a single DNA probe 10 nucleotides long. For every probe, the signal intensities are transformed into three discrete values, 0, 1, and N, where 0 and 1 indicate negative and positive hybridization events, respectively, and N indicates an uncertain assignment. This process creates a hybridization fingerprint for each clone, which is a vector of values resulting from hybridizations with all probes. The clones are identified by clustering their hybridization fingerprints with those of known sequences, as well as by nucleotide sequence analyses of representative clones within a cluster.
FIG. 1.

Diagram of OFRG strategy.
MATERIALS AND METHODS
Soil collection and DNA extraction.
Soil (the top 10 cm) was collected from two adjacent agriculture fields at the Agriculture Research Station at the University of California, Riverside. Five replicate samples were collected from each site. The samples were dried by overnight incubation at 30°C and then stored at −70°C. DNA was extracted from each soil sample (0.5 g) with a FastDNA spin kit for soil (Bio 101, Vista, Calif.) (7). DNA from the five replicate samples were pooled for analysis of bacterial composition as described below.
rDNA library construction.
Bacterial small-subunit rDNA were PCR amplified from soil DNA in 10-μl glass capillary tubes by using a 1002 RapidCycler (Idaho Technologies, Idaho Falls, Idaho). The 100-μl reaction mixtures contained 50 mM Tris (pH 8.3), 500 μg of bovine serum albumin per ml, 2.5 mM MgCl2, each deoxynucleoside triphosphate at a concentration of 250 μM, each bacterial small-subunit rDNA primer (27F [GAGCTCAGAGTTTGATCMTGGCTCAG] and 1492R [CACGYTACCTTGTTACGACTT]) at a concentration of 400 nM (17), 5 U of Taq DNA polymerase, and 10 μl of soil DNA composed of equal volumes of DNA from each of the replicate soil samples. The cycling parameters were 94°C for 2 min; 35 cycles of 94°C for 5 s, 48°C for 20 s, and 72°C for 40 s; and then 72°C for 2 min. PCR products were gel isolated and purified with a QIAquick PCR purification kit (Qiagen, Chatsworth, Calif.), ligated into pGEM-T (Promega), transformed into competent Escherichia coli JM109 (Promega), and plated on Luria-Bertani (LB) agar plates containing 100 μg of ampicillin per ml that were surface spread with 5-bromo-4-chloro-3-indolyl-β-d-galactopyranoside (X-Gal) and isopropyl-β-d-thiogalactopyranoside (IPTG). For each soil treatment, 768 white colonies were randomly picked into 384-well culture plates. Most wells contained 30 μl of LB medium supplemented with 100 μg of ampicillin per ml; the exceptions were the perimeter wells, which were filled with 60 μl to prevent drying. For array construction (see below), these plates were shaken (300 rpm) overnight at 37°C in an open plastic bag (closed end of bag faces incubator fan) to limit evaporation. For long-term storage, the bacteria were grown overnight at 37°C without shaking in an open plastic bag, with each well containing 30 μl of LB broth supplemented with 100 μg of ampicillin per ml; the next day, the plates were stored at −70°C after 30 μl of LB medium containing 30% glycerol was added.
Array construction.
The arrays were constructed by spotting PCR-amplified rDNA onto nylon membranes. The 35-μl PCR mixtures contained 50 mM Tris (pH 8.3), 500 μg of bovine serum albumin per ml, 2.5 mM MgCl2, each deoxynucleoside triphosphate at a concentration of 250 μM, each primer (T725 [GGCCCGACGTCGCATGCTC] and SP650 [TGGTCGACCTGCAGGCGGC], which anneal to regions of the multiple cloning site within the vector) at a concentration of 400 nM, and 1.75 U of Taq DNA polymerase. (Note that rDNA-specific primers were not used here because they would have also amplified E. coli rDNA from the host cell.) The reagents were added to 384-well PCR plates (Marsh Bio Products, Rochester, N.Y.). Portions (0.1 μl) of freshly grown overnight cultures of the rDNA clones (described above) were added to the PCR reagents by using a 384-pin solid pin replicator (V & P Scientific, Inc., San Diego, Calif.). The plates were sealed with Thermo-Seal (Marsh Bio Products) by using a preheated Thermo-Sealer (ABgene, Epsom, United Kingdom) for 4 s. The PCR was then performed by alternately submerging the PCR plates in two water baths. The cycling parameters were 94°C for 10 min; 35 cycles of 94°C for 1 min and 72°C for 2 min; and then 72°C for 5 min. The PCR products were spotted onto dry Hybond N+ membranes (11 by 8 cm; Amersham Pharmacia Biotech) with a surfactant-coated 0.5-μl slot pin replicator and a Multi-Print replication registration device (V & P Scientific). One microliter of each PCR product was delivered to the membrane by two sequential spotting applications. The Multi-Print device allows the contents of four different 384-well plates to be printed onto a single 11- by 8-cm membrane, resulting in an array of 1,536 clones.
Array hybridization.
The membranes were fixed by UV cross-linking (70 mJ). Immediately before hybridization, the membranes were denatured with 0.5 N NaOH-1.5 M NaCl (twice for 5 min on absorbent paper), neutralized with 50 mM Na phosphate (pH 7.2) (three times for 3 min on absorbent paper), covered with boiling 0.1% sodium dodecyl sulfate, allowed to cool for 15 min, and then dried for 30 min. DNA oligonucleotides were end labeled with T4 polynucleotide kinase (T4 PNK) (New England Biolabs); the 4-μl reaction mixtures contained 1 μM oligonucleotide, 6 μCi of [γ-33P]ATP, 0.4 μl of 10× T4 PNK buffer, and 2.6 U of T4 PNK and were incubated at 37°C for 30 min. Hybridization solution (1.8 ml of 5% sarcosyl-0.2 M Na phosphate [pH 7.2] containing 1 nM DNA oligonucleotide probe end labeled with 33P) was applied to the membranes, which were covered with plastic sheeting (thickness, 102 μm), and incubated overnight at 12°C (11). The arrays were washed twice in 0.1× to 4× SSC (1× SSC is 0.15 M NaCl plus 0.015 M sodium citrate) for 5 to 30 min at 12°C (12); the wash conditions were determined empirically for each probe. After washing, membranes were briefly placed on absorbent paper to remove any excess fluids and then enclosed with plastic wrap to prevent drying. The membranes were exposed to an Imaging Screen (Bio-Rad) for 16 h and then scanned with a Personal Molecular Imager FX (Bio-Rad). Signal intensities with background correction were obtained by using ImaGene 4.0 software (Biodiscovery). Membranes were reused up to five times. To remove the probe between experiments, the membranes were covered with boiling stripping buffer (1× SSC, 0.1% sodium dodecyl sulfate, 200 mM Tris; pH 7.5), allowed to cool for 15 min, and then dried for 30 min.
Oligonucleotide probes.
The following discriminating oligonucleotide probes were used: probe 1, GTTGGGTTAA; probe 2, GTAACCTGCC; probe 3, GAAAGCCTGA; probe 4, AATTCGATGC; probe 5, TTCGGATTGT; probe 6, CGAAAGCGTG; probe 7, CGGCCCAGAC; probe 8, TTGATCCTGG; probe 9, CACATGCAAG; probe 10, GGTAATGGCC; probe 11, GGGCGCAAGC; probe 12, TGAAATGCGT; probe 13, ATTCGATGCA; probe 14, GCAAGCCTGA; probe 15, TCAGTTCGGA; probe 16, GAGGATGGCC; probe 17, GGGTAAAGGC; probe 18, CACCATGGGA; probe 19, AGCTAACGCG; probe 20, GTTGGTGAGG; probe 21, GTGAAAGCCC; probe 22, GTAAACGATG; probe 23, ATGGCCCTTA; probe 24, GAACGGGTGA; probe 25, ACACCATGGG; probe 26, GAAGCTAACG; and probe 27, AAGTGGGGGA. The reference probe (probe 28) was GCTGCTGGCA. These probes were designed by using a previously described simulated annealing algorithm (6). Simulated annealing is a popular heuristic method for efficiently solving difficult optimization problems (16). Our goal was to design a probe set that could discriminate 1,158 bacterial small-subunit rDNA obtained from GenBank. However, since some of the theoretical probes did not hybridize in a consistent and predictable manner in the actual experiments, the probes used in this study were a collection of oligonucleotides which originated from several different sets but which produced strong signal intensities and hybridized to the control clones in the expected manner. Even though this probe set was generated through suboptimal means, it was still able to produce near-species-level resolution (see below). Future refinements of the probe selection algorithm, which result in replacement of ineffective probes, should increase the resolution of this approach.
Data analysis.
The signal intensities from the hybridization experiments were normalized by dividing the values obtained with the discriminating probes by the values obtained with the reference probe, probe 28, which is expected to hybridize to all rDNA clones and is derived from a universal rDNA sequence (530F [GTGCCAGCMGCCGCGG]) (17). The normalized values were then classified as 0, 1, or N by using the intensity values of control clones. For this experiment, 1,536 clones were arrayed; 26 of these clones had defined nucleotide sequences and served as controls for each hybridization experiment. For a given probe, clones with intensity values less than or equal to x were given a 0 classification, where x is the highest intensity value generated by control clones expected to not hybridize with the probe. Clones with intensity values greater than or equal to y were given a 1 classification, where y is the lowest value generated by control clones expected to hybridize to the probe. All other clones were given an N classification. This process created a hybridization fingerprint for each clone, which is a vector of values resulting from its hybridizations with all probes. The fingerprints were clustered by using the unweighted pair group method with arithmetic mean (UPGMA), default parameters, and PAUP 4.0 beta 8. Each cluster was defined as a group of clones with the same fingerprint (with Ns consistently resolved).
Sequence analysis.
Nucleotide sequences of the rDNA clones were obtained with a ABI PRISM BigDye terminator v3.0 cycle sequencing kit at the DNA lab of Arizona State University. Plasmid DNA was extracted with a QIAprep spin miniprep kit (Qiagen). The sequencing primers used were T725 and SP650 (see above), as well as 907R (CCGTCAATTCMTTTRAGTTT) and 1392R (ACGGGCGGTGTGTRC) (17). rDNA sequences were assembled by using ContigExpress (Vector NTI). Sequence identities were determined by using BLAST (National Center for Biotechnology Information) and Align X (Vector NTI).
Cluster-specific PCR.
The following specific PCR primers were designed by using sequences conserved within selected clusters (see Fig. 3 for cluster designations): for cluster 1, forward primer TGTTAGGGAAGAACAAGTACC and reverse primer TTGCAGCCCTTTGTACCA; for cluster 2, forward primer ATGGTGACAGTTGTTAAAGC and reverse primer TTTCACAACTGACTTGCG; for cluster 3, forward primer AATCTGCCCTTCACTCT and reverse primer CCATCTCTGATGCTTTC; for cluster 4, forward primer GCAAGTCGAACGAGGTGCTT and reverse primer CACGTAGTTAGCCGAGA; for cluster 5, forward primer GAACGGTAACAGGAAGCA and reverse primer GCACATCCGATGGCAA; for cluster 6, forward primer GGAACGTGTCCTCTTGT and reverse primer GCGTTACTAAGGGATTTAACT; for cluster 7, forward primer TCTTTTACCCGGGATGATA and reverse primer TTACAAAGCCGCCTACG; and for cluster 8, forward primer AGCTAACGCATTAAACATTC and reverse primer CTGAGATGGCTTTTGGA. Ten-microliter PCR were performed with 9C and 9E soil DNA (0.2 μl) by using the protocol described above for rDNA library construction. The annealing temperature was determined empirically for each primer set (cluster 1, 68°C; cluster 2, 60°C; cluster 3, 62°C; cluster 4, 65°C; cluster 5, 60°C; cluster 6, 62°C; cluster 7, 62°C; cluster 8, 60°C). The PCR products were resolved on 1% agarose gels, stained with ethidium bromide, and photographed under UV illumination.
FIG. 3.


Taxonomic depiction of soil bacteria produced by OFRG. The UPGMA tree was constructed from rDNA hybridization fingerprints derived from two soils. (A) Complete UPGMA tree. The numbers indicate cluster designations. (B) Detailed depiction of the Bacillus clade. This tree is composed of three segments; the asterisks and solid circles indicate connection sites. The full-length tree can be obtained from the corresponding author. rDNA clones are designated by a number followed by a space and then either 1 or 2; 1 indicates that the clone was from soil 9C, and 2 indicates that the clone was from soil 9E. Clones whose nucleotide sequences were determined are indicated by the suffix S; identities with GenBank sequences are indicated. Cluster 1 is indicated.
Richness and diversity estimates.
UPGMA trees were constructed for each soil as described above. Clusters were used to represent species. The number of clones within a cluster represented abundance. From these trees, estimates of species richness and diversity were determined by Chao1 and Shannon analyses (R. K. Colwell, EstimateS: statistical estimation of species richness and shared species from samples, version 5, 1997; user's guide and application published at http://viceroy.eeb.uconn.edu/estimates). Diversity was also estimated by adding the branch lengths from the trees.
DGGE.
DGGE was performed as previously described (34).
Nucleotide sequence data.
The nucleotide sequences of the following rDNA clones reported in this paper, sorted by cluster (see Fig. 3A), have been deposited in the GenBank database: cluster 1 clones 335-1 (accession number AF423249), 432-1 (AF4232630), 911-1 (AF423299), 1104-1 (AF423209), and 1200-1 (AF4232140; cluster 2 clones 375-2 (AF4232540) and 456-2 (AF4232670); cluster 3 clones 41-1 (AF423260) and 228-1 (AF423240); cluster 4 clones 572-2 (AF423278), 573-2 (AF423305), 666-2 (AF423285), 746-2 (AF4232900), and 838-2 (AF423295); cluster 5 clones 336-1 (AF4232500), 431-1 (AF423262), 624-1 (AF423283), and 1389-1 (AF423223); cluster 6 clones 646-2 (AF423284), 1326-2 (AF423222), and 1506-2 (AF497759); cluster 7 clones 367-2 (AF423253), 565-2 (AF423277), 739-2 (AF423289), 749-2 (AF423291), and 845-2 (AF423296); and cluster 8 clones 60-2 (AF423281), 353-2 (AF423251), 1306 (AF423219), and 1315-2 (AF423220). Additional clones belonging to the Bacillus clade (see Fig. 3B) included clones 2-1 (accession number AF423237), 125-1 (AF423216), 14-1 (AF423226), 154-2 (AF423232), 408-1 (AF423258), 1005-1 (AF423203), 309-1 (AF423246), 4-1 (AF423259), 10-1 (AF423204), 38-1 (AF423256), 21-1 (AF423238), 26-1 (AF423244), 102-1 (AF423205), 720-1 (AF423288), 511-1 (AF423270), 1488-1 (AF423230), 9-1 (AF423298), 513-1 (AF423272), 16-1 (AF423233), 48-1 (AF423304), and 1421-2 (AF423227).
RESULTS AND DISCUSSION
To demonstrate OFRG, we examined 1,536 rDNA clones from two agricultural soils by performing an analysis with 27 oligonucleotide probes. The principal factor influencing the discriminating power of this analysis is probe design. For this project, the probe set was developed by using a simulated annealing algorithm (6). The discriminating nature of the probes was visualized by the different patterns produced when a common set of clones was hybridized with each of the 27 probes (Fig. 2A). The hybridization pattern obtained with a single probe applied to all 1,536 soil rDNA clones is shown in Fig. 2B. The signal intensities obtained from these experiments reflected the number of occurrences of a probe sequence in each clone, as well as variations in DNA concentration resulting from the array construction process. To adjust for this variation, these data were normalized by using signal intensities from a reference probe hybridized to the same array of clones (probe 28) (Fig. 2A). Analysis with all 27 probes produced a hybridization fingerprint for every clone. A UPGMA analysis of the fingerprints was then used to generate a taxonomic depiction of the bacteria inhabiting the two soils (Fig. 3). Clones were identified from this analysis on the basis of their association with known rDNA sequences within the tree (Fig. 3). This was accomplished by including fingerprints from known rDNA sequences in the UPGMA analysis and by nucleotide sequence analysis of representative clones distributed throughout the tree. This process generated 766 clusters, which were grouped into five major taxa: Bacillus, Actinobacteria, Proteobacteria, and two assemblages containing clones with relatively low identities to a variety of known cultured bacteria. In this report, a cluster was defined as a group of clones with the same fingerprint.
FIG. 2.

Arrayed bacterial rDNA clones hybridized with 33P-labeled DNA oligonucleotide probes. (A) Discriminating probes 1 to 27 and reference probe 28 hybridized to a common set of clones; (B) discriminating probe 4 hybridized to 1,536 clones.
The OFRG analysis identified several potential differences in bacterial community composition between the two soils. The soils used were chosen because they possess different functional properties, which may be associated with their microfloras. The 9E soil suppresses the plant-parasitic nematode Heterodera schachtii, whereas the 9C soil does not suppress this pathogen although it comes from an adjacent field and has similar chemical and physical properties (30). In addition to the numerous compositional differences, members of the Bacillus and enterobacterial taxa were predominantly found in the 9C soil, while α-proteobacteria were almost exclusively identified in the 9E soil (Table 1 and Fig. 3). Even though compositional differences between the two soils were identified, correlations between specific bacterial populations and pathogen suppressiveness cannot be made from this experiment because of the limited number of samples analyzed and because these adjacent soils have neither common crop histories nor common weed and pest management practices. Nonetheless, the results demonstrate the potential of this approach for facilitating examination of community structure-function relationships, a topic of interest in many areas of microbiology.
TABLE 1.
Taxonomic distribution of bacterial rDNA clones obtained from two agricultural soils
| Taxon | No. of clonesa | |
|---|---|---|
| Soil 9C | Soil 9E | |
| Bacillus | 405 | 35 |
| Cytophaga-Flexibacter-Bacteroides group | 5 | 25 |
| Actinobacteria | 130 | 185 |
| Proteobacteria | 299 | 237 |
| α Subdivision | 10 | 142 |
| β and γ subdivisions | 162 | 87 |
| Enterobacteria | 127 | 8 |
The resolution of the OFRG analysis was evaluated by examining the nucleotide sequences of the clones in six clusters distributed throughout the UPGMA tree (Fig. 3A, clusters 1 and 4 to 8). Clusters 2 and 3 (Fig. 3A) were not used for this analysis because only two clones from these groups were fully sequenced. For each cluster, pairwise sequence analysis showed that clones with an average sequence identity of 97% were grouped in the same cluster. The range of identities was 92.7 to 100%, and 79% of the values were between 96 and 98%. Thus, this OFRG analysis approximated species level resolution because DNA-DNA reassociation experiments have been used to show that bacterial rDNA with sequence identities of 97% or more are likely to come from the same species (25). In general, the resolution of OFRG depends on probe set properties, such as the number of probes, their discriminatory power, and the suitability of the set for a specific environment. Further refinements of probe selection algorithms (6), coupled with the ever-expanding collections of rDNA sequences, should facilitate the design of probe sets for all types of microorganisms and environments. Additionally, we anticipate that future developments will also allow design of probe sets capable of differentiating microorganisms at various degrees of resolution (identity levels of 90%, 95%, 97%, etc.).
Several strategies have been used to estimate microbial species richness and diversity, and most of these strategies are based on extrapolation. The difficulty of such endeavors stems from the considerable diversity of organisms found in most environments, which is exemplified by estimates suggesting that 4,000 to 40,000 different bacterial species can inhabit a single gram of soil (26, 27). Utilization of OFRG may lead to more confident estimates of richness and diversity because it offers the potential of identifying most, if not all, of the rDNA sequences in an environment. In this work, we used the distribution of clones within UPGMA trees to estimate these parameters. Two trees were constructed, one for each of the soils. Clusters were used to represent species. With this approach, a Chao1 analysis was used to estimate that bacterial richness was 751 (soil 9C) or 1602 (soil 9E). Shannon's index was used to generate diversity values of 5.0 and 6.1 for the 9C and 9E soils, respectively. In addition, we also assessed diversity by adding the branch lengths from the trees (9C, 16.7; 9E, 33.4). In all of these analyses, the suppressive 9E soil exhibited greater bacterial species richness and diversity than the nonsuppressive 9C soil. This result suggests that these parameters may contribute to the H. schachtii suppressiveness, a general phenomenon that has also been described in other plant pathogen systems (2, 8).
Several experiments were performed to corroborate the results obtained by the OFRG analysis. In the first approach, we examined OFRG's ability to accurately identify rDNA clones. Examination of 102 clones distributed throughout the UPGMA tree showed that the identities obtained from the UPGMA analysis of the hybridization fingerprints were consistent with those obtained by a BLAST (National Center for Biotechnology Information) analysis of the nucleotide sequences (Fig. 3) (some data are not shown because Fig. 3 depicts a partial tree). In the second approach, we attempted to corroborate the soil-specific compositional differences identified by the OFRG analysis by determining if the same variations were present in the original soil DNA. This was accomplished through the development of specific PCR primers for eight clusters distributed throughout the tree (Fig. 3A). PCR amplifications performed with the 9C and 9E soil DNA and these primers confirmed the compositional differences, as the relative intensities of the PCR products correlated with the soil-specific distribution of the clones within each of the clusters (Fig. 4). For example, primers designed for a cluster containing only 9C clones produced either no visible PCR product or a relatively weak band when they were used to amplify 9E soil DNA. The results of these experiments support the bacterial community composition determined by OFRG, confirming the utility of this approach.
FIG. 4.

Amplification of soil DNA with cluster-specific PCR primers. The numbers at the top are cluster designations (see Fig. 3). C and E indicate soils 9C and 9E, respectively. Clusters 1, 3, and 5 contain only soil 9C clones. Clusters 2, 4, 6, 7, and 8 contain only soil 9E clones. Lane M contained a DNA ladder. The arrows indicate the DNA fragments amplified by the PCR primer pairs.
To demonstrate the impact that OFRG may have on microbial community studies, we examined the same two agricultural soils with DGGE, currently the most commonly used method for rDNA analysis. In this analysis, no definitive DNA bands were obtained from the pathogen-suppressing 9E soil, which suggested that there was a high level of bacterial diversity but provided little other community composition data (Fig. 5). For the nonsuppressive 9C soil, 13 DNA bands represented the entire bacterial community. The difference between these DGGE results and the results obtained by ORFG is striking, underscoring the potential of this new method for improving our understanding of microbial communities. This approach should also be useful for investigations of other microorganisms, such as fungi, and should have applications in other disciplines, including medicine, biotechnology, and ecosystem studies.
FIG. 5.
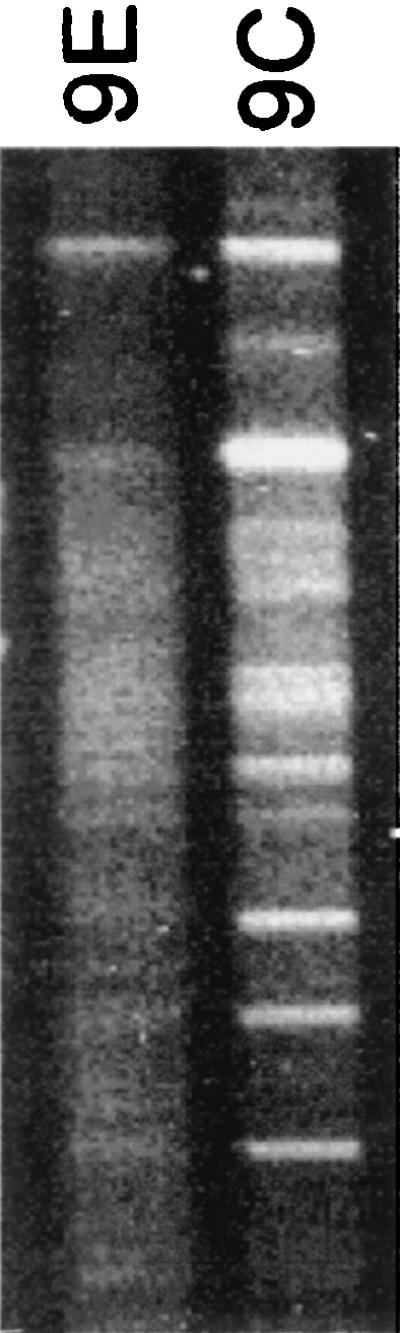
DGGE analysis of bacterial rDNA from soils 9C and 9E.
Acknowledgments
This research was funded by in part by grants from the UCR Vice Chancellor (seed grant to J.B. and D.C.), the UC Biotechnology Research & Training Program (J.B. and D.C.), and the NSF ITR program (G.D.V. and T.J.). L.V. was supported by Vaddia-BARD Postdoctoral Award FI-306-00 from BARD, The United States-Israel Binational Agricultural Research and Development Fund. G.D.V. was supported by MURST grant “Bioinformatica e Ricerca Genomica.” A.F. was supported by a Ph.D. fellowship from CONACYT. M.C. was supported by NSF grant CCR-9988360.
We thank Woody Smith and Mark Springer for their assistance with data processing and UPGMA tree construction and Brian Lanoil for his critical review of the manuscript.
Lea Valinsky and Gianluca Della Vedova contributed equally to this work.
REFERENCES
- 1.Amann, R. I., W. Ludwig, and K. H. Schleifer. 1995. Phylogenetic identification and in situ detection of individual microbial cells without cultivation. Microbiol. Rev. 59**:**143-169. [DOI] [PMC free article] [PubMed] [Google Scholar]
- 2.Baker, R. 1990. Diversity in biological control. Crop Prot. 10**:**85-94. [Google Scholar]
- 3.Barns, S. M., R. E. Fundyga, M. W. Jeffries, and N. R. Pace. 1994. Remarkable archaeal diversity detected in a Yellowstone National Park hot spring environment. Proc. Natl. Acad. Sci. USA 91**:**1609-1613. [DOI] [PMC free article] [PubMed] [Google Scholar]
- 4.Behr, T., C. Koob, M. Schedl, A. Mehlen, H. Meier, D. Knopp, E. Frahm, U. Obst, K. H. Schleifer, R. Niessner, and W. Ludwig. 2000. A nested array of rRNA targeted probes for the detection and identification of enterococci by reverse hybridization. Syst. Appl. Microbiol. 23**:**563-572. [DOI] [PubMed] [Google Scholar]
- 5.Borneman, J., and E. W. Triplett. 1997. Molecular microbial diversity in soils from eastern Amazonia: evidence for unusual microorganisms and microbial population shifts associated with deforestation. Appl. Environ. Microbiol. 63**:**2647-2653. [DOI] [PMC free article] [PubMed] [Google Scholar]
- 6.Borneman, J., M. Chrobak, G. Della Vedova, A. Figueroa, and T. Jiang. 2001. Probe selection algorithms with applications in the analysis of microbial communities. Bioinformatics 17(Suppl. 1)**:**S39-S48. [DOI] [PubMed] [Google Scholar]
- 7.Borneman, J., P. W. Skroch, K. M. O'Sullivan, J. A. Palus, N. G. Rumjanek, J. L. Jansen, J. Nienhuis, and E. W. Triplett. 1996. Molecular microbial diversity of an agricultural soil in Wisconsin. Appl. Environ. Microbiol. 62**:**1935-1943. [DOI] [PMC free article] [PubMed] [Google Scholar]
- 8.Cook, R. J., and K. F. Baker. 1983. The nature and practice of biological control of plant pathogens. American Phytopathological Society, St. Paul, Minn.
- 9.Drmanac, R. 1999. cDNA screening by array hybridization. Methods Enzymol. 303**:**165-178. [DOI] [PubMed] [Google Scholar]
- 10.Drmanac, R., G. Lennon, S. Drmanac, I. Labat, R. Crkvenjakov, and H. Lehrach. 1991, p. 60-75. In C. Cantor and H. Lim (ed.), Proceedings of the First International Conference on Electrophoresis, Supercomputing and the Human Genome. World Scientific, Singapore.
- 11.Drmanac, R., Z. Stezoska, I. Labat, S. Drmanac, and R. Crkvenjakov. 1990. Reliable hybridization of oligonucleotides as short as six nucleotides. DNA Cell Biol. 9**:**527-534. [DOI] [PubMed] [Google Scholar]
- 12.Drmanac, S., N. A. Stavropoulos, I. Labat, J. Vonau, B. Hauser, M. B. Soares, and R. Drmanac. 1996. Gene-representing cDNA clusters defined by hybridization of 57,419 clones from infant brain libraries with short oligonucleotide probes. Genomics 37**:**29-40. [DOI] [PubMed] [Google Scholar]
- 13.Fox, G. E., K. R. Pechman, and C. R. Woese. 1977. Comparative cataloging of 16S ribosomal ribonucleic acid: molecular approach to prokaryotic systematics. Int. J. Syst. Bacteriol. 27**:**44-57. [Google Scholar]
- 14.Giovannoni, S. J., T. B. Britschgi, C. L. Moyer, and K. G. Field. 1990. Genetic diversity in Sargasso Sea bacterioplankton. Nature 345**:**60-63. [DOI] [PubMed] [Google Scholar]
- 15.Guschin, D. Y., B. K. Mobarry, D. Proudnikov, D. A. Stahl, B. E. Rittmann, and A. D. Mirzaberkov. 1997. Oligonucleotide microchips as genosensors for determinative and environmental studies in microbiology. Appl. Environ. Microbiol. 63**:**2397-2402. [DOI] [PMC free article] [PubMed] [Google Scholar]
- 16.Kirkpatrick, S., C. D. Gelatt, and M. Vecchi. 1983. Optimization by simulated annealing. Science 220**:**671-680. [DOI] [PubMed] [Google Scholar]
- 17.Lane, D. J. 1991. 16S/23S rRNA sequencing, p. 115-175. In E. Stackebrandt and M. Goodfellow (ed.), Nucleic acid techniques in bacterial systematics. Wiley, New York, N.Y.
- 18.Lennon, G. S., and H. Lehrach. 1991. Hybridization analyses of arrayed complementary DNA libraries. Trends Genet. 7**:**314-317. [DOI] [PubMed] [Google Scholar]
- 19.Liu, W. T., T. L. Marsh, H. Cheng, and L. J. Forney. 1997. Characterization of microbial diversity by determining terminal restriction fragment length polymorphisms of genes encoding 16S rRNA. Appl. Environ. Microbiol. 63**:**4516-4522. [DOI] [PMC free article] [PubMed] [Google Scholar]
- 20.Muyzer, G., E. D. De Waal, and A. G. Uitterlinden. 1993. Profiling of complex microbial populations by denaturing gradient gel electrophoresis analysis of polymerase chain reaction amplified genes coding for 16S rRNA. Appl. Environ. Microbiol. 59**:**695-700. [DOI] [PMC free article] [PubMed] [Google Scholar]
- 21.Pace, N. R. 1997. A molecular view of microbial diversity and the biosphere. Science 276**:**734-740. [DOI] [PubMed] [Google Scholar]
- 22.Rudi, K., O. M. Skulberg, R. Skulberg, and K. S. Jakobsen. 2000. Application of sequence-specific labeled 16S rRNA gene oligonucleotide probes for genetic profiling of cyanobacterial abundance and diversity by array hybridization. Appl. Environ. Microbiol. 66**:**4004-4011. [DOI] [PMC free article] [PubMed] [Google Scholar]
- 23.Small, J., D. R. Call, F. J. Brockman, T. M. Straub, and D. P. Chandler 2001. Direct detection of 16S rRNA in soil extracts by using oligonucleotide microarrays. Appl. Environ. Microbiol. 67**:**4708-4716. [DOI] [PMC free article] [PubMed] [Google Scholar]
- 24.Sogin, S. J., M. L. Sogin, and C. R. Woese. 1972. Phylogenetic measurement in prokaryotes by primary structural characterization. J. Mol. Evol. 1**:**173-184. [DOI] [PubMed] [Google Scholar]
- 25.Stackebrandt, E., and B. M. Goebel. 1994. Taxonomic note: a place for DNA-DNA reassociation and 16S rRNA sequence analysis in the present species definition in bacteriology. Int. J. Syst. Bacteriol. 44**:**846-849. [Google Scholar]
- 26.Tiedje, J. M. 1995. Approaches to the comprehensive evaluation of prokaryote diversity of a habitat, p. 73-87. In D. Allsopp, R. R. Colwell, and D. L. Hawksworth (ed.), Microbial diversity and ecosystem function. Cab International, Wallingford, United Kingdom.
- 27.Torsvik, V., J. Goksoyr, and F. L. Daae. 1990. High diversity in DNA of soil bacteria. Appl. Environ. Microbiol. 56**:**782-787. [DOI] [PMC free article] [PubMed] [Google Scholar]
- 28.Urakawa, H., P. A. Noble, S. El Fantroussi, J. J. Kelly, and D. A. Stahl. 2002. Single-base-pair discrimination of terminal mismatches by using oligonucleotide microarrays and neural network analyses. Appl. Environ. Microbiol. 68**:**235-244. [DOI] [PMC free article] [PubMed] [Google Scholar]
- 29.Ward, D. M., M. M. Bateson, R. Weller, and A. L. Ruff-Roberts. 1992. Ribosomal RNA analysis of microorganisms as they occur in nature. Adv. Microb. Ecol. 12**:**219-286. [Google Scholar]
- 30.Westphal, A., and J. O. Becker. 1999. Biological suppression and natural population decline of Heterodera schachtii in a California field. Phytopathology 89**:**434-440. [DOI] [PubMed] [Google Scholar]
- 31.Woese, C. R., and G. E. Fox. 1977. Phylogenetic structure of the prokaryotic domain: the primary kingdoms. Proc. Natl. Acad. Sci. USA 74**:**5088-5090. [DOI] [PMC free article] [PubMed] [Google Scholar]
- 32.Woese, C. R., G. E. Fox, L. Zablen, T. Urchida, L. Bonen, K. Pechman, B. J. Lewis, and D. Stahl. 1975. Conservation of primary structure in 16S ribosomal RNA. Nature 254**:**83-86. [DOI] [PubMed] [Google Scholar]
- 33.Woese, C. R., O. Kandler, and M. L. Wheelis. 1990. Towards a natural system of organisms: proposal for the domains Archaea, Bacteria, Eucarya. Proc. Natl. Acad. Sci. USA 87**:**4576-4579. [DOI] [PMC free article] [PubMed] [Google Scholar]
- 34.Yang, C. H., and D. E. Crowley. 2000. Rhizosphere microbial community structure in relation to root location and plant iron nutritional status. Appl. Environ. Microbiol. 66**:**345-351. [DOI] [PMC free article] [PubMed] [Google Scholar]