High-Throughput Gene Mapping in Caenorhabditis elegans (original) (raw)
Abstract
Positional cloning of mutations in model genetic systems is a powerful method for the identification of targets of medical and agricultural importance. To facilitate the high-throughput mapping of mutations in Caenorhabditis elegans, we have identified a further 9602 putative new single nucleotide polymorphisms (SNPs) between two C. elegans strains, Bristol N2 and the Hawaiian mapping strain CB4856, by sequencing inserts from a CB4856 genomic DNA library and using an informatics pipeline to compare sequences with the canonical N2 genomic sequence. When combined with data from other laboratories, our marker set of 17,189 SNPs provides even coverage of the complete worm genome. To date, we have confirmed >1099 evenly spaced SNPs (one every 91 ± 56 kb) across the six chromosomes and validated the utility of our SNP marker set and new fluorescence polarization-based genotyping methods for systematic and high-throughput identification of genes in C. elegans by cloning several proprietary genes. We illustrate our approach by recombination mapping and confirmation of the mutation in the cloned gene, dpy-18.
[The sequence data described in this paper have been submitted to the NCBI dbSNP data library under accession nos. 4388625–4389689 and GenBank dbSTS under accession nos. 973810–974874. The following individuals and institutions kindly provided reagents, samples, or unpublished information as indicated in the paper: The C. elegans Sequencing Consortium and The Caenorhabditis Genetics Center.]
Forward genetic screens in model organisms remain a crucial tool for uncovering new biological information (Matthews and Kopczynski 2001; Sternberg 2001). These approaches require extensive recombination mapping of a mutation to discover the identity of a gene. Traditional methods in model systems have typically relied on the use of visible phenotypic markers for linkage mapping of mutations. However, single nucleotide polymorphism (SNP) markers are currently favored because of their relative abundance and because they can eliminate confounding interaction with the mutant phenotype, although in some cases outcrossing introduces genetic modifiers.
To date, the only strategy for SNP-based cloning in the nematode Caenorhabditis elegans (C. elegans Sequencing Consortium 1998) is the snip-SNP approach (Wicks et al. 2001). Here we present an alternative tripartite approach for rapid SNP-based mapping in the worm. We first established a set of finely spaced genome-spanning SNP markers and then combined this resource with a tiered mapping strategy that progressively narrows the region containing the gene of interest. Finally, we used a high-throughput SNP assay that allowed reliable and rapid genotyping with low marker development costs. This strategy afforded rapid gene cloning in C. elegans and can be tailored for use in other model organisms with a sequenced genome.
RESULTS
Our initial goal was to create a set of reliable SNP markers at a density of one marker every 100 kb across the C. elegans genome. To achieve this density, a large set of predicted SNPs scattered throughout the C. elegans genome was required. We chose to identify polymorphisms between the Hawaiian CB4856 strain of C. elegans and the commonly used Bristol N2 laboratory strain, because the CB4856 strain is known to have the most even distribution of SNPs across the chromosomes (Koch et al. 2000; Wicks et al. 2001). A small insert (1.7 kb ± 0.5 kb) library was constructed from CB4856 genomic DNA. Double-end sequencing of cloned inserts from this library produced 16,941 high quality sequencing reads, which represented 7.3% sequence coverage of the genome. An informatics software pipeline (Vysotskaia et al. 2001) was then used to predict likely polymorphisms between CB4856 sequencing reads and the canonical N2 genomic sequence (WS version 48). The pipeline identified a total of 10,711 predicted polymorphisms; 9602 of these were unique from those previously reported. These unique polymorphisms include 6902 substitutions (SNPs), 1885 deletions (one or more bases removed), and 815 insertions (one or more bases added). We estimate the overall rate of polymorphism between the two strains to be one substitution/insertion/deletion per 840 bases. Transitions accounted for 57% (3906 SNPs) of substitution SNPs, whereas 43% (2996 SNPs) were transversions. These observations agreed with previous findings from a smaller dataset (Wicks et al. 2001). Validated SNP data are available from NCBI dbSNP (accession nos.: 4388625–4389689) and GenBank dbSTS (accession nos.: G73810–G74874).
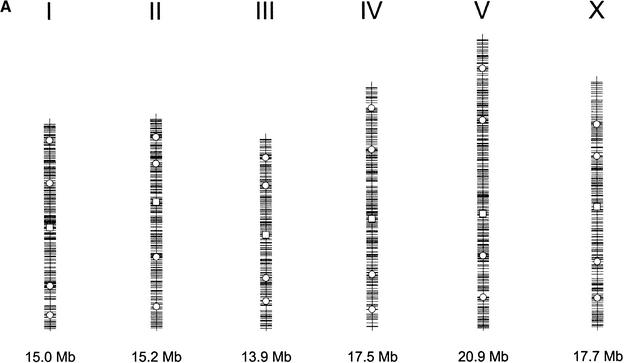
We combined the publicly available C. elegans CB4856 SNP information (http://genome.wustl.edu/gsc/C_elegans/SNP/index.html) with our data to obtain a total of 17,189 predicted polymorphisms throughout the C. elegans genome and then systematically chose one substitution SNP spaced approximately every 100 kb. Oligonucleotide primers were designed flanking these predicted SNPs for PCR amplification. The presence of a SNP was confirmed by sequencing the PCR product and/or by a fluorescence polarization-template directed incorporation (FP-TDI) SNP genotyping assay (see below). The latter method proved to be faster than sequencing and had a comparable failure rate of ∼10%, which includes mispredictions, primer failure, and assay failure. To date, a set of 1099 markers have been confirmed and formatted for a genotyping assay; 427 (39%) of these 1099 confirmed SNPs were derived from our putative new 9602 SNPs. Our substitution SNP marker set has an average spacing of 91 kb ± 56 kb across the genome (Fig. 1A). The most telomeric SNPs on average are located ∼72.5 kb from the telomeres of each chromosome, ranging from 16.6 kb (left end of chromosome V) to 178.3 kb (right end of chromosome III).
Figure 1.
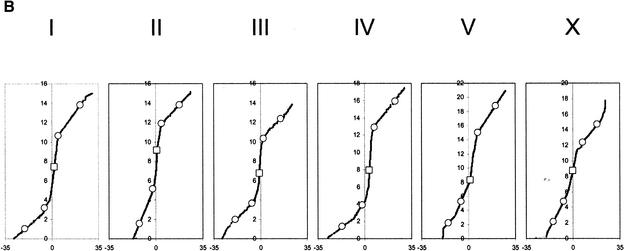
Distribution of single nuclear polymorphism (SNP) markers across the Caenorhabditis elegans genome. (A) Marker distribution along the physical map of chromosome. The location of the Tier 1 SNP markers are shown with open squares, and the location of Tier 2 markers are shown by open circles. The location of each of the validated 1099 markers is shown along the chromosomal axis. The largest gap is 449 kb (chromosome I), and the average validated marker spacing is 91 kb ± 56 kb. (B) Recombination rates across the six chromosomes. The physical (Mb) location of all predicted polymorphisms (y-axis) is plotted versus the extrapolated genetic (cM) location (x-axis) of the associated cosmid across the genome (Genetic Map Position from Wormbase; Stein et al. 2001). This illustrates the rate of change in the recombination rate across the chromosome and shows the “gene cluster” effect in the center of the autosomes (Barnes et al. 1995). This information is used during mapping, because the local recombination rate affects the number of putative recombinants that must be genotyped to obtain a 100-kb interval.
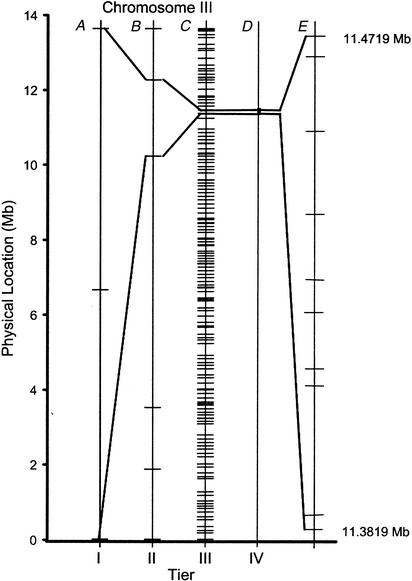
By use of the comprehensive SNP marker set, we implemented a mapping strategy that uses iterative phases to progressively refine a genomic region of interest (ROI) containing a mutant gene. In C. elegans forward genetic screens, mapping often begins by genotyping phenotypically mutant F2 offspring from a cross of a homozygous mutant animal (N2 background) to a wild-type animal (CB4856 background) (see Methods). High-throughput genotyping of 30–60 offspring, using a preselected marker set of 30 SNPs (Table 1  ; Tier 1, 2), typically localizes the gene of interest to a subchromosomal region that can range in size from 1 to 6.7 Mb (Fig. 1B; Table 1). Alternatively, this same mapping resolution can be achieved by first defining chromosomal linkage for the gene of interest using only the six Tier 1 SNP markers (Fig. 2A; Table 1) and then defining a subchromosomal region by use of the four Tier 2 markers on that particular chromosome (Fig. 2B). The latter method uses the same number of recombinants but requires less genotyping. To further refine the map position to ∼100 kb, we first assay any remaining informative recombinants (those that have a recombination event within the ROI) with all markers that lie within the ROI to define the smallest candidate gene region. We then routinely collect an additional 1000–2500 DNA samples (Fig. 1B; Genetic Map Position from Wormbase; Stein et al. 2001) from F2 animals as described above. Genotyping the new F2 DNA samples with SNP markers flanking the ROI identifies additional informative samples. These additional informative samples are then genotyped using the complete set of markers for that region (Fig. 2C). A finer map position than that afforded by the set of 1099 markers may be obtained by validating any predicted SNPs within the mapping interval or by de novo SNP discovery (Fig. 2D, E; Jakubowski and Kornfeld 1999; Koch et al. 2000) coupled with analysis of additional recombinants. In practice, however, fine-scale map data are often not required because candidate genes (or all genes) within the ROI can be identified and sequenced for mutations (Collins 1995). Alternatively, candidate genes can be tested using RNA interference (RNAi; Fire et al. 1998) for gene “knock-down” or cosmid/open reading frame (ORF) rescue for gene complementation (rescue). Large RNAi screens have identified loss-of-function phenotypes for many genes in C. elegans, and currently RNAi data are available for >5000 of the 19,000 C. elegans genes (Fraser et al. 2000; Gonczy et al. 2000; Maeda 2001).
Figure 2.
Tiered mapping strategy. Shown is a schematized mapping workflow. (A) Tier 1 mapping localizes the gene of interest to a chromosome by assessing linkage to one centrally located SNP. (B) Tier 2 mapping localizes the gene to a subregion of the chromosome. This region can vary in size between 1 and 6.7 Mb. In the dpy-18 example shown, the gene falls between two SNP markers that are 2 Mb apart on chromosome III. This resolution is routinely achievable by genotyping 30–60 recombinants. (C) Tier 3 mapping begins by identification of informative animals with recombination breakpoints within the region defined by Tier 2 and then fine mapping with Tier 3 markers to narrow the region of interest. For dpy-18, Tier 3 mapping localizes the gene to a region as small as 97 kb and thus narrowed the candidate region to ∼0.1% of the worm genome. The number of recombinants required to achieve this mapping resolution will depend on the local recombination rate (Fig. 1B; Genetic Map Position from Wormbase; Stein et al. 2001) along the chromosome in the vicinity of the mutated gene. (D and E) Tier 4 mapping and/or mutation detection. Further refinement of the candidate interval occurs by validation of additional SNP markers and genotyping of informative recombinants. For dpy-18, the location of the predicted substitution SNPs located within the 97-kb region of chromosome III are shown. During this fine-mapping process, candidate gene approaches such as cosmid rescue or RNA interference (RNAi) can also be used to help identify the mutation.
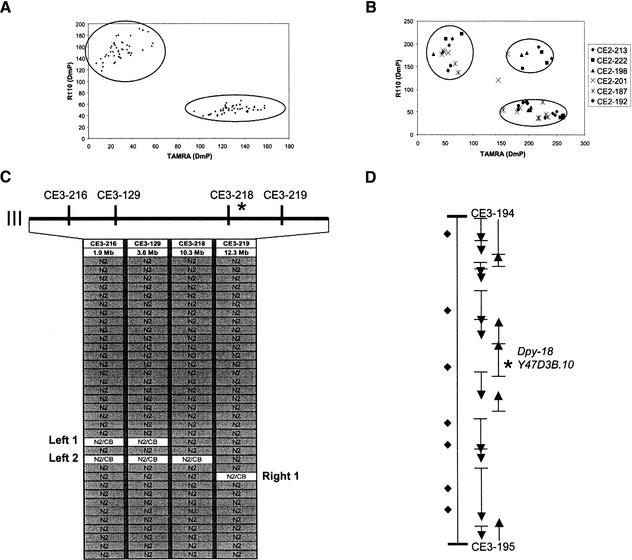
Our mapping strategy required high-throughput genotyping for maximum speed and efficiency. Of the several available methods for SNP analysis (Kwok 2001), we selected the FP-TDI assay for its consistent and interpretable results, low assay-setup cost, and automated detection. We performed the FP-TDI assay (Chen et al. 1999) using commercial reagents (AcycloPrime-FP SNP Detection Kit, Perkin Elmer Life Sciences, Inc.) in 384-well format with a standard liquid handling robot (Tecan Genesis, Tecan). Figure 3 shows examples of data obtained using this assay. The separation of dyes that is achieved using control N2 and CB4856 genomic DNA is illustrated in Figure 3A and B and shows the consistent clarity of base-calling data obtained from six randomly chosen chromosome II SNPs on F2 recombinants (crude worm lysates).
Figure 3.
Sample fluorescence polarization-template directed incorporation (FP-TDI) mapping data. (A) High quality discrimination data from the FP-TDI assay of 48 random SNP markers on control genomic DNA from N2 and CB4856 strains. SNPs are detected through analysis of a single base pair extension from a sequencing primer that hybridizes just adjacent to the polymorphic nucleotide (Chen et al. 1999). Clusters are readily identified and unambiguous. (B) FP-TDI data from eight recombinant samples (crude worm lysates), each tested with six SNP markers. In this case, the FP-TDI kit used distinguishes A from T, the most prevalent SNP change in C. elegans. (C) FP-TDI analysis with the four Tier 2 SNP markers on chromosome III using 35 samples from a mapping cross to localize dpy-18. We localized the recessive gene to a 2.0-Mb subregion of chromosome III. SNP data are converted to table format for interpretation, and the informative recombinants that defined the interval are labeled Left 1, Left 2, and Right 1. (D) The 97-kb interval defined by the Tier 3 markers CE3–194 and CE3–195 is shown. There are 16 predicted genes in this region (AceDB version WS-48); for Tier 4 mapping there are nine predicted substitution SNPs in this interval. RNAi of the predicted gene sequence Y47D3B.10 is known to give a Dumpy (Dpy) visible phenotype (Hill et al. 2000), indicating that this gene is a strong candidate for dpy-18. We confirmed by directed sequencing that dpy-18(e364) did contain a mutation G to A in exon 3 altering the TGG(Trp) codon to TAG(Stop).
This strategy has been applied extensively for identification of novel genes. To date, we have mapped more than 50 loci and cloned >30 genes from several forward genetic screens. We can routinely identify a gene of interest within a 2- to 4-mo time frame. To illustrate this process, Fig. 3C shows results from Tiers 1 and 2 analysis of just 35 DNA samples in the mapping of the cloned gene dpy-18 (Hill et al. 2000) to a 2.0-Mb region of chromosome III. This simple analysis narrows the ROI to only 2% of the genome. Figure 3D shows the 97-kb interval bound by the two validated FP-TDI SNP markers flanking dpy-18. This panel shows the resolution attainable with the set of markers currently available. In addition, information from the RNAi screen of chromosome III (Gonczy et al. 2000) indicates the sequence Y47D3B.10 as being a good candidate gene for dpy-18. We sequenced this e364 allele and confirmed the published mutation in the third exon (Hill et al. 2000), which introduces a premature stop codon into the coding sequence.
DISCUSSION
We have presented a tripartite, comprehensive strategy for systematic and high-throughput gene identification in C. elegans. This strategy required the development of finely spaced, genome-wide SNP markers and combined an iterative mapping approach with the high-throughput FP-TDI SNP marker assay. We optimized the FP-TDI assay for automated reaction setup and nucleotide analog detection. The FP-TDI assay is highly reliable and allows greater flexibility in selecting which SNPs are assayed, as well as how many samples are genotyped. Our strategy effectively speeds mutation detection and gene cloning in C. elegans, especially when combined with tools for candidate gene analysis such as cosmid rescue and RNAi. Many aspects of our approach are transportable to other model systems and could allow for rapid and systematic gene identification in these systems.
METHODS
Library Construction and Sequencing
Random, genome-wide DNA sequences from the Hawaiian C. elegans strain CB4856 were obtained by constructing a small insert genomic library for shotgun sequencing. Library construction was described previously (Vysotskaia et al. 2001). Double-end sequencing of clones was performed on ABI 3700 (Perkin Elmer) DNA sequencers.
SNP Prediction
The CB4856 sequence traces were aligned against Bristol N2 genomic sequence (C. elegans Sequencing Consortium 1998) using a custom script that takes into account the quality of the neighboring sequence as well as that of the potential polymorphic base (Vysotskaia et al. 2001). Polymorphism information can be found in NCBI dbSNP (accession nos. 4388625–4389689) and GenBank dbSTS (accession nos.: G73810–G74874).
SNP Confirmation
We modified primer3 (http://www-genome.wi.mit.edu/genome_software/other/primer3.html) and designed primers for PCR amplicons ranging between 150 and 300 bases that contain the selected putative SNPs. An initial set of ∼100 of the predicted polymorphisms between the Bristol N2 and CB4856 strains were confirmed by sequencing the PCR amplicon from each strain. Sequencing was performed using standard protocols, and products were resolved using capillary electrophoresis on ABI 3700 (Perkin Elmer) instruments.
All 1099 SNPs were also confirmed by FP-TDI (Chen et al. 1999). We used the SNP-kit (AcycloPrime-FP SNP Detection Kit, Perkin Elmer Life Sciences, Inc.) and modified the volumes for compatibility with 384-well PCR. Reactions were set up on the Tecan Genesis 150 robot (Tecan). Briefly, a 200- to 300-bp region of the genome containing the SNP was amplified using standard PCR (6 μL reaction volume). Excess primers and dNTPs were removed by addition of a 6-μL cocktail of shrimp alkaline phosphatase (Roche) and E. coli Exonuclease I (USB) reaction (12 μL final reaction volume). The single base extension reaction (6 μL reaction volume added to above) was performed using the SNP kit components (acyclo dideoxynucleotide triphosphate [ddNTP] terminators are used instead of fluorescently labeled ddNTPs) and a 30-mer oligonucleotide. Addition of the oligonucleotide, complementary to the sequence on one DNA strand immediately 5′ of the polymorphic base, allows incorporation of one of the two acyclo terminators in the kit depending on the sequences within the amplified PCR product. Allelic discrimination occurs through measuring the change in fluorescence polarization of the dyes associated with the incorporated nucleotide.
SNP markers, the sequence of all required primers, and standard assay conditions for FP-TDI have been deposited in GenBank and dbSNP and are also available on the Exelixis web site (http://www.exelixis.com/discovery/elegans).
Crossing Strategy
Mapping a recessive mutation created in the Bristol N2 background commences by crossing homozygous mutant (N2-background) animals with wild-type CB4856 animals. The F1 progeny are then segregated away from other progeny and allowed to self-fertilize. The resulting F2 animals are then picked onto 6-cm Petri plates and phenotyped for the mutation. Alternatively, after picking of the F2 animals onto plates, the F2 can be allowed to self-fertilize and lay a brood of F3 animals, and these are then phenotyped. Only F2 animals that are homozygous for the recessive mutation (or homozygous without it) are potentially informative and are genotyped.
To map a dominant mutation, essentially the same procedure is followed except the F1 animals are backcrossed to CB4856 animals, and F2 showing the mapping phenotype (mutant/CB4856) are singled from the resulting outcross progeny.
DNA Sample Preparation
DNA samples for PCR were prepared as described previously (Williams et al. 1992). This procedure usually yields DNA at a concentration of 100 ng/μL. A portion of the population not used for the DNA lysate can be saved for reconfirmation of a phenotype.
WEB SITE REFERENCES
http://genome.wustl.edu; Washington University, School of Medicine, Genome Sequencing Center.
http://www.exelixis.com; Exelixis, Inc. home page.
http://www-genome.wi.mit.edu; Whitehead Institute Center for Genome Research.
Acknowledgments
We thank Candace Swimmer, Exelixis Sequencing-Core, and all our Genomics and Genetics colleagues, especially Mike Ellis, Jon Margolis, Ross Francis, Scott Ogg, Casey Kopczynski, and Geoff Duyk for their valuable comments and suggestions throughout this study. We also thank the C. elegans Sequencing Consortium for providing N2 genomic sequences and the Caenorhabditis Genetics Center for the dpy-18 (e364) mutant.
The publication costs of this article were defrayed in part by payment of page charges. This article must therefore be hereby marked “advertisement” in accordance with 18 USC section 1734 solely to indicate this fact.
Footnotes
E-MAIL cancilla@exelixis.com; FAX (650) 837-7220.
Article and publication are at http://www.genome.org/cgi/doi/10.1101/gr.208902.
REFERENCES
- Barnes TM, Kohara Y, Coulson A, Hekimi S. Mitotic recombination, noncoding DNA and genomic organization in Caenorhabditis elegans. Genetics. 1995;141:159–179. doi: 10.1093/genetics/141.1.159. [DOI] [PMC free article] [PubMed] [Google Scholar]
- C. elegans Sequencing Consortium. Genome sequence for the nematode C. elegans: A platform for investigating biology. Science. 1998;282:2012–2018. doi: 10.1126/science.282.5396.2012. [DOI] [PubMed] [Google Scholar]
- Chen X, Levine L, Kwok PY. Fluorescence polarization in homogeneous nucleic acid analysis. Genome Res. 1999;9:492–498. [PMC free article] [PubMed] [Google Scholar]
- Collins FS. Positional cloning moves from perditional to traditional. Nat Genet. 1995;9:347–350. doi: 10.1038/ng0495-347. [DOI] [PubMed] [Google Scholar]
- Fire A, Xu S, Montgomery MK, Kostas SA, Driver SE, Mello CC. Potent and specific genetic interference by double-stranded RNA in Caenorhabditis elegans. Nature. 1998;391:806–811. doi: 10.1038/35888. [DOI] [PubMed] [Google Scholar]
- Fraser AG, Kamath RS, Zipperlen P, Martinez-Campos M, Sohrmann M, Ahringer J. Functional genomic analysis of C. elegans chromosome I by systematic RNA interference. Nature. 2000;408:325–330. doi: 10.1038/35042517. [DOI] [PubMed] [Google Scholar]
- Gonczy P, Echeverri G, Oegema K, Coulson A, Jones SJ, Copley RR, Duperon J, Oegema J, Brehm M, Cassin E, et al. Functional genomic analysis of cell division in C. elegans using RNAi of genes on chromosome III. Nature. 2000;408:331–336. doi: 10.1038/35042526. [DOI] [PubMed] [Google Scholar]
- Hill KL, Harfe BD, Dobbins CA, L'Hernault SW. dpy-18 encodes an alpha-subunit of prolyl-4-hydroxylase in Caenorhabditis elegans. Genetics. 2000;155:1139–1148. doi: 10.1093/genetics/155.3.1139. [DOI] [PMC free article] [PubMed] [Google Scholar]
- Jakubowski J, Kornfeld K. A local, high-density, single-nucleotide polymorphism map used to clone Caenorhabditis elegans cdf-1. Genetics. 1999;153:743–752. doi: 10.1093/genetics/153.2.743. [DOI] [PMC free article] [PubMed] [Google Scholar]
- Koch R, van Luenen HGAM, van der Horst M, Thijssen KL, Plasterk RHA. Single nucleotide polymorphisms in wild isolates of Caenorhabditis elegans. Genome Res. 2000;10:1690–1696. doi: 10.1101/gr.gr-1471r. [DOI] [PMC free article] [PubMed] [Google Scholar]
- Kwok P-Y. Methods for genotyping single nucleotide polymorphisms. Ann Rev Genomics Hum Genet. 2001;2:235–258. doi: 10.1146/annurev.genom.2.1.235. [DOI] [PubMed] [Google Scholar]
- Maeda I. Large-scale analysis of gene function in Caenorhabditis elegans by high-throughput RNAi. Curr Biol. 2001;11:171–176. doi: 10.1016/s0960-9822(01)00052-5. [DOI] [PubMed] [Google Scholar]
- Matthews DJ, Kopczynski J. Using model-system genetics for drug-based target discovery. Drug Discov Today. 2001;6:141–149. doi: 10.1016/s1359-6446(00)01612-3. [DOI] [PubMed] [Google Scholar]
- Stein L, Sternberg P, Durbin R, Thierry-Mieg J, Spieth J. Wormbase: Network access to the genome and biology of Caenorhabditis elegans. Nucleic Acids Res. 2001;29:82–86. doi: 10.1093/nar/29.1.82. [DOI] [PMC free article] [PubMed] [Google Scholar]
- Sternberg PW. Working in the post-genomic C. elegans world. Cell. 2001;105:173–176. doi: 10.1016/s0092-8674(01)00308-7. [DOI] [PubMed] [Google Scholar]
- Vysotskaia VS, Curtis DE, Voinov AV, Kathir P, Silflow CD, Lefebvre PA. Development of genome-wide SNPs in Chlamydomonas reinhardtii. Plant Phys. 2001;127:386–389. [PMC free article] [PubMed] [Google Scholar]
- Wicks SR, Yeh RT, Gish WR, Waterston RH, Plasterk RHA. Rapid gene mapping in Caenorhabditis elegans using a high density polymorphism map. Nat Genet. 2001;28:160–164. doi: 10.1038/88878. [DOI] [PubMed] [Google Scholar]
- Williams BD, Schrank B, Huynh C, Shownkeen R, Waterston RH. A genetic mapping system in Caenorhabditis elegans based on polymorphic sequence-tagged sites. Genetics. 1992;131:609–624. doi: 10.1093/genetics/131.3.609. [DOI] [PMC free article] [PubMed] [Google Scholar]


