Lactate and glucose interactions during rest and exercise in men: effect of exogenous lactate infusion (original) (raw)
Abstract
To test the hypothesis that lactate plays a central role in the distribution of carbohydrate (CHO) potential energy for oxidation and glucose production (GP), we performed a lactate clamp (LC) procedure during rest and moderate intensity exercise. Blood [lactate] was clamped at ≈4 mm by exogenous lactate infusion. Subjects performed 90 min exercise trials at 65 % of the peak rate of oxygen consumption (_V̇_O2,peak; 65 %), 55 % _V̇_O2,peak (55 %) and 55 % _V̇_O2,peak with lactate clamped to the blood [lactate] that was measured at 65 % _V̇_O2,peak (55 %-LC). Lactate and glucose rates of appearance (_R_a), disappearance (_R_d) and oxidation (_R_ox) were measured with a combination of [3-13C]lactate, H13CO3−, and [6,6-2H2]glucose tracers. During rest and exercise, lactate _R_a and _R_d were increased at 55 %-LC compared to 55 %. Glucose _R_a and _R_d were decreased during 55 %-LC compared to 55 %. Lactate _R_ox was increased by LC during exercise (55 %: 6.52 ± 0.65 and 55 %-LC: 10.01 ± 0.68 mg kg−1 min−1) which was concurrent with a decrease in glucose oxidation (55 %: 7.64 ± 0.4 and 55 %-LC: 4.35 ± 0.31 mg kg−1 min−1). With LC, incorporation of 13C from tracer lactate into blood glucose (L → GNG) increased while both GP and calculated hepatic glycogenolysis (GLY) decreased. Therefore, increased blood [lactate] during moderate intensity exercise increased lactate oxidation, spared blood glucose and decreased glucose production. Further, exogenous lactate infusion did not affect rating of perceived exertion (RPE) during exercise. These results demonstrate that lactate is a useful carbohydrate in times of increased energy demand.
Muscle is a site of lactate production and utilization with shuttling and oxidation occurring both among (Brooks, 1985) and within (Brooks, 1998) muscles. Additionally, during moderate-intensity exercise lactate turnover often exceeds that of glucose (Brooks, 1991), and lactate rate of oxidation (_R_ox) can represent as much as 25 % of whole body carbohydrate (CHO) _R_ox (Bergman et al. 1999_b_). Whereas the importance of lactate as a fuel is recognized, the interactions of lactate and glucose as CHO sources for exercising muscle are relatively unexplored.
Pearce & Connett (1980) demonstrated in isolated, non-contracting, rat soleus muscle that 8 mm lactate resulted in a decreased oxidation of glucose compared to no lactate. Further, a series of studies on rats (Pagano et al. 1997; Vettor et al. 1997) demonstrated that lactate infusion decreased glucose rate of disappearance (_R_d) in skeletal muscle (Vettor et al. 1997) during a euglycaemic- hyperinsulinaemic clamp, and a lactate infusion during hyperglycaemia resulted in increased glucose _R_d with increased glycogen synthesis, but unchanged flux through glycolysis (Pagano et al. 1997). More recently the same group (Lombardi et al. 1999) demonstrated that a 24 h lactate infusion decreased GLUT-4 mRNA and protein content, offering a possible mechanism for decreased glucose disposal in disease states with chronic elevated lactate levels. Whereas the data on resting rats are in good agreement, data in humans are less consistent.
Lactate infusion in resting humans during a euglycaemic- hyperinsulinaemic clamp had no effect on glucose exchange across an inactive forearm (Ferrannini et al. 1993). We (Miller et al. 2002) recently demonstrated with a lactate clamp (LC) procedure that exogenous lactate infusion resulted in decreased glucose oxidation during rest after an 8-12 week training programme. We also reported decreased glucose oxidation with exogenous lactate infusion during exercise at the same absolute, but not relative, exercise intensity after training. Additionally, during exogenous lactate infusion the percentage of glucose _R_d oxidized decreased during rest pre- and post-training and during exercise at the same absolute intensity post-training. Whether the decreased glucose oxidation was the result of increased lactate oxidation could not be determined in those experiments.
Since lactate is quantitatively the most important gluconeogenic precursor (Kreisberg et al. 1970), the effect of exogenous lactate infusion on glucose production (GP) must also be considered. Lactate infusion in resting humans does not increase GP (Jenssen et al. 1990, 1993; Haesler et al. 1995; Miller et al. 2002). Additionally, we (Miller et al. 2002) demonstrated that GP was unchanged during exercise in humans during lactate infusion. Glucose recycling was unchanged during LC, which led us to believe that gluconeogenesis (GNG) was not substrate limited. Because of concerns regarding glucose recycling and dilution of the precursor pool with lactate infusion, we wished to repeat GNG measurements using a secondary (lactate → glucose) labelling technique (Huie et al. 1996; Bergman et al. 2000).
To explore the effect of lactate infusion on CHO oxidation preference and GP, we repeated our LC procedure on resting and exercising men. Based on our hypothesis that lactate plays a central role in the distribution of CHO potential energy for oxidation and GNG, our predictions were that LC at rest and during exercise would result in: (1) increased oxidation of lactate with a consequent decrease in glucose oxidation, (2) no change in overall GP, but (3) an increased contribution of lactate to glucose production.
Methods
Subjects
Six healthy active male subjects aged 18-35 years were recruited from the University of California, Berkeley campus, by posted notices and email. Three of the subjects were actively training and racing in collegiate cycling while three were moderately active with an extensive history of exercise training. Exercise competent subjects were used so that the capacities for substrate oxidation and GNG would be substantially stressed. Subjects were considered for study if they were non-smoking, not taking medications, healthy by physical examination, weight stable for the last 6 months, under 25 % body fat and had normal lung function as determined by a 1 s forced expiratory volume (FEV1) ≥75 % of vital capacity. Subjects gave written informed consent and the study protocol was approved by the UC-Berkeley Committee for the Protection of Human Subjects (CPHS 2001-8-25), and conformed to the Declaration of Helsinki. These were different subjects infused with a different tracer cocktail than reported previously (Miller et al. 2002).
Preliminary testing
Following screening, subjects performed two progressive exercise tests a minimum of 1 week apart. Trials to determine the peak rate of oxygen consumption (_V̇_O2,peak) were performed on an electrically braked cycle ergometer (Monarch Ergometric 839E). To determine _V̇_O2,peak, subjects pedalled at a self-selected cadence at 100 W. Every 3 min the workload was increased by 25 or 50 W until voluntary cessation. Expired respiratory gases were collected and analysed continuously by a real-time, online PC-based system (Ametek S-3A1 O2 and Ametek CD-3A CO2 analysers). Finally, body composition was assessed by skin-fold measurements as previously reported (Friedlander et al. 1997).
Study design
Following screening, subjects performed an isotope trial at 65 % _V̇_O2,peak (65 %). During this 65 % trial, blood was sampled intermittently to determine the lactate response. Thus, the 65 % trial was always performed first. Following the 65 % trial a series of four trials at 55 % _V̇_O2,peak were performed in random order a minimum of 5 days apart. Two of the 55 % _V̇_O2,peak trials were considered to be control trials (55 %), and two were performed with a sodium lactate-lactic acid mixture (see Lactate clamp procedures) to a target of 4 mm during rest and ‘clamped’ at the lactate level measured during the initial exercise at 65 % _V̇_O2,peak (55 %-LC). Both the 55 % and 55 %-LC trials were performed twice (for more details see Isotope trial protocol). The 55 % and 55 %-LC trials were performed at identical workloads. Following the last isotope trial a _V̇_O2,peak trial was repeated to ensure that trials at the end of the 5 week period were not affected by a change in relative exercise intensity.
Dietary controls
Three-day diet records were collected prior to, midway through and at the completion of the study to ensure consistent dietary habits throughout the experiment. Diet analysis was performed with Nutritionist III software (N-Squared Computing, Salem, OR, USA). Additionally, subjects rested and their diets were standardized the day before an exercise trial. Lunch and dinner were prepared by the laboratory staff and consisted of 2309 kcal (64 % CHO, 23 % fat and 14 % protein). At 21.45 h on the day prior to isotope trials, subjects consumed a standardized snack of 584 kcal (54 % CHO, 30 % fat and 16 % protein). The exact time the subjects finished the evening snack was recorded and exercise commenced 12 h following completion of the evening snack.
Isotope trial
Each subject performed five isotope trials: 65 % with [3-13C]lactate, 55 % with [3-13C]lactate, 55 %-LC with [3-13C]lactate, 55 % with H13CO3− and [6,6-2H2]glucose (i.e. D2-glucose), and 55 %-LC with H13CO3− and D2-glucose. On trial days, subjects reported to the laboratory at 07.30 h. After determination of background CO2 enrichment, a catheter was inserted into a dorsal hand vein that was warmed for collection of an ‘arterialized’ sample as previously described (Friedlander et al. 1997). In the contralateral arm a second catheter was placed in a forearm vein for isotope and unlabelled lactate cocktail-saline infusion. One of the two following tracer protocols was started: (1) a primed continuous infusion of [3-13C]lactate (Cambridge Isotope Laboratories, Woburn, MA, USA), or (2) H13CO3− (Isotech Laboratories, Champaign, IL, USA) and D2-glucose (Cambridge Isotope Laboratories). Isotopes were diluted in 0.9 % sterile saline and were tested for pyrogenicity and sterility (School of Pharmacy, University of California, San Francisco, USA), and passed through a 0.2 μm Millipore filter (Nalgene, Rochester, NY, USA) prior to infusion. Priming boluses were the same across trials and contained 57.5 mg [3-13C]lactate, or 250 mg D2-glucose and 136 mg H13CO3− in their respective trials. During the first 65 and 55 % trials, [3-13C]lactate was continuously infused at 2.5 mg min−1 during rest and 10.0 mg min−1 during exercise. For 55 %-LC, [3-13C]lactate was infused at 10 mg min−1 during rest and 10 mg min−1 during exercise. For the second 55 % and 55 %-LC trials, D2-glucose was infused at 2.0 mg min−1 during rest and 8.0 mg min−1 during exercise, while H13CO3− was infused at 1.7 mg min−1 during rest and 15.3 mg min−1 during exercise. Subjects rested for 90 min and then exercised for 90 min.
Lactate clamp procedures
The LC procedure was performed as previously described (Miller et al. 2002). Infusion cocktail was prepared by mixing a 30 % l(+)-lactic acid solution (Sigma) in 2 n NaOH, to a pH of 4.8. The lactate solutions were tested for pyrogenicity and sterility in the same manner as the isotope solutions. During the resting period lactate infusion began at 104 ml h−1 which delivered lactate at 202.8 mg min−1 and averaged 2.6 mg kg−1 min−1. Resting lactate levels were raised to approximately 4 mm. Lactate infusion rates were increased or decreased to maintain target [lactate] as determined by a portable lactate monitor (Accusport, Sports Resource Group, Hawthorne, NY, USA). During exercise, lactate infusion was adjusted to match lactate levels encountered during the 65 % trial. The infusion schedule for each subject was recorded during their first 55 %-LC trial and was repeated exactly during their second 55 %-LC trial.
Blood sampling and analysis
Blood for metabolite, isotope enrichment and hormonal analyses was sampled at 0, 60, 75 and 90 min of rest and 30, 45, 60, 75 and 90 min of exercise. Additional small aliquots of blood were sampled at 10, 20, 30 and 45 min of rest and 10 and 20 min of exercise for blood [lactate] and haematocrit. Blood samples were immediately chilled on ice, centrifuged at 3000 g for 18 min, and the supernatant collected and frozen at -80 °C until analysis. Blood for lactate and glucose isotope enrichments (IE) and glucose concentration was collected in 8 % perchloric acid. Blood for insulin was collected in a vacutainer containing EDTA while blood for glucagon was collected in a vacutainer containing aprotinin. Haematocrit (Hct) was monitored at each time point by the microhaematocrit technique. Respiratory gases were analysed for the 5 min prior to blood sampling. These gases were used for calculation of _V̇_O2, _V̇_CO2, _V̇_E and RER (_V̇_CO2_V̇_O2−1), and 13CO2 IE from infused [3-13C]lactate or H13CO3−. During respiratory sampling, subjects indicated their rating of perceived exertion (RPE) by pointing to a Borg Scale chart.
Glucose concentrations were measured in duplicate or triplicate using a hexokinase kit (Sigma, St Louis, MO, USA). Plasma lactate concentrations were measured using a lactate sensor with a Nova StatProfile 9+ blood gas-electrolyte analyzer (Nova Biomedical, Waltham, MA, USA). Values were in millimoles per litre of plasma water, and were multiplied by 0.92 in order to obtain units of millimoles per litre of plasma since plasma water is about 0.92 ml ml−1 plasma.
Insulin and glucagon were measured with commercially available radioimmunoassay kits (Coat-A-Count, DPC, Los Angeles, CA, USA).
Isotopic enrichment analyses
Lactate was prepared for gas chromatography-mass spectrometry (GCMS) analysis using the heptafluorobutyric anhydride derivative while the pentaacetate derivative was prepared for glucose. Briefly, the supernatant from samples collected in 8 % perchloric solution was neutralized with 2 n KOH and transferred to exchange columns washed with double deionized water (ddH2O) (cation: AG 1-X8, 50 to 100 mesh H+ resin) and ddH2O and 2 n formic acid (anion: AG1-X8, 100 to 200 mesh formate resin). Glucose was eluted first with ddH2O followed by elution of the anion column with 2 n formic acid for lactate. Samples were then lyophilized. Lactate samples were prepared according to the method of Tserng et al. (1984). Briefly, samples were resuspended in methanol and transferred to a microreaction vial to which 20 μl 10 % HCl in methanol was added. After samples sat at room temperature for 60 min, 50 μl of _N_-propylamine were added and heated at 100 °C for 30 min. The samples were dried under N2 gas, resuspended in 200 μl ethyl acetate, transferred to a GCMS vial and dried under N2 gas. To this 20 μl of heptafluorobutyric anhydride was added and the mixture was left for 5 min. Finally, samples were dried and resuspended in 50 μl ethyl acetate. The pentaacetate derivative for glucose was obtained by resuspending the lyophilized sample in 1 ml of methanol from which 200 μl was transferred to a 2 ml microreaction vial and dried under N2 gas. A volume (100 μl) of a 2:1 acetic anhydride-pyridine solution was added to each vial and heated at 60 °C for 10 min. Samples were again dried under N2 gas, resuspended in 200 μl of ethyl acetate, and transferred to micro vials for analysis.
Lactate and glucose enrichments were measured with a gas chromatography-mass spectrometer (GCMS, GC model 5890, series II and MS model 5989A, Hewlett-Packard, Palo Alto, CA, USA; and GC model 6890 and MS model 5973, Agilent, Palo Alto, CA, USA). Glucose enrichments were measured using methane positive chemical ionization with a DB-17, 30 m column. Injector temperature was set at 200 °C. The oven program started at 110 °C and increased 35 °C min−1 until 225 °C was reached. Analysis was performed with a 35-to-1 ml min−1 spitless injection ratio with helium as the carrier gas. Transfer line temperature was set to 200 °C while source and quadropole temperatures were 200 and 116 °C, respectively. The ions monitored using selected ion monitoring (SIM) were 331.2, 332.2 and 333.2 for M+0, M+1 and M+2 isotopomers, respectively.
Lactate enrichments were measured using methane positive chemical ionization with a HP-50, 30 m column. Injector temperature was set at 250 °C. The oven program started at 80 °C and was held for 3 min at which point it was increased at 35 °C min−1 until 255 °C was reached. Analysis was performed with a total flow of 25 ml min−1 and constant pressure of 19.5 p.s.i. in spitless mode with helium as the carrier gas. The source and quadropole temperatures were 250 and 106 °C, respectively. The ions monitored using SIM were 328.0 and 329.0 for M+0 and M+1, respectively. Breath samples were analysed by use of isotope ratio mass spectrometry (IRMS) by Metabolic Solutions (Acton, Nashua, NH, USA).
Calculations
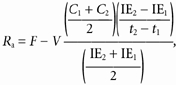
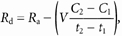
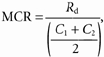
Lactate and glucose turnover (_R_a, rate of appearance and _R_d, rate of disappearance) and metabolic clearance rates (MCR) were calculated from the equations of Steele modified for use with stable isotopes (Wolfe, 1992):
 |
(1) |
|---|
 |
(2) |
|---|
 |
(3) |
|---|
where _R_a and _R_d are measured in mg kg−1 min−1; MCR is measured in ml kg−1 min−1; F represents the isotope infusion rate (mg kg−1 min−1); V is the volume distribution of lactate or glucose and is equal to plasma volume (180 ml kg−1); _C_1 and _C_2 are concentrations at sampling times _t_1 and _t_2; IE1 and IE2 are the excess isotopic enrichments of lactate or glucose. Measured isotopic enrichments were corrected for background of blood samples taken prior to isotope infusion.
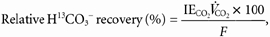
Recovery of H13CO3− as 13CO2 was calculated as:
 |
(4) |
|---|
where IECO2 is the isotopic enrichment of expired 13CO2; _V̇_CO2 is the volume of CO2 expired per minute; and F is the H13CO3− infusion rate.
Lactate rate of oxidation was calculated from expired CO2 and IECO2:
 |
(5) |
|---|
 |
(6) |
|---|
where _R_ox is measured in mg kg−1 min−1; IECO2 is the isotopic enrichment of expired 13CO2; _V̇_CO2 is the volume of CO2 expired per minute; F is the [3-13C]lactate infusion rate; and k is the correction factor for the retention of CO2 in body pools as determined by relative H13CO3− recovery (eqn (4)).
Glucose _R_ox (mg kg−1 min−1) was calculated as:
 |
(7) |
|---|
where k is the percentage of glucose _R_d oxidized (rest, 0.29; rest-LC, 0.21; 55 %, 0.95; 55 %-LC, 0.70) as previously determined (Miller et al. 2002).
Since lactate infusion was not expected to affect lipid oxidation (Chioléro et al. 1993; Ferrannini et al. 1993), overall CHO oxidation was calculated using respiratory values of the appropriate control condition. From overall CHO oxidation, muscle glycogen oxidation (mg kg−1 min−1) was calculated as:
 |
(8) |
|---|
Percentage of glucose _R_a from lactate incorporation into glucose (lactate gluconeogenesis, L → GNG) was calculated as previously described (Huie et al. 1996; Bergman et al. 2000):
 |
(9) |
|---|
where glucose M1 IE is the isotopic enrichment of the M+1 glucose isotopomer; lactate IE is the isotopic enrichment of lactate; and H is the factor to correct for loss of label in the TCA cycle during L → GNG, which was assumed to be 1.45 at rest and 1.0 during exercise (Huie et al. 1996; Bergman et al. 2000).
L → GNG (mg kg−1 min−1) and hepatic glycogenolysis (GLY) (mg kg−1 min−1) were calculated as:
 |
(10) |
|---|
 |
(11) |
|---|
These should be considered minimal and maximal rates of GNG and GLY, respectively, since L → GNG only represents lactate incorporation into glucose and does not represent contributions from other GNG precursors.
Statistics
Data are presented as means ± s.e.m. Metabolite and respiratory parameters were not significantly different between the repeated trials (two trials at 55 % and two trials at 55 %-LC), so values were averaged and represent a constant n of 6. Metabolite concentration and kinetic values were calculated as the average of the last 15 min of rest and the last 30 min of exercise. Significance was determined using Student's paired t tests with Bonferroni adjustment for repeated measures. Significance of changes over time was determined by a full factorial two-way ANOVA with the LSD adjustment. Statistical analyses were performed on SPSS 10.0 Graduate Pack (SPSS Inc., Chicago, IL, USA) and significance was set at P ≤ 0.05.
Results
Subject characteristics and dietary control
Subjects were weight stable over the course of the 5 week study (Table 1). Total energy and macronutrient composition of the subjects’ diets did not change. Additionally, fitness level did not change as assessed by _V̇_O2,peak (Table 1).
Table 1.
Subject characteristics
| Variable | Beginning | End |
|---|---|---|
| Age (years) | 26 ± 2 | — |
| Height (cm) | 182 ± 2 | — |
| Weight (kg) | 82.0 ± 2.0 | 81.5 ± 3.0 |
| Body fat (%) | 12.7 ± 2.6 | 12.1 ± 2.6 |
| _V̇_O2,peak (l min−1) | 4.1 ± 0.1 | 4.0 ± 0.1 |
| _V̇_O2,peak (ml kg−1 min−1) | 50.7 ± 2.1 | 49.9 ± 2.8 |
| FEV1/FVC | 80 ± 4 | — |
| Diet | ||
| Energy (kcal) | 2542 | 2557 |
| CHO (%) | 51 | 56 |
| Fat (%) | 29 | 28 |
| Protein (%) | 17 | 16 |
Work, cardiorespiratory and metabolite variables
Power outputs of 181 and 151 W corresponded to 65 and 55 % _V̇_O2,peak, respectively (Table 2). During rest-LC, _V̇_O2was significantly elevated over rest (Table 2). Additionally, _V̇_O2at 65 % was significantly greater than 55 % and 55 %-LC with no difference between 55 % and 55 %-LC. There was not a difference in _V̇_CO2 with LC during rest or exercise. However, RER was significantly decreased with LC during rest and exercise. Heart rate (HR) was increased with lactate infusion during rest but unchanged with LC during exercise. Haematocrit was significantly decreased with LC during rest and exercise compared to trials without LC. Borg Scale rating of perceived exertion was significantly decreased from 65 % during 55 % and 55 %-LC, but was not affected by LC during exercise. Finally, there were no changes in [insulin], [glucagon] or the [insulin]/ [glucagon] (I/G) ratio during rest and exercise due to LC procedure.
Table 2.
Workload, lactate infusion rate, cardiorespiratory parameters and metabolic concentrations
| Variable | Rest | Rest-LC | 65% | 55% | 55%-LC |
|---|---|---|---|---|---|
| Workload (W) | — | — | 181 ± 7 | 151 ± 6† | 151 ± 6† |
| Lactate infusion rate (mg kg−1 min−1) | — | −2.98 ± 0.13 | — | — | 2.76 ± 0.22 |
| _V̇_O2(l min−1) | 0.27 ± 0.01 | 0.30 ± 0.01‡ | 2.72 ± 0.09* | 2.32 ± 0.07*† | 2.34 ± 0.06*† |
| _V̇_CO2 (l min−1) | 0.24 ± 0.01 | 0.23 ± 0.01 | 2.47 ± 0.08* | 2.07 ± 0.06*† | 2.01 ± 0.05*† |
| RER | 0.85 ± 0.01 | 0.75 ± 0.01‡ | 0.91 ± 0.01* | 0.89 ± 0.01* | 0.86 ± 0.01*†‡ |
| _V_E (l min−1) | 7.40 ± 0.40 | 7.40 ± 0.40 | 60.30 ± 1.70* | 48.80 ± 1.40*† | 45.30 ± 1.50*† |
| H13CO3− recovery (%) | 069.8 ± 1.8 | 66.7 ± 2.50 | — | −77.2 ± 1.2 | −82.4 ± 0.9 |
| HR (beats min−1) | 59.0 ± 3.0 | 67.0 ± 3.0‡ | 159.0 ± 4.0* | 143.0 ± 3.0*† | 142.0 ± 2.0*† |
| MAP (mmHg) | 89.6 ± 1.2 | 88.0 ± 1.3 | 99.2 ± 1.1* | 94.0 ± 1.6 | 90.1 ± 1.5 |
| Hct (%) | 45.5 ± 1.0 | 42.5 ± 0.5‡ | 48.0 ± 0.5* | 48.0 ± 0.5* | 43.0 ± 0.5†‡ |
| RPE | — | — | 14.0 ± 1.0 | 12.0 ± 1.0† | 12.0 ± 1.0† |
| Insulin (pg ml−1) | 216.0 ± 47.0 | 168.0 ± 21.0 | 89.5 ± 6.0 | 122.0 ± 12.0 | 141.0 ± 14.0 |
| Glucagon (pg ml−1) | 60.4 ± 4.7 | 46.6 ± 2.2 | 78.9 ± 12.1 | 70.3 ± 7.7 | 57.9 ± 4.2 |
| I/G ratio | 3.8 ± 0.8 | 3.8 ± 0.6 | 1.33 ± 0.2 | 1.99 ± 0.3 | 2.75 ± 0.4 |
Lactate and glucose concentrations
Exogenous lactate infusion rates averaged 2.98 and 2.76 mg kg−1 min−1 during rest and exercise, respectively (Table 2). Blood [lactate] was significantly elevated (≥ 4 mm) during rest-LC compared to rest (≈1 mm) (Fig. 1_A_). Additionally, 55 %-LC [lactate] was not significantly different from 65 % [lactate] at any time. Both 65 % and 55 %-LC [lactate] were significantly elevated above 55 %, and decreased over time until not significantly different from 55 % at 90 min exercise. Glucose concentrations were not significantly different at any time between trials (Fig. 1_B_).
Figure 1. Concentrations of blood lactate (A) and glucose (B) over time in response to exogenous lactate infusion (LC) and corresponding non-infusion control trials during rest and exercise.
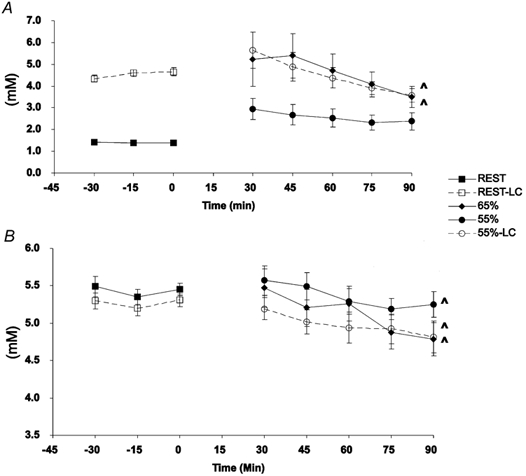
Values are means ± s.e.m.; n = 6. Squares, rest; diamonds, 65 % _V̇_O2,peak; circles, 55 % _V̇_O2,peak; filled symbols, control; open symbols, lactate clamp. ∧ Significantly different over time of exercise (P < 0.05).
Lactate and glucose kinetics
Isotopic enrichments for lactate M+1, glucose M+1, glucose M+2 and HCO3− M+1 are presented over time in Fig. 2. Enrichments for all tracers were stable over time but subject to intensity and infusion rate variability between trials.
Figure 2. Isotopic enrichment (IE) of M+1 lactate (A), M+1 glucose (B), M+2 glucose (C) and M+1 HCO3− (D) in response to exogenous lactate infusion (LC) and corresponding non-infusion control trials during rest and exercise.
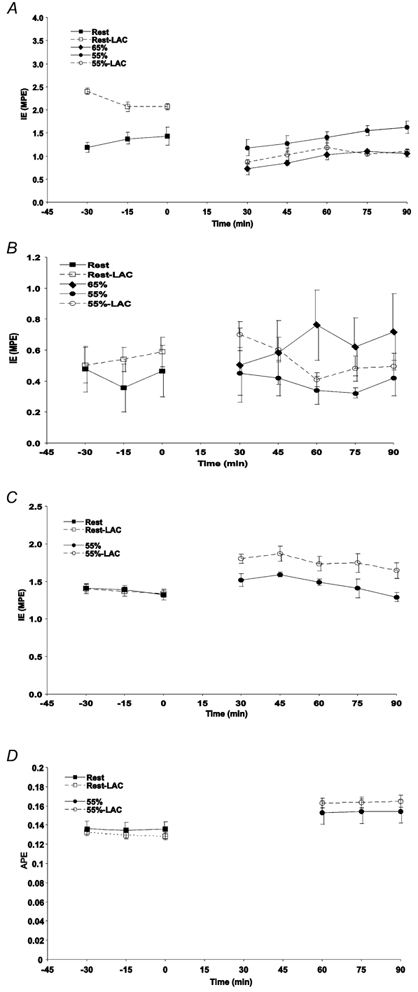
Values are means ± s.e.m.; n = 6. Squares, rest; diamonds, 65 % _V̇_O2,peak; circles, 55 % _V̇_O2,peak; filled symbols, control; open symbols, lactate clamp.
Lactate _R_a and _R_d were significantly increased during rest with LC (Fig. 3_A_ and B). During exercise lactate _R_a and _R_d were significantly increased at 65 % (11.82 ± 0.72 and 12.46 ± 0.89 mg kg−1 min−1) and 55 %-LC (11.37 ± 0.78 and 11.79 ± 0.77 mg kg−1 min−1) compared to 55 % (8.55 ± 0.68 and 8.65 ± 0.69 mg kg−1 min−1). Additionally, lactate kinetics were not different between 65 % and 55 %-LC. Endogenous lactate _R_a with LC was not different from control lactate _R_a (rest: 2.54 ± 0.33 and rest-LC: 2.78 ± 0.26 mg kg−1 min−1) (Fig. 3_A_). Lactate MCR was significantly increased over rest in the 55 % and 55 %-LC conditions (Fig. 3_C_). There were no differences in lactate MCR between control and LC trials. Glucose _R_a and _R_d increased from rest to exercise (Fig. 3_A_ and B). Additionally, glucose _R_a and _R_d were significantly decreased during 55 %-LC as compared to 55 % (Fig. 3_A_ and B). Finally, glucose MCR increased from rest to exercise in both conditions (Fig. 3_C_), but was not different between control and LC trials.
Figure 3. Lactate and glucose rates of appearance (_R_a; A), disappearance (_R_d; B) and metabolic clearance rate (MCR; C), in response to exogenous lactate infusion (LC) and corresponding non-infusion control trials during rest and exercise.

Values are means ± s.e.m.; n = 6. Filled bars, endogenous lactate; hatched bars, exogenous lactate; open bars, glucose. # Significantly different from corresponding control (P < 0.05); + significantly different from rest (P < 0.05); * significantly different from 65 % (P < 0.05). Note in A, exogenous lactate infusion and endogenous lactate _R_a are additive.
Carbohydrate oxidation
Lactate _R_ox was not different between trials during rest (Rest: 0.34 ± 0.05 and Rest-LC: 0.43 ± 0.02 mg kg−1 min−1) (Fig. 4_A_) and was significantly increased during exercise (65 %: 7.87 ± 0.59; 55 %: 6.52 ± 0.65; 55 %-LC: 10.01 ± 0.68 mg kg−1 min−1) compared to rest in all exercise conditions. Lactate _R_ox was not significantly different between 65 and 55 %. However, 55 %-LC lactate _R_ox was significantly greater than 55 %. Glucose _R_ox was not different in resting conditions due to LC (Fig. 4_A_). Again there was an increase in glucose _R_ox from rest to exercise. However, glucose _R_ox was significantly decreased in 55 %-LC (4.35 ± 0.31 mg kg−1 min−1) as compared to 55 % (7.64 ± 0.4 mg kg−1 min−1). Calculated rates of muscle glycogen oxidation increased from rest to exercise but did not differ between 55 % and 55 %-LC (Fig. 4_A_).
Figure 4. Partitioning of total carbohydrate oxidation (glucose, lactate and muscle glycogen) in absolute (_R_ox; A) and relative (percentage of total; B) terms.
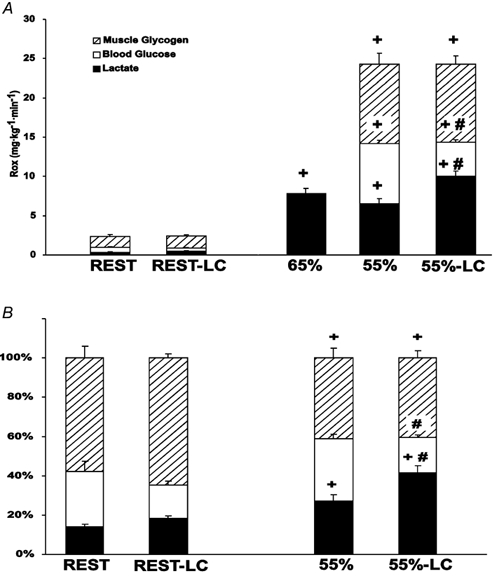
Values are means ± s.e.m.; n = 6. Hatched bars, calculated muscle glycogen oxidation; open bars, tracer-determined glucose oxidation; filled bars, tracer-determined lactate oxidation; LC, lactate clamp. # Significantly different from corresponding control (non-LC) (P < 0.05); + significantly different from rest (P < 0.05).
Expressed as a percentage of CHO oxidation, the contribution of lactate oxidation increased from rest to exercise in both LC and non-LC conditions (Fig. 4_B_). Additionally, the percentage of lactate to overall CHO oxidation increased with LC during exercise (55 %: 27 % and 55 %-LC: 42 %). Contribution of glucose to total CHO oxidation on a percentage basis did not change from rest to exercise (Fig. 4_B_). Additionally, the increased percentage of lactate oxidation with LC was matched by a decreased percentage of glucose oxidation (55 %: 32 % and 55 %-LC: 18 %). Finally, calculated muscle glycogen oxidation decreased as a percentage of total CHO oxidation from rest to exercise and did not differ between 55 % and 55 %-LC (Fig. 4_B_).
Gluconeogenesis and hepatic glycogenolysis
Absolute rates of L → GNG and GLY were not different between resting conditions (Fig. 5_A_). Lactate gluconeogenesis was significantly increased from Rest-LC to 55 %-LC. The difference between 55 % and 55 %-LC approached but did not reach significance (55 %: 1.84 ± 0.41; and 55 %-LC: 2.63 ± 0.38 mg kg−1 min−1). Absolute GLY increased from rest to exercise and was significantly decreased in 55 %-LC as compared to 55 %. As a relative percentage of GP, L → GNG was not different in resting conditions or between rest and exercise (Fig. 5_B_). However, during 55 %-LC, percentage glucose _R_a from L → GNG was significantly increased (55 %: 24 %; and 55 %-LC: 43 %) while percentage _R_a from GLY was significantly decreased as compared to 55 % (55 %: 76 %; and 55 %-LC: 57 %).
Figure 5. Partitioning of total (hepatic plus renal) glucose production (GP) in absolute (A) and relative (B) terms during rest and exercise.
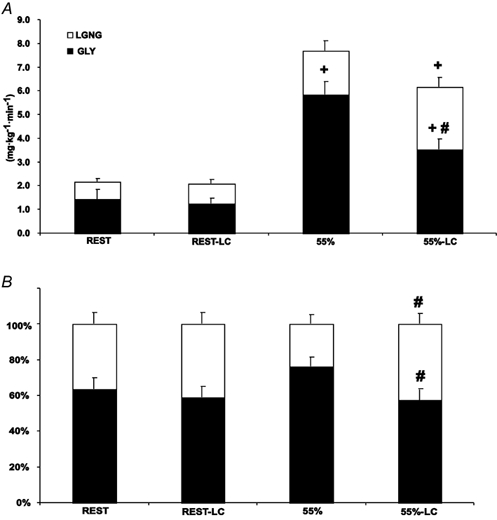
Values are means ± s.e.m.; n = 6. Open bars, lactate incorporation into glucose (L → GNG); filled bars, calculated glycogenolysis (GLY); LC, lactate clamp. # Significantly different from corresponding control (non-LC) (P < 0.05); + significantly different from rest (P < 0.05).
Discussion
We explored the roles of lactate as an oxidative substrate and gluconeogenic precursor by elevating circulating levels during rest and exercise by the LC method. Our key findings during LC are that: (1) during moderate intensity exercise increased lactate _R_d coincided with decreased glucose _R_a and _R_d, (2) during moderate intensity exercise there was a marked increase in lactate oxidation with a concomitant decrease in blood glucose oxidation on both absolute and relative bases, (3) during moderate intensity exercise the calculated liver glycogenolysis decreased on an absolute and relative basis while L → GNG increased on a relative basis, and (4) during rest and moderate intensity exercise there was no suppression of endogenous lactate production.
Lactate clamp
Our LC protocol repeated a variable infusion procedure established by us (Miller et al. 2002). We were successful at varying and maintaining elevated blood [lactate] during periods of rest and exercise (Fig. 1_A_). Blood [lactate] during rest was slightly greater than 4 mm while blood [lactate] during exercise matched the concentrations seen during a 65 % _V̇_O2,peak exercise trial. Thus, we created conditions in which blood [lactate] exceeded that due to metabolic production alone. Therefore, we were able to explore lactate-glucose interactions with independent control over exercise intensity and blood [lactate].
Cardiorespiratory parameters
The increased oxygen consumption at rest in LC, compared to resting control, significantly decreased resting RER (Table 2). During exercise in LC, combined (non-significant) changes in _V̇_CO2 and _V̇_O2 resulted in a significant decrease in RER, compared to control exercise. We (Miller et al. 2002) and others (Ryan et al. 1979; Chioléro et al. 1993, 1996; Ferrannini et al. 1993; Tappy et al. 1996) have previously shown that RER decreases during rest with sodium lactate infusion. The introduction of Na+ with lactate increases the extracellular compartment NaHCO3 content and thus the body HCO3− pool (Gladden & Yates, 1983). It has also been demonstrated that lactate infusion may increase oxygen consumption, termed by some as the thermic effect of lactate (Chioléro et al. 1993). Thus, LC resulted in the expansion of the HCO3− pool (i.e. increased CO2 storage) concomitant with a decrease in pulmonary CO2 elimination. Combined with an increase in oxygen consumption during LC, the result was a decrease in RER. Because the bulk of the decrease in RER was due to increased CO2 retention, the altered RER is not supportive of changes in oxidation and is at least partially due to the acid-base disturbance (authors’ unpublished observations).
During trials with H13CO3−, enrichment of respiratory 13CO2 over time was steady for the last 30 min of rest and exercise (Fig. 2_D_). Additionally, recovery of H13CO3− as 13CO2 was not different between control and LC trials during rest and exercise (Table 2). Therefore every subject had his own derived correction factor for the retention of 13CO2 so that tracer-calculated lactate oxidation was not affected by any changes in HCO3− pool size.
Mean arterial pressure did not change during rest or exercise despite an increased resting HR (Table 2). Additionally, the decrease in Hct with LC during rest and exercise was due to the dilution of the plasma compartment by the infusion protocol. Changes in MAP, HR and Hct agree with our previous report (Miller et al. 2002). Finally, confirming our previous result (Miller et al. 2002), LC did not affect RPE during exercise. It is suggested that the lactate anion, in and of itself, may not contribute to pain or fatigue at moderate work intensities.
Lactate and glucose oxidation
During the resting condition the major part of oxidation is due to the oxidation of lipids (Brooks & Mercier, 1994). Thus, changes in CHO oxidation represent a small portion of total energy expenditure. Accordingly, during the resting period there were negligible changes in lactate and glucose oxidation rates due to LC (Fig. 4_A_). However, during moderate and greater intensity exercise, progressively more muscle with a greater percentage of Type II fibres are recruited and thus substrate-specific changes in CHO oxidation become pronounced. At 55 %-LC the significant decrease in glucose _R_ox was matched by an increase in lactate _R_ox while calculated glycogen _R_ox did not change (Fig. 4_A_ and B), implying that metabolic signals for glycogen phosphorylase were not affected by the lactate anion. The interpretation supported by Fig. 4_B_ is that LC resulted in a sparing of liver glycogen, but not muscle glycogen. A significant increase in the percentage oxidation from lactate coincided with a significant decrease in the percentage oxidation of blood glucose, and no change in the calculated percentage from muscle glycogen. A similarly decreased glucose _R_ox during lactate infusion when subjects exercised at the same absolute intensity (approximately 55 % _V̇_O2,peak) was attributed to lactate suppression of glucose oxidation (Miller et al. 2002) and this is confirmed in the present study. We therefore conclude that during moderate intensity exercise lactate competes with blood-borne glucose as a metabolic substrate. This is consistent with results obtained with rats (Pearce & Connett, 1980; Vettor et al. 1997; Lombardi et al. 1999) and human heart (Gertz et al. 1988; Kemppainen et al. 2002) in which elevated lactate decreases glucose uptake and oxidation. In the aggregate, these results are interpreted to mean that during times of increased CHO demand, such as exercise, lactate can spare blood glucose for tissues such as the brain, and that lactate is a valuable oxidative substrate, not just a means of shuttling CHO equivalents.
Lactate incorporation into glucose
It should be noted that total (liver plus renal) GP was measured in the present study, and therefore hepatic GLY was consistently overestimated by a small amount. In our previous study (Miller et al. 2002) we used glucose recycling as a measure of GNG and found no difference in recycling with LC. However, we were unsure whether the recycling of glucose label accurately reflected GNG. In the present study we estimated GNG using lactate tracer incorporation into glucose. When expressed as a percentage of glucose _R_a, LC resulted in an increase in L → GNG and a decrease in calculated GLY during exercise at 55 % _V̇_O2,peak (Fig. 5_B_). However, when expressed as an absolute rate (Fig. 5_A_), there was not an increase in L → GNG although there was still a significant decrease in GLY. These results should be considered as minimal and maximal rates of GNG and GLY, respectively (vide supra). These data agree with previous studies utilizing lactate infusion during rest (Jenssen et al. 1990, 1993). It is also interesting to note that during resting conditions of the present report and the report of Jenssen et al. (1990) not all lactate tracer can be accounted for by oxidation and L → GNG. They speculated that this was due to lactate incorporation into glycogen. Our report supports this conclusion because during exercise unaccounted lactate tracer decreased to zero. Therefore, there was significant glycogen sparing during rest and exercise with LC and possible glycogen cycling during rest.
Lactate and glucose kinetics
During rest and exercise, exogenous lactate infusion increased lactate _R_a by an amount equal to exogenous lactate infusion rate. Therefore, it appears that the lactate loads we infused during rest and exercise were insufficient to affect endogenous lactate production. That there was no apparent suppression of endogenous _R_a by LC is inconsistent with previous findings in resting humans (Searle et al. 1989). However, our findings agree with those in another report in resting humans (Jenssen et al. 1993) and extend findings of non-suppression of endogenous lactate production by exogenous lactate infusion to include exercise as well.
It has been demonstrated that increasing the GNG precursor supply by infusing lactate (Haesler et al. 1995), alanine (Wolfe et al. 1987; Jahoor et al. 1990) or glycerol (Jahoor et al. 1990; Trimmer et al. 2001) does not change GP during resting conditions. Additionally, increased provision of glycerol (Trimmer et al. 2001) during exercise did not increase GP. Recently we demonstrated that glucose _R_a was not affected during absolute and relative exercise intensities when blood [lactate] was clamped at levels equivalent to a pre-training 65 % _V̇_O2,peak exercise trial (Miller et al. 2002). In aggregate, these results suggest that GNG was not substrate limited under the conditions studied.
Our present attempts to manipulate GP by increasing GNG precursor supply by exogenous lactate infusion are different in some respects from our previous effort in which glycerol was infused (Trimmer et al. 2001). In addition to being the main physiological GNG precursor, lactate is oxidized in working muscle while net uptake of glycerol is small (Bergman et al. 1999_a_). Additionally, glycerol enters the GNG pathway higher, at the triphosphate pool, whereas lactate enters lower, at pyruvate. Therefore, exogenous lactate infusion increased CHO availability to the muscle, spared blood glucose, and consequently suppressed glucose _R_d and _R_a by counter-regulation. Jenssen et al. (1993) previously reported decreased glucose _R_a during rest with an exogenous lactate infusion. They speculated that methodological considerations caused a decrease in glucose _R_a. However, they did not report lactate or glucose _R_ox, and, therefore, did not anticipate decreased glucose demand due to increased lactate supply.
Finally, the difference in glucose kinetics between the present study and our previous study (Miller et al. 2002) could be due to the degree of lactate inhibition of glucose _R_ox. In our first report at workloads that approximated 55 % _V̇_O2,peak after training, there was a decreased glucose _R_ox of 1.18 mg kg−1 min−1 due to LC. In the present study LC led to a decrease in glucose _R_ox of 3.82 mg kg−1 min−1. The present subject cohort included participants who had been actively training for years, and not merely 10 weeks as in our previous report (Miller et al. 2002). Therefore, the increased capacity to oxidize lactate with training (Donovan & Brooks, 1983; Bergman et al. 1999_b_) could explain the decreased glucose oxidation and glucose _R_d.
To summarize the effect of LC on GNG, our results are consistent with those of others (Wolfe et al. 1987; Jahoor et al. 1990; Haesler et al. 1995; Trimmer et al. 2001), indicating that GNG is not substrate limited during 90 min of moderate intensity exercise as there was no change in absolute rates of L → GNG at rest and during moderate intensity exercise with lactate infusion. However, the percentage of GP from GNG increased because the overall glucose demand decreased due to glucose sparing at the muscle.
Metabolic effects of alkalosis
Concerns over our LC procedures may arise because of effects on blood pH and metabolites. As mentioned above, it has been reported that sodium lactate infusion has an associated alkalosis, which may affect metabolic flux rates and oxidation. However, based on an analysis of the physicochemical effects of sodium lactate infusion on acid-base balance (authors’ unpublished observations) we do not believe that alkalosis had an effect on the currently measured variables. Plasma hydrogen concentration ([H+]) did not change during control or LC trials. During LC, unchanged [H+] was mainly due to a respiratory compensation with a concomitant increase in [HCO3−] due to the influence of increased strong ion differential and _P_CO2. Therefore, mild alkalosis resulting from sodium lactate infusion was compensated by respiratory adjustments, resulting in increased plasma [HCO3−] with no change in [H+].
In previous studies utilizing a sodium lactate infusion in humans, neither we (Miller et al. 2002) nor others have observed changes in free fatty acid (Chioléro et al. 1993; Ferrannini et al. 1993) or glycerol concentrations (Jenssen et al. 1990; Ferrannini et al. 1993). Moreover, sodium lactate infusion did not affect whole body lipid oxidation (Chioléro et al. 1993; Ferrannini et al. 1993). Additionally, reports comparing sodium lactate to NaHCO3− infusion demonstrated increased lactate _R_a, _R_d, _R_ox and lactate conversion to glucose with sodium lactate but not NaHCO3− (Jenssen et al. 1990). Finally, a recent report utilizing a NaHCO3−-induced metabolic alkalosis at an exercise intensity similar to the present study reported unchanged plasma free fatty acid and glycerol concentrations, and unchanged exercising leg blood flow, RQ (respiratory quotient) and glucose flux (Hollidge-Horvat et al. 2000). Therefore, we are reasonably confident that our results of LC on substrate selection were independent of decreased hydrogen ion concentration.
Summary and conclusions
We repeated the lactate clamp procedure to explore facets of the Lactate Shuttle Hypothesis. During moderate intensity exercise with lactate appearance and concentration in excess of endogenous production, there was an increase in lactate oxidation and a concomitant decrease in glucose oxidation. Decreased glucose oxidation by exercising muscle resulted in a decreased demand for blood glucose and consequently decreased glucose production to maintain blood glucose homeostasis. With exogenous lactate infusion, lactate incorporation into glucose increased and the contribution of glycogenolysis to glucose production decreased. Finally, lactate infusion into exercising men was not associated with an increase in the sensation of fatigue. Results are consistent with the concept that lactate is a useful carbohydrate source that can spare blood glucose and liver glycogen in times of increased energy demand.
Acknowledgments
We would like to thank the subjects who devoted their time and effort to the study. Additionally, we would like to thank Calvin Kuo, Erin Yarde and Kelly Galvin for their laboratory assistance. This work was supported by NIH grant AR-42906.
References
- Bergman BC, Butterfield GE, Wolfel EE, Casazza GA, Lopaschuk GD, Brooks GA. Evaluation of exercise and training on muscle lipid metabolism. American Journal of Physiology. 1999a;276:E106–117. doi: 10.1152/ajpendo.1999.276.1.E106. [DOI] [PubMed] [Google Scholar]
- Bergman BC, Horning MA, Casazza GA, Wolfel EE, Butterfield GE, Brooks GA. Endurance training increases gluconeogenesis during rest and exercise in men. American Journal of Physiology - Endocrinology and Metabolism. 2000;278:E244–251. doi: 10.1152/ajpendo.2000.278.2.E244. [DOI] [PubMed] [Google Scholar]
- Bergman BC, Wolfel EE, Butterfield GE, Lopaschuk GD, Casazza GA, Horning MA, Brooks GA. Active muscle and whole body lactate kinetics after endurance training in men. Journal of Applied Physiology. 1999b;87:1684–1696. doi: 10.1152/jappl.1999.87.5.1684. [DOI] [PubMed] [Google Scholar]
- Brooks GA. Glycolytic end product and oxidative substrate during sustained exercise in mammals - The ‘lactate shuttle’. In: Gilles R, editor. Circulation, Respiration, and Metabolism: Current Comparative Approaches. Berlin: Springer-Verlag; 1985. pp. 208–218. [Google Scholar]
- Brooks GA. Current concepts in lactate exchange. Medicine and Science in Sports and Exercise. 1991;23:895–906. [PubMed] [Google Scholar]
- Brooks GA. Mammalian fuel utilization during sustained exercise. Comparative Biochemistry and Physiology B. 1998;120:89–107. doi: 10.1016/s0305-0491(98)00025-x. [DOI] [PubMed] [Google Scholar]
- Brooks GA, Mercier J. Balance of carbohydrate and lipid utilization during exercise: the ‘crossover’ concept. Journal of Applied Physiology. 1994;76:2253–2261. doi: 10.1152/jappl.1994.76.6.2253. [DOI] [PubMed] [Google Scholar]
- Chioléro R, Mavrocordatos P, Burnier P, Cayeux MC, Schindler C, Jéquier E, Tappy L. Effects of infused sodium acetate, sodium lactate, and sodium beta-hydroxybutyrate on energy expenditure and substrate oxidation rates in lean humans. American Journal of Clinical Nutrition. 1993;58:608–613. doi: 10.1093/ajcn/58.5.608. [DOI] [PubMed] [Google Scholar]
- Chioléro R, Schneiter P, Cayeux C, Temler E, Jéquier E, Schindler C, Tappy L. Metabolic and respiratory effects of sodium lactate during short i. v. nutrition in critically ill patients. Journal of Parenteral and Enteral Nutrition. 1996;20:257–263. doi: 10.1177/0148607196020004257. [DOI] [PubMed] [Google Scholar]
- Donovan CM, Brooks GA. Endurance training affects lactate clearance, not lactate production. American Journal of Physiology. 1983;244:E83–92. doi: 10.1152/ajpendo.1983.244.1.E83. [DOI] [PubMed] [Google Scholar]
- Ferrannini E, Natali A, Brandi LS, Bonadonna R, De Kreutzemberg SV, DelPrato S, Santoro D. Metabolic and thermogenic effects of lactate infusion in humans. American Journal of Physiology. 1993;265:E504–512. doi: 10.1152/ajpendo.1993.265.3.E504. [DOI] [PubMed] [Google Scholar]
- Friedlander A, Casazza G, Horning M, Huie M, Brooks G. Training-induced alterations of glucose flux in men. Journal of Applied Physiology. 1997;82:1360–1369. doi: 10.1152/jappl.1997.82.4.1360. [DOI] [PubMed] [Google Scholar]
- Gertz EW, Wisneski JA, Stanley WC, Neese RA. Myocardial substrate utilization during exercise in humans. Dual carbon-labeled carbohydrate isotope experiments. Journal of Clinical Investigation. 1988;82:2017–2025. doi: 10.1172/JCI113822. [DOI] [PMC free article] [PubMed] [Google Scholar]
- Gladden LB, Yates JW. Lactic acid infusion in dogs: effects of varying infusate pH. Journal of Applied Physiology. 1983;54:1254–1260. doi: 10.1152/jappl.1983.54.5.1254. [DOI] [PubMed] [Google Scholar]
- Haesler E, Schneiter P, Temler E, Jéquier E, Tappy L. Effects of lactate infusion on hepatic gluconeogenesis and glycogenolysis. Clinical Physiology. 1995;15:581–595. doi: 10.1111/j.1475-097x.1995.tb00546.x. [DOI] [PubMed] [Google Scholar]
- Hollidge-Horvat MG, Parolin ML, Wong D, Jones NL, Heigenhauser GJ. Effect of induced metabolic alkalosis on human skeletal muscle metabolism during exercise. American Journal of Physiology - Endocrinology and Metabolism. 2000;278:E316–329. doi: 10.1152/ajpendo.2000.278.2.E316. [DOI] [PubMed] [Google Scholar]
- Huie MJ, Casazza GA, Horning MA, Brooks GA. Smoking increases conversion of lactate to glucose during submaximal exercise. Journal of Applied Physiology. 1996;80:1554–1559. doi: 10.1152/jappl.1996.80.5.1554. [DOI] [PubMed] [Google Scholar]
- Jahoor F, Peters EJ, Wolfe RR. The relationship between gluconeogenic substrate supply and glucose production in humans. American Journal of Physiology. 1990;258:E288–296. doi: 10.1152/ajpendo.1990.258.2.E288. [DOI] [PubMed] [Google Scholar]
- Jenssen T, Nurjhan N, Consoli A, Gerich JE. Failure of substrate-induced gluconeogenesis to increase overall glucose appearance in normal humans. Demonstration of hepatic autoregulation without a change in plasma glucose concentration. Journal of Clinical Investigation. 1990;86:489–497. doi: 10.1172/JCI114735. [DOI] [PMC free article] [PubMed] [Google Scholar]
- Jenssen T, Nurjhan N, Consoli A, Gerich JE. Dose-response effects of lactate infusions on gluconeogenesis from lactate in normal man. European Journal of Clinical Investigation. 1993;23:448–454. doi: 10.1111/j.1365-2362.1993.tb00789.x. [DOI] [PubMed] [Google Scholar]
- Kemppainen J, Fujimoto T, Kalliokoski KK, Viljanen T, Nuutila P, Knuuti J. Myocardial and skeletal muscle glucose uptake during exercise in humans. Journal of Physiology. 2002;542:403–412. doi: 10.1113/jphysiol.2002.018135. [DOI] [PMC free article] [PubMed] [Google Scholar]
- Kreisberg RA, Pennington LF, Boshell BR. Lactate turnover and gluconeogenesis in normal and obese humans. Effect of starvation. Diabetes. 1970;19:53–63. doi: 10.2337/diab.19.1.53. [DOI] [PubMed] [Google Scholar]
- Lombardi AM, Fabris R, Bassetto F, Serra R, Leturque A, Federspil G, Girard J, Vettor R. Hyperlactatemia reduces muscle glucose uptake and GLUT-4 mRNA while increasing (E1alpha)PDH gene expression in rat. American Journal of Physiology. 1999;276:E922–929. doi: 10.1152/ajpendo.1999.276.5.E922. [DOI] [PubMed] [Google Scholar]
- Miller BF, Fattor JA, Jacobs KA, Horning MA, Suh SH, Navazio F, Brooks GA. Metabolic and cardiorespiratory responses to lactate infusion during rest and exercise: ‘The Lactate Clamp’. American Journal of Physiology- Endocrinology and Metabolism. 2002;283:E889–898. doi: 10.1152/ajpendo.00266.2002. [DOI] [PubMed] [Google Scholar]
- Pagano C, Granzotto M, Giaccari A, Fabris R, Serra R, Lombardi AM, Federspil G, Vettor R. Lactate infusion to normal rats during hyperglycemia enhances in vivo muscle glycogen synthesis. American Journal of Physiology. 1997;273:R2072–2079. doi: 10.1152/ajpregu.1997.273.6.R2072. [DOI] [PubMed] [Google Scholar]
- Pearce FJ, Connett RJ. Effect of lactate and palmitate on substrate utilization of isolated rat soleus. American Journal of Physiology. 1980;238:C149–159. doi: 10.1152/ajpcell.1980.238.5.C149. [DOI] [PubMed] [Google Scholar]
- Ryan WJ, Sutton JR, Toews CJ, Jones NL. Metabolism of infused l(+)-lactate during exercise. Clinical Science. 1979;56:139–146. doi: 10.1042/cs0560139. [DOI] [PubMed] [Google Scholar]
- Searle GL, Feingold KR, Hsu FS, Clark OH, Gertz EW, Stanley WC. Inhibition of endogenous lactate turnover with lactate infusion in humans. Metabolism: Clinical and Experimental. 1989;38:1120–1123. doi: 10.1016/0026-0495(89)90050-4. [DOI] [PubMed] [Google Scholar]
- Tappy L, Cayeux MC, Chioléro R. Effects of sodium lactate on ventilation and acid-base balance in healthy humans. Clinical Physiology. 1996;16:393–401. doi: 10.1111/j.1475-097x.1996.tb00728.x. [DOI] [PubMed] [Google Scholar]
- Trimmer JK, Casazza GA, Horning MA, Brooks GA. Autoregulation of glucose production in men with a glycerol load during rest and exercise. American Journal of Physiology - Endocrinology and Metabolism. 2001;280:E657–668. doi: 10.1152/ajpendo.2001.280.4.E657. [DOI] [PubMed] [Google Scholar]
- Tserng KY, Gilfillan CA, Kalhan SC. Determination of carbon-13 labeled lactate in blood by gas chromatography/mass spectrometry. Analytical Chemistry. 1984;56:517–523. doi: 10.1021/ac00267a049. [DOI] [PubMed] [Google Scholar]
- Vettor R, Lombardi AM, Fabris R, Pagano C, Cusin I, Rohner-Jeanrenaud F, Federspil G, Jeanrenaud B. Lactate infusion in anesthetized rats produces insulin resistance in heart and skeletal muscles. Metabolism. 1997;46:684–690. doi: 10.1016/s0026-0495(97)90014-7. [DOI] [PubMed] [Google Scholar]
- Wolfe RR. Radioactive and Stable Isotope Tracers in Biomedicine: Principles and Practice of Kinetic Analysis. New York: Wiley-Liss; 1992. [Google Scholar]
- Wolfe RR, Jahoor F, Shaw JH. Effect of alanine infusion on glucose and urea production in man. Journal of Parenteral and Enteral Nutrition. 1987;11:109–111. doi: 10.1177/0148607187011002109. [DOI] [PubMed] [Google Scholar]