Kinetics of Steady-state Differentiation and Mapping of Intrathymic-signaling Environments by Stem Cell Transplantation in Nonirradiated Mice (original) (raw)
Abstract
Upon thymus entry, thymic-homing progenitors undergo distinct phases of differentiation as they migrate through the cortex to the capsule, suggesting that the signals that induce these differentiation steps may be stratified in corresponding cortical regions. To better define these regions, we transplanted purified stem cells into nonirradiated congenic recipients and followed their differentiation with respect to both tissue location and time. The earliest progenitors (DN1) remained confined to a very narrow region of the cortex for about the first 10 d of intrathymic residence; this region virtually overlaps the sites of thymic entry, suggesting that DN1 cells move very little during this lengthy period of proliferation and lineage commitment. Movement out of this region into the deeper cortex is asynchronous, and corresponds to the appearance of DN2 cells. Differentiation to the DN3 stage correlates with movement across the midpoint of the cortex, indicating that stromal signals that induce functions such as TCR gene rearrangement reside mainly in the outer half of the cortex. The minimum time to reach the capsule, and thus transit to the DP stage, is ∼13 d, with the average time a few days longer. These findings reveal for the first time the kinetics of steady-state progenitor differentiation in the thymus, as well as defining the boundaries of cortical regions that support different phases of the differentiation process. We also show that the first lineage-positive progeny of transplanted stem cells to appear in the thymus are dendritic cells in the medulla, suggesting that each new wave of new T cell production is preceded by a wave of regulatory cells that home to the medulla and ensure efficient tolerance and selection.
Keywords: thymus, migration, homing, bone marrow, growth and development
Introduction
Like all hematopoietic lineages, new T cells must be produced throughout life. Unlike other hematopoietic lineages, however, the stem cells for T cell production do not reside where they differentiate (in the thymus), but rather originate in bone marrow (BM) and home to the thymus via the blood. Although there are undoubtedly BM cells that preferentially generate lymphocytes (1), it is also clear that many early intrathymic progenitors exhibit non-T lineage potential (2–7). For these cells, T lineage commitment, together with a millionfold expansion in progenitor cell numbers, occurs only after exposure to thymus-derived signals. Remarkably, very few of these signals have been identified to date (for review see reference 8).
New progenitors that are home to the thymus arrive in the perimedullary cortex, followed by migration outward to the capsule (9–13). Previous findings from our laboratory (14) showed that various stages of differentiation correlate with movement through regions of the cortex and into the subcapsular zone. This, in turn, suggests that the signals that induce progression through these stages may be stratified in corresponding tissue regions. Defining the relative boundaries of these regions would greatly facilitate identification of the signals that are unique to each. To accomplish this, we transplanted BM stem cells intravenously into nonirradiated congenic recipients and compared their tissue location at defined intervals to their developmental stage. With this approach, the cortical location of donor cells when any given stage of development first appears reveals the boundary of the corresponding stromal microenvironment. Overall, we find that cells spend an extensive period (∼15–16 d) at the CD4−8− (double negative, DN) stage of development. Approximately 9–10 d of this is spent at the earliest DN1 stage (CD44+25−) in a very restricted region near the sites of thymic entry. Differentiation to the DN2 stage (CD44+25+) coincides with movement out of this region into the deep cortex, whereas differentiation into the DN3 (CD44lo25+) stage, about 2 d later, correlates with crossing into midcortical regions. The minimum time to fully traverse the cortex, and differentiate to the CD4+8+ stage, is at least 13 d, although the average time is >15 d. In addition to more precise mapping of differentiative microenvironments in the cortex, our studies reveal for the first time the kinetics of T cell differentiation in the steady-state. We also describe the somewhat unexpected finding that the first donor-derived lineage to appear in the thymus after HSC transplantation are dendritic cells (DCs) residing in the medulla.
Materials and Methods
Purification and Transplantation of BM Progenitors.
Unless indicated, antibodies were produced and conjugated at Memorial Sloan-Kettering Cancer Center (MSKCC). Marrow was harvested from 4–6-wk-old C57BL/6 mice (animal studies were IACUC approved), and cells were treated with a cocktail of lineage markers (clone names in parentheses): CD3 (KT3), CD4 (GK-1.5), CD8 (53–6.7), B220 (RA3–3A1/6.1), Mac-1 (M1/70), Gr-1 (RB6–8C5), CD19 (1D3), and erythroid (TER-119). Initial depletion was performed using anti–Ig-coated paramagnetic beads (Dynal). Cells were then stained with PE/Texas red–conjugated anti-Ig (Caltag), Alexa 488–conjugated anti–IL-7R (SB-199), PE-conjugated anti–Sca-1 (BD Biosciences), and biotin-conjugated anti–c-kit (ACK-2), followed by Alexa 660 streptavidin (Molecular Probes). HSC were defined as lin− IL-7R− c-kit+ Sca-1+. Sorted cells (generally 3–5 × 10⁵ at >98% purity) were injected intravenously into 4.5-wk-old CD45.1+ mice in 100 μl of PBS.
Analysis of Chimeric Thymuses by Flow Cytometry.
At the times indicated, mice were euthanized and their thymuses removed. Using carefully timed recipients (15) and high donor cell doses (see above), chimerism was present in 100% of recipients. Chimerism ranged from <0.1% early after transplant (e.g., day 7) up to as much as 11% at the peak of CD4+8+ differentiation in some animals; overall, peak levels of chimerism (i.e., at the CD4+8+ stage) were generally 1–2%. Thymocyte suspensions were stained with purified anti-CD45.1 (recipient, clone 104-2) followed by rat anti–mouse Ig (Jackson ImmunoResearch Laboratories). Donor cells were then enriched using anti–rat Ig-coated paramagnetic beads. This was followed by staining with lineage cocktail (preceding section), then with Alexa 660–conjugated anti–rat Ig. After blocking excess sites with nonimmune rat Ig, cells were stained with Alexa 488–conjugated anti-CD44, PE-conjugated anti-CD25 (BD Biosciences), and Alexa 633–conjugated anti-CD45.2 (donor, clone A20). Cells of interest were identified as CD45.1− lin− CD45.2+. Analysis was performed on an LSR cytometer (BD Biosciences) with modifications as described (16), using DAPI (0.1 μg/ml) as a viability dye (16).
Analysis of Chimeric Thymuses by Microscopy.
At the times shown, mice were killed and their thymuses frozen in OCT (Fisher Scientific). Cryosections (10 μm) were prepared as described previously (14). Antibodies were Alexa 594–conjugated anti-CD45.2 (donor, clone A20), FITC-conjugated antipancytokeratin (clone C11, Sigma-Aldrich), or biotin-conjugated CD11c (BD Biosciences) followed by Alexa 488 streptavidin. Single-color images were acquired using an Olympus BX-51 fluorescent microscope and a Retiga EX-1350 monochrome camera (Qimaging). Subtraction of CD11c from CD45.2 (Fig. 4) was performed using the image subtraction function in IP Lab (Scanalytics). For regional quantitation, average-sized cortical regions (0.4–0.6-mm depth) were divided into four equal quartiles, and the number of cells in each region was counted. Sufficient fields were counted until >100 total donor cells were observed.
Figure 4.
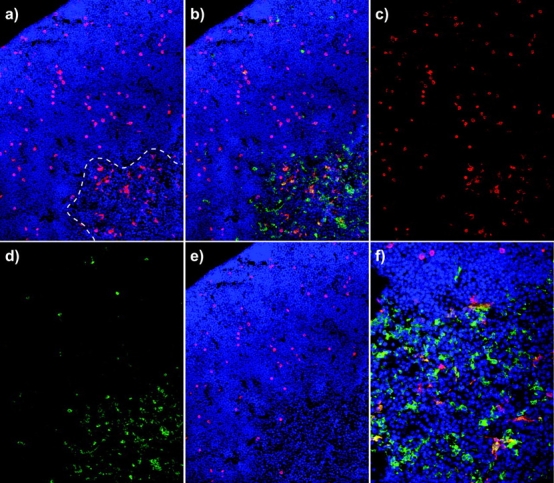
Donor-derived dendritic cells appear in the thymic medulla long before mature T cells. (a) The location of donor-derived progeny (CD45.2, red) at day 15 of differentiation; the dashed white line indicates the junction of cortical and medullary compartments. Note that donor-derived cells in the medulla are not lymphoid in morphology. In panel b, costaining with a dendritic cell marker (CD11c) is shown in green. Panels c and d show CD45.2 (donor) and CD11c (dendritic) stains separately; note that CD11c staining is largely absent from the cortex, but present on cells with dendritic morphology in the medulla. Panel e shows the same image as panel a, but with the CD11c staining subtracted from the CD45 staining; all donor-derived medullary cells disappear, revealing that such donor-derived medullary cells are of the dendritic lineage. Panel f shows a higher magnification view of CD45 X CD11c staining. Sections were costained with DAPI (blue). Original magnifications: a–e, 200×; f, 400×.
Results and Discussion
Kinetics of Steady-state Differentiation in the Nonirradiated Thymus.
To further define the location of microenvironments that signal various stages of the differentiation process, we first sought to define as precisely as possible the boundaries of each cortical region. We reasoned that by comparing cell differentiation to intrathymic localization, the boundaries of such regions could be mapped. For instance, the leading edge of progenitor distribution in the cortex when cells at a given stage of development first appear reveals the border of the signaling region that supports the corresponding differentiation step. Sequential analyses would thus progressively map the boundaries of all such cortical regions. These measurements required not only concurrent analysis of differentiation and localization, but require them to be performed in the steady-state. Unfortunately, most classical assessments of differentiation kinetics have been performed in irradiated mice (for review see reference 17), because irradiation (and other methods of cytoreduction) enhance thymic chimerism. However, recent studies have shown that recruitment of blood progenitors by the thymus is periodic rather than continuous, and that transplantation during responsive periods leads to efficient engraftment in nonirradiated hosts (15). We exploited this to assess the kinetics of differentiation in nonirradiated mice, as shown in Fig. 1 . HSCs were used as donor cells because they can be isolated in appreciable numbers and have significant expansion potential, although BM-derived lymphoid progenitors (1) have also been used in a limited number of experiments (unpublished data) with very similar kinetic results.
Figure 1.

Kinetics of progenitor differentiation in the steady-state thymus. Progenitor cells were purified and injected into nonirradiated CD45-congenic recipients. At various intervals, recipient mice were killed and the developmental stage of intrathymic progeny derived from transplanted cells was determined. Differentiation through stages of development that correlate with outward migration through the cortex (i.e., CD4−8− cells) is shown. Days 7, 8, and 19 represent single experiments; in all other cases data points represent mean ± SE for two or more recipients.
Several details of this kinetic analysis are noteworthy. First, thymus-homing progenitors spend a significant period, ∼9–11 d, at the DN1 stage. The length of this interval does not appear to be significantly influenced by HSC homing first to the marrow, then to the thymus, for several reasons. First, although a few transplanted HSCs clearly seed the marrow (Table I), there is larger wave of transient reconstitution that precedes this. Second, in limited experiments where BM-derived lymphoid progenitors were used, the kinetics of differentiation are not more than 1–2 d faster than that observed with HSC (not depicted), a difference that is probably accounted for by the more differentiated status of such cells. Third, while it is possible that this 9–10-d period may also include a continuous input of new progenitors from the blood, we can find no circulating donor cells as little as 24 h after transplant (not depicted), suggesting that this is not likely to be a major factor at the time points analyzed in Fig. 1. Finally, it is important to note that this 9–10-d interval is remarkably consistent with that predicted by studies using irradiated mice (for review see reference 17).
Table I.
Long Term Analysis of HSC Transplants Reveals a Wave of Thymic Seeding Followed by Low Level, Steady-state Chimerism
| Percentage of donor cellsa appearing as: | |||
|---|---|---|---|
| Days posttransplant | DN | DP | SPb |
| 20 | 10 | 68 | 22 |
| 24 | 6 | 48 | 48 |
| 30 | 5 | 43 | 52 |
| 60 | 1 | 88 | 11 |
After this 9–10-d period, DN2 cells begin to appear, and their numbers peak at about day 12–13. DN3 cells begin to accumulate at about day 11, and peak at around day 15. Together, these data indicate that the average lifespan for DN2 and DN3 cells is ∼2 and 4 d, respectively. The onset of DP differentiation (preDP, CD4lo8lo25−44lo) first occurs at around day 15. Thus, the overall period for migration across the cortex and transit through the DN stages is ∼15 d. Again, the kinetics of this steady-state differentiation process appears to be just slightly longer than predicted by others using irradiated mice (17). The peak of DP cell differentiation occurs at around 19 d after transplant (Table I, and unpublished data), with SP cells accumulating progressively thereafter.
Kinetic Analysis of Progenitor Localization Reveals Boundaries of Regions that Signal Progressive Stages of Differentiation.
As described above, our goal was to use cell location at key developmental transitions to reveal the boundaries of corresponding stromal microenvironments. We chose 9, 11, 13, and 15 d after transplant because these span the interval between the appearance of DN2 cells (i.e., the first intrathymic transition) and the first appearance of DP cells (correlating with the end of outward migration, see reference 14). The images in Fig. 2 show typical microscopy results, whereas in Fig. 3 , quantitation of donor progeny in numerous such images is shown. Cells remain in the immediate perimedullary cortex for ∼11 d after transplant, during which time they are almost exclusively DN1 (Fig. 1). Although cortical regions were divided into quartiles for simplicity, examination of many fields, including those shown in Fig. 2, suggests that this is a very narrow region, perhaps 10–20 cell diameters around the medulla. This suggests that not only is the DN1 stage quite long, but that these cells are nearly immobile and remain confined to tissue regions very near the sites of thymus entry. Movement into the second quartile is minimal at day 9, but increases by day 11 and peaks around day 13. By day 11, however, significant numbers of DN3 cells have begun to appear (Fig. 1), and donor progeny are now present in the third quartile. Together, these findings indicate that DN2 cells span the region from the immediate perimedullary cortex (where DN1 cells reside) through the second quartile, while the outer half of the cortex defines the inductive microenvironment for DN3 differentiation. Movement into the fourth quartile begins at about day 13, yet early DP cells do not appear in appreciable numbers until a day or two later (Fig. 1), suggesting that not only must cells migrate into the subcapsular zone to differentiate to the DP stage (14), but that they may actually be required to make contact with the epithelial layer that constitutes the inner capsular lining.
Figure 2.
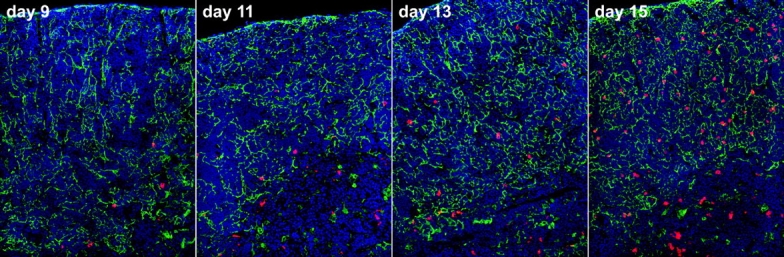
Intrathymic localization of T cell progenitors at critical transitions during the early lymphopoietic process. To determine the relative tissue range for each stage of T progenitor differentiation, the progeny of transplanted cells (CD45.2, red) were localized at time points corresponding to key developmental transitions, as defined by the data in Fig. 1. Pan-cytokeratin staining (green) and nuclear counterstain (DAPI, blue) were included to distinguish the boundaries of cortical and medullary regions. Quantitation of numerous such experiments is presented in Fig. 3. All panels are 200× original magnification.
Figure 3.

Quantitative assessment of kinetics of movement between signaling regions in the cortex. The cortex was divided equally into quartiles, with 1 being nearest to the medulla and 4 nearest the capsule. The number of stem cell-derived progeny in each quartile of transverse sections (see Fig. 2) was determined at various intervals; sufficient fields were analyzed until at least 100 donor cells were counted.
Consistent with the kinetics of differentiation measured by surface phenotype (Fig. 1), the time required for new thymus-homing progenitors to reach the capsule and differentiate into DP cells is ∼15 d. However, if one excludes the lengthy period spent as DN1 cells near the sites of entry, the transcortical migration time appears to be ∼4–6 d. Given that the average cortical depth is some 600–800 μm, migration along the cortical stromal matrix (18) appears to be very slow. This may reflect modulation between high and low states of integrin affinity, during which cells can pause to differentiate or proliferate, followed by periods of migration. Alternatively, this may be a consequence of the overwhelming force of DP cells moving inward from the capsule toward the medulla (19). Note that at all time points, some donor progeny were found in the medulla even though no mature lymphoid cells were found (Fig. 2, and additional unpublished data); the nature of these cells is discussed later in this manuscript.
Homing of Transplanted HSC Occurs Mainly in a Transient Wave, Followed by Low-level Steady-state Reconstitution Resulting from Stable Marrow Chimerism.
It is possible to argue that the absolute time required from transplantation until the appearance of any individual population could be influenced by homing of HSC first to the marrow and then to the thymus. Multiple lines of evidence suggest that this is not the case. First, it is worth noting that HSC do have the potential to generate T cells in the thymus (20), and can also home directly to the thymus (21, 22). Since HSC were administered in high numbers (see Materials and Methods), and were timed to coincide with peak thymic responsiveness (15), it is thus likely that at least some would home directly to the thymus. Second, limited long term analysis (Table I) suggests that most donor cells before day 20 represent an asynchronous wave resulting from direct thymus homing. For instance, after the peak of DP development (about day 19), the relative proportion of DP cells progressively diminishes, while the ratio of SP cells increases disproportionately, consistent with the end of a nonself renewing wave. At much later times, conventional proportions of DN, DP, and SP cell numbers are established, albeit at very low levels of chimerism (<1% donor cells, compared with 2–11% at the peak of the short-term wave), consistent with steady-state chimerism resulting from HSC that engraft the marrow. Low level BM chimerism is to be expected even in nonirradiated mice (23). Finally, as mentioned earlier, transplantation of lymphoid progenitors (c-kitlo Sca-1lo IL-7R+ lin−, see reference 1) resulted in only marginally accelerated kinetics of differentiation, and there is no evidence that these would have a preference for marrow.
The First Lineage-positive Progeny of Transplanted HSC Found in the Thymus are Medullary Dendritic Cells.
In all experiments, donor cells were seen in the medulla even though no mature T cells were present (see Figs. 1 and 2). These cells did not display lymphoid morphology, but were reminiscent of macrophages or DCs. To further characterize them, sections of chimeric thymus were stained for CD11b or CD11c expression. Few, if any, of medullary donor cells expressed CD11b (not depicted), suggesting that they were not primarily macrophages. However, virtually all such cells did express CD11c (Fig. 4) . It has been suggested by others that a coordinately derived wave of DCs may be required in order to properly screen the progeny of each new wave of T cell production (7, 24). We cannot unequivocally determine whether these DCs differentiated extrathymically and then homed to the thymus, or whether they differentiated in the thymus from a common progenitor, although it is noteworthy that a common progenitor of DCs and T cells has been identified (2, 7, 24). Further, the proportion of donor-derived DCs is much higher than the proportion of marrow chimerism found in our nonirradiated chimeras (Table I, and unpublished data), suggesting that they probably arise intrathymically from the synchronous wave that engrafts during peak periods of thymic responsiveness. The presence of these cells in the thymus after HSC transplants has implications for selection, tolerance, and graft rejection that extend substantially beyond the scope of the present study. However, our data raise the additional interesting question of whether intrathymic progenitors commit to these lineages before homing the cortex or medulla, respectively, or whether they are induced to become T or DC lineage cells as a consequence of being drawn into the cortex versus the medulla.
In conclusion, our data show that in the steady-state, differentiation of thymic-homing progenitors to the DP stage, and corresponding migration across the cortex, requires at least 15 d for completion. Much of this time is associated with the development of DN1 cells, which occurs in a very restricted region adjacent to the medulla. Since extensive proliferation and much of T lineage commitment occurs during the DN1 stage (for review see reference 25), identification of stromal signals present in this narrow region is likely to be of major importance. It is also worth noting that even as cells are released into the deeper cortex, a sizeable proportion remains near the sites of entry, even after >2 wk (Figs. 2 and 3). This suggests that individual waves of thymic homing progenitors do not differentiate synchronously, but rather that release of cells from the DN1 stage is asynchronous. This may explain why thymic seeding can occur in waves (15) while new T cell production is continuous, since asynchronous release from the DN1 compartment could maintain production of all later stages independent of the rate of thymic import. Our data also suggest that two other important signaling regions are defined by the outer half of the cortex, and the inner layer of the capsule, since these correlate with the irreversible induction of T lineage commitment and differentiation to the DP stage, respectively. Identification of the unique signals, or unique combinations of signals, that constitute these microenvironments will be critical for further understanding the thymic factors that induce and support T lymphocyte production postnatally and throughout life.
Acknowledgments
The authors thank P. Kincade (Oklahoma Medical Research Foundation) for the SB/199 monoclonal.
This work was supported by PHS grants AI33940 (to H.T. Petrie) and CA08748 (to Memorial Sloan-Kettering Cancer Center).
Abbreviation used in this paper: HSC, hematopoietic stem cell.
References
- 1.Kondo, M., I.L. Weissman, and K. Akashi. 1997. Identification of clonogenic common lymphoid progenitors in mouse bone marrow. Cell. 91:661–672. [DOI] [PubMed] [Google Scholar]
- 2.Manz, M.G., D. Traver, T. Miyamoto, I.L. Weissman, and K. Akashi. 2001. Dendritic cell potentials of early lymphoid and myeloid progenitors. Blood. 97:3333–3341. [DOI] [PubMed] [Google Scholar]
- 3.Mori, S., K. Shortman, and L. Wu. 2001. Characterization of thymus-seeding precursor cells from mouse bone marrow. Blood. 98:696–704. [DOI] [PubMed] [Google Scholar]
- 4.Antica, M., L. Wu, K. Shortman, and R. Scollay. 1994. Thymic stem cells in mouse bone marrow. Blood. 84:111–117. [PubMed] [Google Scholar]
- 5.Michie, A.M., J.R. Carlyle, T.M. Schmitt, B. Ljutic, S.K. Cho, Q. Fong, and J.C. Zuniga-Pflucker. 2000. Clonal characterization of a bipotent T cell and NK cell progenitor in the mouse fetal thymus. J. Immunol. 164:1730–1733. [DOI] [PubMed] [Google Scholar]
- 6.Ikawa, T., H. Kawamoto, S. Fujimoto, and Y. Katsura. 1999. Commitment of common T/Natural killer (NK) progenitors to unipotent T and NK progenitors in the murine fetal thymus revealed by a single progenitor assay. J. Exp. Med. 190:1617–1626. [DOI] [PMC free article] [PubMed] [Google Scholar]
- 7.Ardavin, C., L. Wu, C.L. Li, and K. Shortman. 1993. Thymic dendritic cells and T cells develop simultaneously in the thymus from a common precursor population. Nature. 362:761–763. [DOI] [PubMed] [Google Scholar]
- 8.Petrie, H.T. 2002. Role of thymic organ structure and stromal composition in steady-state postnatal T-cell production. Immunol. Rev. 189:8–20. [DOI] [PubMed] [Google Scholar]
- 9.Kyewski, B.A. 1987. Seeding of thymic microenvironments defined by distinct thymocyte-stromal cell interactions is developmentally controlled. J. Exp. Med. 166:520–538. [DOI] [PMC free article] [PubMed] [Google Scholar]
- 10.Dunon, D., D. Courtois, O. Vainio, A. Six, C.H. Chen, M.D. Cooper, J.P. Dangy, and B.A. Imhof. 1997. Ontogeny of the immune system: gamma/delta and alpha/beta T cells migrate from thymus to the periphery in alternating waves. J. Exp. Med. 186:977–988. [DOI] [PMC free article] [PubMed] [Google Scholar]
- 11.Brahim, F., and D.G. Osmond. 1970. Migration of bone marrow lymphocytes demonstrated by selective bone marrow labeling with thymidine-H3. Anat. Rec. 168:139–159. [DOI] [PubMed] [Google Scholar]
- 12.Brumby, M., and D. Metcalf. 1967. Migration of cells to the thymus demonstrated by parabiosis. Proc. Soc. Exp. Biol. Med. 124:99–103. [DOI] [PubMed] [Google Scholar]
- 13.Ezine, S., I.L. Weissman, and R.V. Rouse. 1984. Bone marrow cells give rise to distinct cell clones within the thymus. Nature. 309:629–631. [DOI] [PubMed] [Google Scholar]
- 14.Lind, E.F., S.E. Prockop, H.E. Porritt, and H.T. Petrie. 2001. Mapping precursor movement through the postnatal thymus reveals specific microenvironments supporting defined stages of early lymphoid development. J. Exp. Med. 194:127–134. [DOI] [PMC free article] [PubMed] [Google Scholar]
- 15.Foss, D.L., E. Donskoy, and I. Goldschneider. 2001. The importation of hematogenous precursors by the thymus is a gated phenomenon in normal adult mice. J. Exp. Med. 193:365–374. [DOI] [PMC free article] [PubMed] [Google Scholar]
- 16.Gordon, K.M., L. Duckett, B. Daul, and H.T. Petrie. 2003. A simple method for detecting up to five immunofluorescent parameters together with DNA staining for cell cycle or viability on a benchtop flow cytometer. J. Immunol. Methods. 275:113–121. [DOI] [PubMed] [Google Scholar]
- 17.Shortman, K., M. Egerton, G.J. Spangrude, and R. Scollay. 1990. The generation and fate of thymocytes. Semin. Immunol. 2:3–12. [PubMed] [Google Scholar]
- 18.Prockop, S.E., S. Palencia, C.M. Ryan, K. Gordon, D. Gray, and H.T. Petrie. 2002. Stromal cells provide the matrix for migration of early lymphoid progenitors through the thymic cortex. J. Immunol. 169:4354–4361. [DOI] [PubMed] [Google Scholar]
- 19.Penit, C. 1988. Localization and phenotype of cycling and post-cycling murine thymocytes studied by simultaneous detection of bromodeoxyuridine and surface antigens. J. Histochem. Cytochem. 36:473–478. [DOI] [PubMed] [Google Scholar]
- 20.Spangrude, G.J., and R. Scollay. 1990. Differentiation of hematopoietic stem cells in irradiated mouse thymic lobes. Kinetics and phenotype of progeny. J. Immunol. 145:3661–3668. [PubMed] [Google Scholar]
- 21.Lepault, F., and I.L. Weissman. 1981. An in vivo assay for thymus-homing bone marrow cells. Nature. 293:151–154. [DOI] [PubMed] [Google Scholar]
- 22.Mulder, A.H., J.W. Visser, J. Zoetelief, and D.W. van Bekkum. 1988. The entry of the prothymocyte into the thymus after lethal irradiation and bone marrow transplantation. II. Time of entry. Thymus. 11:29–41. [PubMed] [Google Scholar]
- 23.Blomberg, M., S. Rao, J. Reilly, C. Tiarks, S. Peters, E. Kittler, and P. Quesenberry. 1998. Repetitive bone marrow transplantation in nonmyeloablated recipients. Exp. Hematol. 26:320–324. [PubMed] [Google Scholar]
- 24.Donskoy, E., and I. Goldschneider. 2003. Two developmentally distinct populations of dendritic cells inhabit the adult mouse thymus: demonstration by differential importation of hematogenous precursors under steady state conditions. J. Immunol. 170:3514–3521. [DOI] [PubMed] [Google Scholar]
- 25.Wu, L., F. Livak, and H.T. Petrie. 1998. TCR-independent development of pluripotent T cell precursors. Molecular Biology of B-cell and T-cell Development. J.G. Monroe and E.V. Rotherberg, editors. Humana Press, Totowa, NJ. 285–303.