Topographical Pattern Dynamics in Passive Adhesion of Cell Membranes (original) (raw)
Abstract
Strong adhesion of highly active cells often nucleates focal adhesions, synapses, and related structures. Red cells lack such complex adhesion systems and are also nonmotile, but they are shown here to dynamically evolve complex spatial patterns beyond an electrostatic threshold for strong adhesion. Spreading of the cell onto a dense, homogeneous poly-L-lysine surface appears complete in <1 s with occasional blisters that form and dissipate on a similar timescale; distinct rippled or stippled patterns in fluorescently labeled membrane components emerge later, however, on timescales more typical of long-range lipid diffusion (approximately minutes). Within the contact zone, the anionic fluorescent lipid fluorescein phosphoethanolamine is seen to rearrange, forming worm-like rippled or stippled domains of <500 nm that prove independent of whether the cell is intact and sustaining a tension or ruptured. Lipid patterns are accompanied by visible perturbations in Band 3 distribution and weaker perturbations in membrane skeleton actin. Pressing down on the membrane quenches the lipid patterns, revealing a clear topographical basis for pattern formation. Counterion screening and membrane fluctuations likely contribute, but the results primarily highlight the fact that even in adhesion of a passive red cell, regions of strong contact slowly evolve to become interspersed with regions where the membrane is more distant from the surface.
INTRODUCTION
In the spreading of most tissue cells on a rigid matrix, focal adhesions assemble even on substrates of homogeneous ligand. Such adhesions are integrin-rich and cytoskeleton-stabilized. They are also topographically identifiable, particularly visible by reflected interference among other widely used techniques. To what extent is such patterning in cell membrane adhesion a strictly passive, rather than metabolically active, but dynamic process?
Pattern formation in either or both membrane composition and topography (Wong and Groves, 2001, 2002) at the junction between a cell or a lipid vesicle (Lipowsky and Sackmann, 1995) and a surface, has been noted for decades. It continues to emerge as a critical element of intercellular communication and signal transduction. The immunological synapse is perhaps the latest example (Grakoui et al., 1999) with receptor patterning between a highly active T-cell and an antigen presenting cell. The topographical pattern that emerges is largely based, it is thought, on physicochemical features of the membranes and the receptors (Qi et al., 2001). Not yet clear are the purely passive aspects of these processes, especially dynamics at the submicron scale and with cell membranes rather than model membranes (Albersdorfer et al., 1997; Sackmann and Feder, 1995). With charged lipid membranes (no protein whatsoever), electrostatically driven adhesion to solid-like substrates can be topographically dynamic in the contact region (Nardi et al., 1997, 1998).
The red cell is ideal for studies of passive reorganization of an intact biomembrane. Beyond lipids of many types and ∼40% cholesterol, the red cell membrane has a full complement of highly conserved integral and peripheral membrane proteins, making it a prototypical cell membrane—similar to neurons, for example (Goodman et al., 1988). However, the red cell lacks active mechanisms for spreading and locomotion (Trommler et al., 1985). Adhesion of red cells to the extracellular matrix and other cells is reported to play key roles in various pathological processes including malarial parasite invasion and sickle cell sequestration (Setty et al., 2002; Hillery et al., 1999; Mohandas and Evans, 1989) as well as physiological processes such as senescence (Oldenborg et al., 2000). Simpler substrates that do not reorganize when red cells adhere should shed some light on generic features of these processes. Rapid pattern formation has been seen in cell-cell adhesion of erythrocytes interacting via specific lectins (Darmani and Coakley, 1991; Rolfe et al., 2001), generic depletion forces (Baker et al., 1993; Thomas and Coakley, 1995; Coakley et al., 1999), and also poly-L-lysine (Coakley et al., 1985; Hewison et al., 1988; Thomas et al., 1992). The latter is a poly-cation commonly used to mediate nonspecific attachment of cells, including red blood cells (Wolf and Gingell, 1983), to negatively charged substrates. These topographical patterns reportedly form within seconds of cell contact. Here we show distinct molecular-scale patterns that evolve over longer times of minutes.
Fluorescence microscopy is used to focus on dynamic aspects (e.g., diffusion) of red cell adhesion to poly-L-lysine-coated glass, especially in the strong adhesion regime. In this regime an intact red cell is seen to come into rapid but sustained contact with a dense, positively charged poly-L-lysine layer. Both lipids and proteins—notably the integral membrane protein Band 3, and cytoskeletal actin to some extent—are shown to slowly reorganize into optically resolvable domains (by fluorescence) within the contact region. At least for lipids, the domains prove to be rippled or stippled gaps that separate membrane and substrate independent of membrane tension and which occur over timescales approximating long-range lipid diffusion. The lipid structures are placed in the broader context of a phase diagram in surface charge and poly-L-lysine molecular weight, where a transition to pattern formation appears consistent with electrostatics and shows a simple scaling in poly-L-lysine molecular weight indicative of cooperativity.
MATERIALS AND METHODS
Reagents
Poly-L-lysine hydrobromide of molecular weight 3.8 kDa (as well as 500 Da and 72 kDa), phosphate-buffered saline (PBS) tablets (0.01 M phosphate buffer/0.0027 M potassium chloride/0.137 M sodium chloride, pH 7.4), and Glutaldehyde 50% solution were from Sigma Chemicals (St. Louis, MO). N-(fluorescein-5-thiocarbamoyl)-1,2-dihexadecanoyl-_sn_-glycero-3-phosphoethanolamine, triethyl-ammonium salt (Fl-PE), eosin-5-maleimide (EMA), rhodamine phalloidin, 1,1′-dioctadecyl-3,3,3′,3′-tetramethylindocarbocyanine perchlorate (DiI), 4,4′ diisothiocyanatostilbene-2, 2′-disulfonic acid, disodium salt (DIDS), and the FluoReporter tetramethylrhodamine protein labeling kit (F-6163) were from Molecular Probes (Eugene, OR). All solutions were made in filtered double-distilled water.
Labeling of poly-L-lysine
A tetramethylrhodamine FluoReporter protein labeling kit was used to label 3.8 kDa poly-L-lysine at dye/protein molar ratio of 1. In place of gel filtration, dialysis was done for 2 days using a benzoylated cellulose dialysis tubing with a molecular weight cutoff of ∼2 kDa.
Labeling of red blood cells
Fresh human red blood cells were obtained by fingerprick from healthy donors. A small quantity of blood (∼50 _μ_l) was washed four times in PBS, and the cells were suspended in PBS at 1% hematocrit.
Labeling of lipids
Chloroform from a 1 mg/ml stock solution of Fl-PE in chloroform was evaporated, and the Fl-PE redissolved in 1 ml methanol, and sonicated for 20 min. Ten microliters of packed erythrocytes suspended in 40 _μ_l PBS was mixed with 5 _μ_l Fl-PE in methanol and incubated for 15 min at room temperature. The cells were finally washed in PBS and resuspended in PBS at 1% hematocrit.
Labeling of upper membrane segment
Labeling of the upper membrane segments of adherent red cells was done with a solution of 20 _μ_l Fl-PE in methanol/160 _μ_l PBS added on the spread cells for 15 min. After 15 min, the labeling solution was washed away with PBS as explained in text. The contact region was clearly not visible in <1 min, and the segmental labeling is fully consistent with partial labeling with the same probe of only the solution-exposed part of a cell while holding a red cell in a micropipette (Discher and Mohandas, 1996).
Labeling of Band 3
For Band 3 labeling, 2 _μ_l of a 2% hematocrit in PBS suspension was mixed in 46 _μ_l PBS plus 2 _μ_l of 1 _μ_M EMA in PBS. After 20 min at room temperature, the sample was centrifuged, the supernatant removed, and the cells were resuspended in 50 _μ_l PBS. To demonstrate specificity, Band 3 labeling of red cells was blocked by first incubating cells in 25 _μ_m DIDS for 45 min at 37°C (Salhany et al., 2003), and then EMA was added as above. Residual labeling by EMA proved undetectable in conventional fluorescence microscopy, and in total internal reflection (TIRF) microscopy it appeared very dim and bleached in 1 s.
Labeling of F-actin
Twenty microliters of rhodamine-phalloidin from a 6.6 _μ_M stock solution in methanol was resuspended in 10 _μ_l of lysis buffer (10 mM sodium phosphate buffer) after the methanol was removed under N2. Five microliters of packed erythrocytes were added and incubated for 10 min at 0°C. The red cell ghosts were resealed with addition of 2 _μ_l of 1 M KCl/10 mM MgCl2 and incubation in a 37°C water bath for 20 min. Ghost cells were washed in 100 _μ_l PBS and resuspended in diluted PBS (3:1 PBS/water) to swell the cells.
Labeling bilayer with DiI
Ten microliters of packed erythrocytes suspended in 40 _μ_l PBS were mixed with 0.5 mg/ml DiI in ethanol and incubated at 37°C for 30 min. The cells were washed twice in PBS and finally suspended at 1% hematocrit for adhesion experiments.
Preparation of substrates and spreading of cells
Slides or coverslips were cleaned by standard procedure by immersing them for 20 min in a mixture of KOH and ethanol, extensively washed with ultrapure water, then immersed in water for 2 h, and fast dried. One-hundred microliters of 0.1–100 mg/ml poly-L-lysine solution was allowed to adsorb for 5 min to a clean glass slide, and excess solution was drained away or collected. The poly-L-lysine-coated slide was dried further under vacuum for at least 2 h. Except for the data presented in Fig. 5, where several MW poly-L-lysines were used, all experiments were performed on slides coated with 3.8 kDa poly-L-lysine.
FIGURE 5.
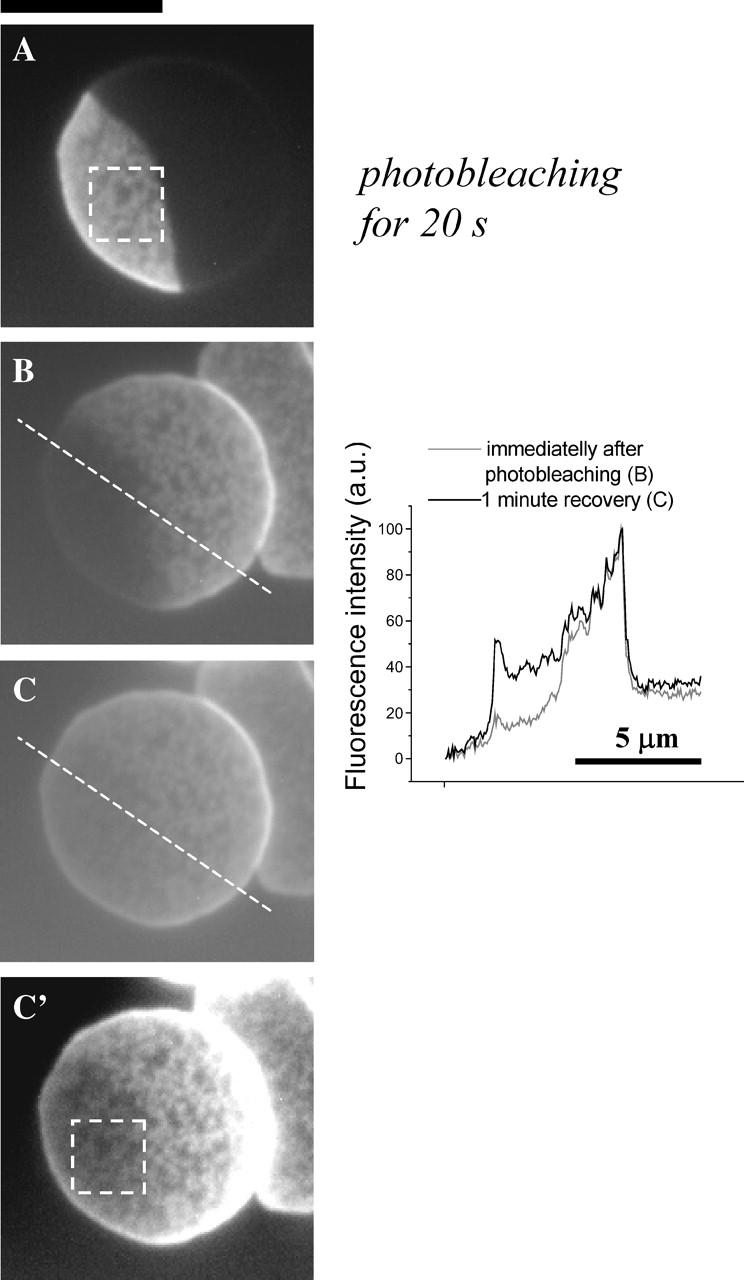
Mobility of the fluorescent lipid in the patterned contact region. Photobleaching by closing the iris half of a patterned red cell for 20 s (A) shows that in the bleached region (image B taken immediately after photobleaching) the fluorescent lipids migrate to recover the pattern in ∼1 min (C). Contrast is adjusted in image _C_′ to make the pattern visible, which is shown to remain the same before and after photobleaching. Scale bar is 5 _μ_m.
Hydrated poly-L-lysine is known to have a random coil conformation, which is transformed by slow drying (several hours) to an extended _β_-sheet conformation (Wolkers et al., 1998). Rehydration of the layer partially reconverts this structure to random coil (Wolkers et al., 1998) and this final mixed structure promotes electrostatic interactions with the negatively charged cell membranes. The _β_-sheet conformation is energetically favorable to lipid adhesion, since poly-L-lysine absorbed to acidic bilayers adopts this conformation (Carrier et al., 1990; Takahashi et al., 1991). The amount of rhodamine-labeled poly-L-lysine deposited on a slide was determined from spectrophotometry of the collected drained solution. For the 10 mg/ml poly-L-lysine of 3.8 kDa used in most experiments, this gave an average value of 0.2 mg/cm2 density on slides. Throughout most of the article we refer to the bulk concentration of poly-L-lysine since it is a widely used convention.
To each poly-L-lysine-coated glass slide, 450 _μ_l of 1% (fluorescent-labeled) red blood cells in PBS were allowed to adhere for 10 min. Unattached cells were removed by gentle rinsing of the slide several times with PBS solution, and an additional volume of PBS was added to avoid dehydration during microscope observation of the samples.
For the study of cells in isotonic sucrose rather than PBS, Fl-PE-labeled red cells were suspended in a buffer of 290 mM sucrose with 1/30 PBS (pH 7.4) and then allowed to adhere to the poly-L-lysine coverslips. This experiment was performed in parallel with a control experiment using PBS and the same batches of cells and coverslips.
For photobleaching experiments, the iris of the microscope was reduced to the minimum diameter so that only a small region of the sample was excited. The sample was positioned in such a way that only a minor fraction of a red cell was illuminated, with the remainder in the shadow of the iris. After bleaching the exposed part of the cell, the iris was enlarged, so that the whole cell could be seen in fluorescence for collecting a sequence of images.
Fluorescence microscopy
Conventional fluorescence microscopy was performed with a Nikon Eclipse TE 300 inverted microscope equipped with a Nikon Plan APO 100×/1.40 oil infrared, disseminated intravascular coagulation H objective (Nikon, Tokyo, Japan) and a Cascade charge-coupled device camera (Photometrics, Tucson, AZ). Suitable excitation and emission filters were used for fluorescein (496 nm/519 nm), rhodamine phalloidin (554 nm/573 nm), and EMA (519 nm/540 nm). TIRF microscopy was performed with an Olympus IX71 inverted microscope equipped with a 488-nm laser, an Olympus Plan APO 60×/1.45 oil objective (Olympus, Melville, NY), an emission filter for fluorescein, and the same charge-coupled device camera.
Atomic force microscopy (AFM)
Atomic force microscopy (AFM) imaging was done on a BioScope (Digital Instruments, Santa Barbara, CA) with a 120-_μ_m x,y and 6-_μ_m _z_-scanner placed on an inverted Zeiss Axiovert microscope (Zeiss, Jena, Germany). Poly-L-lysine imaging was carried out in PBS at room temperature. Sharpened silicon-nitride cantilevers (microlevers, Park Scientific Instruments, Sunnyvale, CA) with a nominal spring constant of 100 pN/nm were used. Imaging was done in tapping mode with a scan rate of 0.3 Hz (tip velocity of 18 _μ_m/s), and the minimal possible force used to obtain good image contrast. This force was determined by gradually increasing the force applied to the sample from zero force (noncontact). Roughness was determined on an unprocessed height image, with built-in analysis algorithms. This algorithm calculates an average surface roughness by first determining an average surface level _z_avg for the height image and simply calculating root mean-square roughness as 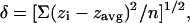 where _z_i is the height at the point i = 1,n, and n is the number of points sampled on the surface.
Reflection interference contrast microscopy (RICM)
The initial contact, adhesion, and spreading of red blood cells on poly-L-lysine was observed by reflection interference contrast microscopy (RICM), using an inverted microscope equipped with an Antiflex 63× oil-immersion objective (NA = 1.3, Axiomat, Zeiss). Epi-illumination through the objective was rendered monochromatic by passing light from a 100-W Hg vapor lamp (Biolux, Osram, Germany) through an interference filter (IFg 546.1 nm, 85% transmission, 12-nm waveband). Images were recorded with a C4880-85 camera (Hamamatsu, Hamamatsu City, Japan), with a readout noise of seven electrons root mean-square and a frame rate of 37 ms.
The observations of Fig. 1 began as a cell under study hovered over a glass substrate in a transparent buffer. The incident light reflected both from the glass-buffer interface and from the buffer-cell interface. Interference of the two reflected rays gives rise to the characteristic RICM pattern. When the two interfaces are very close together—that is, when the cell adheres to the substrate—the path difference between the interfering rays is zero and the interferogram exhibits a minimum in the intensity. As the membrane curves away from the substrate, the path difference increases and the corresponding intensity on the interferogram also increases. It passes through a maximum and starts to decrease again until the path difference is equal to one-half the wavelength of the light being used, at which point the intensity is again a minimum (Ploem, 1975; Sackmann and Bruinsma, 2002). A pattern of alternating dark and bright fringes was thus obtained. In the present case, the vertical distance between each dark (or bright) fringe corresponds to ∼200 nm.
FIGURE 1.
(A) Dynamics of rapid adhesion of a red cell coming into contact with a dense poly-L-lysine substrate as seen by RICM. The fluctuations of the floating cell (first frame and B) are significantly reduced as the cell zips up on the surface (C) and becomes completely attached to the substrate (last frame and D). The adhesion and spreading of the cell is complete in <700 ms. The circular fringes in the RICM image of the attached cell represent reflections off of the upper membrane that become spherical (Hategan et al., 2003). The cap-like bubbles especially obvious in the last two frames exhibit slower dynamics, and arise from reflections off the lower membrane that are otherwise in strong adhesive contact. Scale bar is 5 _μ_m. Intensity profile plots are averages and deviations (Δ) determined from three consecutive frames recorded at 37-ms intervals.
RESULTS AND DISCUSSION
Spreading of red cells on poly-L-lysine
Adsorption of poly-L-lysine to a glass coverslip gives a substrate with a general adhesiveness toward cells that depends on the amount of poly-L-lysine adsorbed. At low concentrations of cationic poly-L-lysine (∼1 mg/ml bulk), negatively charged erythrocytes will adhere firmly, but the cells remain discoidal in shape (Tuvia et al., 1997; Scheffer et al., 2001). At ∼10-fold higher concentrations of poly-L-lysine, erythrocytes spread rapidly and more strongly onto the substrate. The interference patterns from RICM in Fig. 1 show the subsecond dynamics of red cell adhesion from initial contact onward. The interference fringes initially represent the contribution of the lower membrane of the red cell as the cell slowly settles toward the surface under gravity. Multiple asymmetric rings are seen with an intensity that fluctuates considerably over time. The plot to the right of the 0-ms frame (Fig. 1 B) shows one time-average intensity profile across the cell diameter and also the large deviation (Δ) from this average profile over the next ∼100 ms. Fluctuations are indicative of the low tension dynamics of the relatively unconstrained membrane. A first point of strong contact is visible as the dark region on the right side of the second frame at 140 ms. This close contact grows rapidly: in <1 s the entire cell is strongly spread onto the poly-L-lysine surface and takes the shape of a tensed spherical cap (Hategan et al., 2003).
Wetting kinetics are of general interest and have been discussed less for cells than for liquid droplets on simple substrates (Petrov et al., 2003a,b). While a full wetting analysis is beyond the present scope, the dynamic changes in contact area are clearly illustrated in Fig. 1 C. A diffusive spreading velocity, as spread area per unit time, appears characteristic of the initial phase of rapid spreading and has a value of ∼100 _μ_m2/s. If such spreading rates were limited by diffusion of membrane components, then the relevant comparison is to the largest diffusivity which is that of membrane lipid. Thus, compared to lipid diffusivities of only ∼1 _μ_m2/s (Discher and Mohandas, 1996), rapid spreading here implies an adhesion process that is not likely to be diffusion-limited and is instead driven by a strong affinity of the cell for the surface.
In the last two frames of the rapid adhesive spreading, where the cell becomes strongly attached to the surface, the concentric fringes arise from reflections off of the upper spherical cap of the membrane (Hategan et al., 2003). Whereas the interference fringes in the strongly adherent state fluctuate in time (Fig. 1 D), these fluctuations are much smaller than in the case of the freely floating cell (Fig. 1 B). As Hategan et al. (2002) described before, the tension, γ, arising in the spherical cap of the membrane suppresses the fluctuations and ultimately limits spreading to a finite included angle φ per the classic Young-Dupre relation for adhesion energy, S = γ cos φ (Seifert and Lipowsky, 1990). Any further gain in adhesion energy S must pay a further price in stretching the membrane, and this leads to a balance evident with the plateau in the spread area kinetics of Fig. 1 C.
Often superimposed on the concentric RICM fringes are white disks or blisters that arise from the lower membrane, which is otherwise in intimate contact with the poly-L-lysine. Blisters with diameters as large as 1 _μ_m and heights up to 300 nm are seen to form at the moment of cell membrane attachment (Figs. 1 and 2). Blisters of similar height have been seen with two charged multicomponent lipid membranes coming into contact (Nardi et al., 1997, 1998). Here, rapid lateral spreading of Fig. 1 (<1 s) likely outpaces hydrodynamics, leading to fluid entrainment within non-equilibrium blisters. The blisters exhibit smaller fluctuations in shape than the fringes arising from the upper spherical membrane of the cell and suggest a locally greater tension or restraint. Importantly, many of these blisters or gaps in the contact region disappear or heal within seconds of adhesion (e.g., 16 s in Fig. 2). In lipid vesicles likewise, blisters enlarge within seconds, fuse, and frequently escape into bulk. Since gaps smaller than ∼5 nm in height cannot be discerned by RICM, the transient blisters are a first indication that the membrane in the contact region is not strictly flat, but topographically complex and rearranging.
FIGURE 2.

RICM images of a spread red cell on poly-L-lysine after adhesion (A) and 16 s later (B), showing that some of the bubbles formed in the contact region during adhesion disappear in time. Scale bar is 5 _μ_m.
In the strongly adherent state, the membrane is tensed sufficiently by adhesion (Hategan et al., 2003) that the cells will lyse in a time of τ ∼ 45 min (for 10 mg/ml poly-L-lysine). As shown in Hategan et al. (2003), lysis on such long timescales also occurs in micropipette aspiration under a small tension (γ ≈ 0.8 mN/m) and is further consistent with the resistance to AFM indentation of these adherent cells. Findings below show that before lysis but after blister rearrangement, cell membrane components reorganize and appear more systematically patterned in the strong adhesion region.
Fl-PE patterns and kinetics in strong adhesion
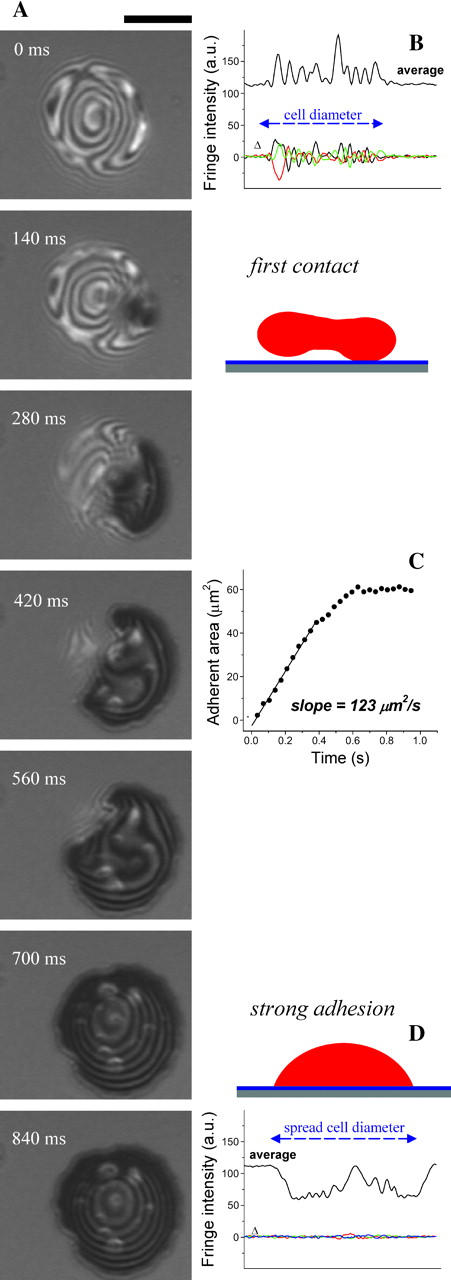
The fluorescent lipid Fl-PE (∼1% of total lipid) appears initially uniform in fluorescence after incorporation into red cell membranes. Fig. 3 shows the incorporation (after 10–15 min) and dynamics of this fluorescent lipid from bulk solution into the upper membrane of pre-adhered red cells. By 20 min, the fluorescent lipid migrates from the upper membrane into the adherent contact region (Fig. 3 B), and by 30 min, a fluorescent network pattern emerges (Fig. 3 C). This pattern remains stable in time, and image contrast is considerably improved by exchanging the fluorescent bulk solution with PBS (Fig. 3 D). Since the flip-flop movement of lipids within the two leaflets of the red cell membrane takes hours (Middelkoop et al., 1986), we believe that the fluorescent lipid incorporates mainly in the outer face of the red cell membrane, and all the migration seen takes place within that leaflet. Likewise, for lipid vesicles strongly attached to a poly-L-lysine surface, only the charged lipids in the outer leaflet migrate toward the surface (Bernard et al., 2000). Important but shown later, poly-L-lysine is essentially uniform on the substrate if compared to the lipid patterns seen here. Like the initial blisters, the membrane patterns also prove to be topographic, but of ripples or stipples rather than blisters.
FIGURE 3.
Spread red cells already on poly-L-lysine were labeled by addition of Fl-PE, showing that in time (10–15 min) the fluorescent lipid initially in the upper membrane migrates into the adhesive contact region, and eventually yields a fluorescent pattern. (A) Fluorescence image taken immediately after adding the fluorescent lipid to the bulk media of spread red cells shows no cell labeling. (B) After 20 min, many cells show diffuse but uniform fluorescence, which in another 10 min, becomes the network-like pattern (C). The pattern formed appears more clear (D) after the bulk Fl-PE is washed away (removing background fluorescence). Scale bar is 5 _μ_m.
The results above indicate that strong adhesion promotes membrane reorganization while allowing migration of cell lipids within the contact region. From the mean area of cell contact, _A_contact (≈60 _μ_m2), and the known free diffusion constant _D_lipid ∼ 1 _μ_m2/s, lipid diffusion timescales should be _A_contact/_D_lipid ∼ 100 s. Significantly longer diffusion and patterning times noted in Fig. 3 imply hindered long-range diffusion in the contact region. An impedance is consistent with strong adhesion.
A similar pattern of lipid in the contact region is obtained when the red cells are first labeled with Fl-PE and then spread on the poly-L-lysine-coated slides in the standard physiological buffer (PBS buffer, pH 7.4). Both TIRF microscopy (Fig. 4 A) as well as conventional fluorescence microscopy of the cell-substrate contact zone show distinct spatial patterns within the strong adhesion regime. The patterns here consist of either a worm-like network of ripples or else circular stipples. The widths of the ripples and the diameters of the stipples are typically ∼500 nm. Once formed, the patterns are stable and immobile in time, even if the upper part of the cell is ruptured, as we show later by transient mechanical contact with a micropipette.
FIGURE 4.
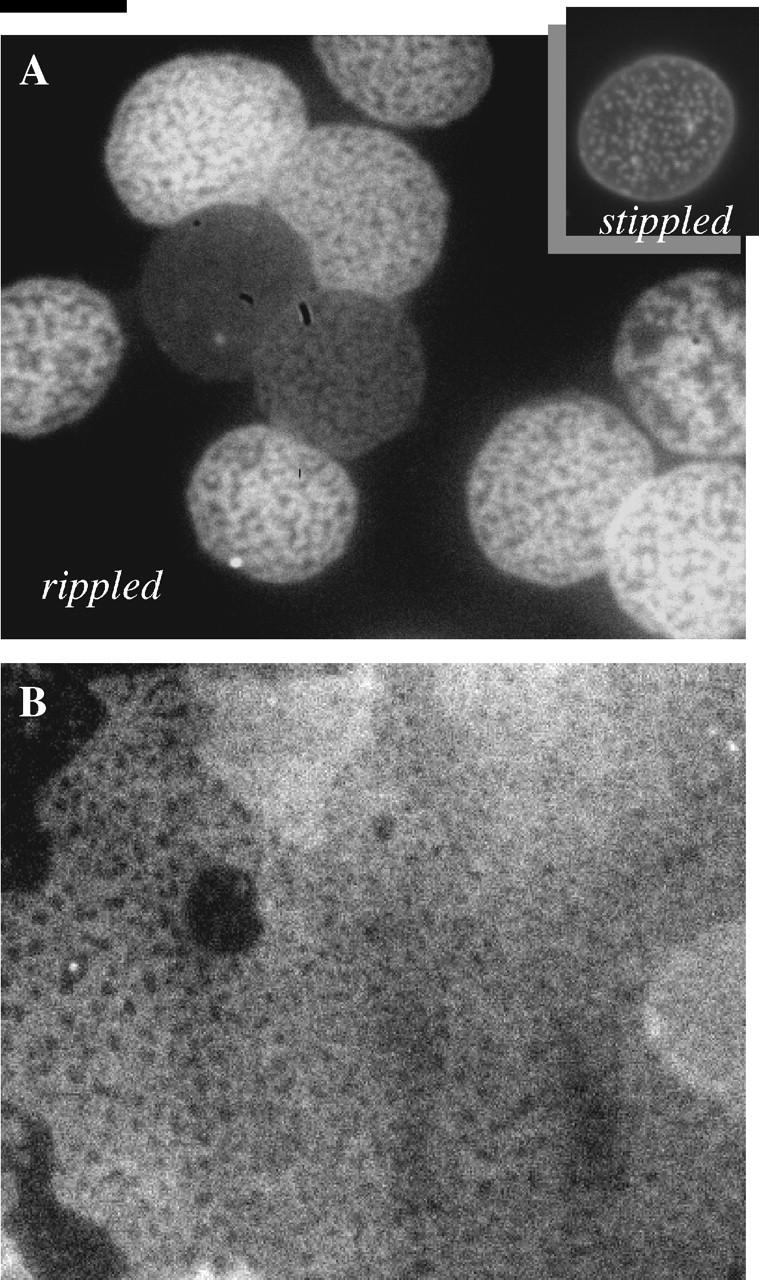
Fl-PE preincorporated in the red cells is initially uniform while cells spread on poly-L-lysine, but FL-PE later develops into network-like or spotted patterns in the contact region, as shown by TIRF microscopy (A). At slightly higher concentrations of poly-L-lysine, and with a similar number of attached cells, the upper membranes rupture and fuse to form a uniform multicellular membrane surface with dimensions of tens of microns (B). This fused membrane shows the same pattern observed under intact cells, indicating that the pattern formation is independent of the tension in the upper membrane (Hategan et al., 2003), the integrity of the cell, and intracellular components ranging from ATP to hemoglobin. Scale bar is 5 _μ_m.
Migration of charged lipids on the surface of lipid vesicles bound to a poly-L-lysine substrate has been described before (Bernard et al., 2000), and recruitment of model adhesion receptors into the adhesion zone between two vesicles has also been observed (Noppl-Simson and Needham, 1996). However, the results here seem to be the first direct evidence that lipids in a complex protein-lipid membrane of an intact cell diffuse into and subsequently reorganize within the strong adhesion region.
At very high concentrations of poly-L-lysine and a large number of attached cells, the membranes rupture due to the adhesion-induced tension (Hategan et al., 2003). The membranes then fuse to give supported, erythrocyte-derived bilayers described before by Tanaka et al. (2001). The x,y dimensions can be many tens of microns (Fig. 4 B). Importantly, the same pattern is observed beneath both ruptured and intact cells, indicating that pattern formation is independent of both the integrity of the cell and any tension in the membrane, which necessarily decreases upon lysis. Wong and Groves (2001) have made similar observations of patterns in ruptured lipid vesicles adherent to oppositely charged planar bilayers by electrostatic attraction.
Lateral mobility of adhesive pattern
The lateral mobility of fluorescent lipid within the patterned contact region is confirmed by fluorescence recovery after photobleaching (Fig. 5). Approximately one-third of a spread, patterned red cell is shown photobleached in Fig. 5 A. Images taken immediately after photobleaching show that the dye is indeed initially bleached (Fig. 5 B), but within ∼1 min the same fluorescent pattern is mostly recovered within the bleached zone (Fig. 5 C). This not only again demonstrates the migration of lipid within the patterned contact region, but also the fact that the pattern remains the same before and after recovery. Unlike the blisters that dissipate (Fig. 2), the ripples are held strongly in place with molecules exchanging in and out of what must be, due to length scales, highly cooperative adhesions.
The approximate area of photobleaching is _A_bleach ≈ 20 _μ_m2, which is ≪_A_cell (130 _μ_m2), and implies the remaining lipids diffuse into the contact zone with minimal overall depletion of fluorescent lipid (except for whole-cell bleaching). The approximate recovery time of _τ_recovery ≈ 60 s gives a very simple estimate of the lipid diffusivity in the contact zone of _D_lipid-contact ≈ 0.33 _μ_m2/s. Since free diffusion of this same lipid in red cell membrane has _D_lipid ∼ 1 _μ_m2/s (Discher and Mohandas, 1996), the contact zone certainly appears to hinder or impede but obviously not eliminate lipid diffusion.
Topographical pattern: compression-induced quenching
Fluorescence patterns of the general type seen here with red cells have been seen recently by FRET with model lipid bilayers adhering to each other by electrostatic interactions (Wong and Groves, 2001). Topography proved to be the basis for such patterns. To assess a related mechanism here, a spread, patterned cell was transiently compressed with a glass microrod past the point of cell rupture: under the rod, after it is pulled away, the probe is clearly quenched (Fig. 6), and remains so for at least 10 s afterwards. The results offer critical insight by implying that, in close contact regions, the dye is quenched. Fluorescence is thus being seen only in the membrane regions that are not in closest contact with the cationic poly-L-lysine surface. The contact zone thus shows intermingled regions of strong, close contact to poly-L-lysine (black zones) and non-adhering gaps (fluorescent membrane zones). In the gap regions the poly-L-lysine may be screened either by salt (Wolf and Gingell, 1983) or by redistributed glycocalyx components (see below).
FIGURE 6.
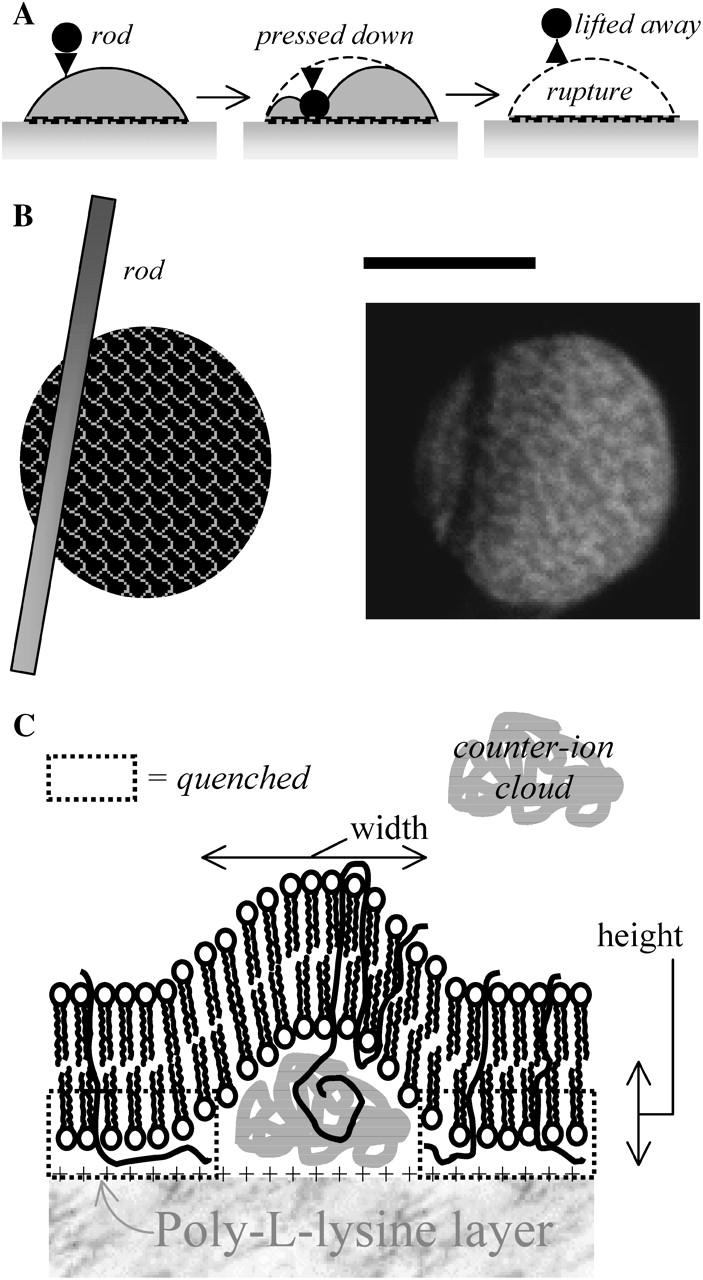
The Fl-PE pattern of a red cell is locally quenched in the region where a microrod had been pressed down onto the cell (A_–_B). This provides direct evidence that, when forced into close contact, the Fl-PE can be quenched by poly-L-lysine. The molecular scale view is sketched in C with quenching in the boxed regions. Scale bar is 5 _μ_m.
Topographical pattern vanishes in low salt solution
Semiperiodic gaps between red cells adhering to each other were reported by Coakley et al. (1999). They described blister-like patterns that formed rapidly in physiological saline and also showed that the pattern wavelength of the gap grew with decreasing ionic strength.
To assess salt contributions here, red cell adhesion to the substrate was done in an isotonic sucrose buffer (Fig. 7 A). The contact regions for cells in sucrose show very little intensity modulation as observed in TIRF. This indicates a relatively homogeneous adhesion; the control sample done in parallel in PBS shows the reproducible reticulated ripples (Fig. 7 B). The two experiments were performed with the same batch of coated coverslips and red cells labeled with Fl-PE, and were imaged at the same time with the same imaging settings to also compare overall intensities and variations. The profiles for cells in sucrose buffer are relatively flat except for an edge effect due to membrane curvature (Discher and Mohandas, 1996). In PBS, the intensities are not much higher than those in sucrose, and the low intensity regions in the contact zone are up to 50% below the maximum. The results imply a counterion-dependent mechanism of fluorescence quenching and are further consistent with a roughened topography of the membrane in the contact region.
FIGURE 7.

Buffer contribution to the pattern in Fl-PE-labeled red cells adhering to a poly-L-lysine surface. In isotonic sucrose buffer, the pattern in the contact region is absent (A), whereas the parallel control sample in PBS shows the pattern (B). From TIRF imaging, intensity variations in PBS are seen to be 50% or less than those in sucrose but not much higher, which implies quenching of fluorescence rather than other mechanisms of intensity gain.
Pattern dependence on poly-L-lysine concentration and molecular weight
The pattern in the adhesion zone depends on surface-charge density through both the concentration, C, of poly-L-lysine and on the poly-L-lysine molecular weight, N (Fig. 8). At low concentration and low molecular weight the cells are weakly adherent, characterized by a small contact area and an echinocytic shape (highly curved spikes) showing no obvious fluorescence patterns. Such shapes are typical of red cells on glass in PBS; albumin coating of glass is widely used to avoid this and maintain the red cell's native discocyte shape. Increasing either C or N of poly-L-lysine first gives a homogeneous fluorescence with strong cell spreading. Further increases in C or N, however, lead to patterned fluorescence (reticulated and/or spotted). At still higher C or N, lysis and fusion of the membranes occurs but the membranes retain their pattern. This indicates, importantly, that neither an intact cell membrane nor tension is needed for the patterning. Coakley et al. (1999) likewise concluded from calculations for fluid membranes that tension was also not especially important to pattern formation in cell-cell adhesion. Local bending was concluded to be more important. Aggregation of the cells occurs at the highest C, here most likely because poly-L-lysine desorbs from the saturated glass and begins to cross-link the red cells. Thomas et al. (1992) demonstrated such red cell aggregation with poly-L-lysine in solution.
FIGURE 8.

The adhesion pattern with Fl-PE is dependent on the surface charge density of poly-L-lysine as set by its mass concentration, C, and molecular weight, N. For increasing C and N, weak adhesion with small contact area and an echinocytic (spiky) contour transitions to more uniform spreading and then to patterned spreading. Lytic fusion of the membranes at higher C and N also shows the pattern. At very large C and N, aggregation of the cells before reaching the substrate probably indicates that the poly-L-lysine desorbs from the surface. For the representative images, the indicated phases are separated by linear boundaries of slope −0.65 to −0.88 on this log-log plot. Scale bar is 5 _μ_m.
Placing the various patterned phases in a log N versus log C plot (Fig. 8) shows a systematic trend. Most notably, the transition boundary from a homogeneously fluorescent adhesion zone to a patterned contact with spotty or reticulated dark regions shows a characteristic power-law dependence,
 |
(1) |
|---|
Parallel lines separate all of the various phases and lead to an approximate range of α = 0.76 (±0.11). If it were found that α = 0, then the only important characteristic of poly-L-lysine would be the lysine group itself (e.g., its charge). However, the finding that α > 0 indicates the importance of the polymeric nature of poly-L-lysine to the patterning or clustering process(es) here. Folding of poly-L-lysine has been reported to contribute to membrane adhesion (Wolkers et al., 1998), and folding is generally known to be cooperative in N. Another feasible mechanism is cooperative binding of multiple membrane ligands to sites on a single large poly-L-lysine chain. A relevant biological comparison is membrane binding and component clustering by IgM, which effectively consists of five bivalent IgG all tethered together. Compared to binding of the same mass concentration of bivalent IgG, one would generally expect more potent cooperativity in clustering by the IgM (Hill, 1985). Further discussion of Eq. 1 and the scaling in α is provided below.
The interaction between poly-L-lysine and lipid membranes has been demonstrated to be electrostatic (Denisov et al., 1998; Kleinschmidt and Marsh, 1997; Ben-Tal et al., 1996; Johnson et al., 1991). For high N poly-L-lysine, the interaction seems to be more complex, since some chains penetrate the lipid bilayer (Franzin and Macdonald, 2001; Carrier and Pezolet, 1986). At low N (N ∼3.8 kDa and up to ∼13 lysine monomers per chain) the poly-L-lysine lengths are insufficient to even modify the structure of the lipid headgroups (Carrier and Pezolet, 1986; Franzin and Macdonald, 2001), and so there is only superficial electrostatic interaction (Johnson et al., 1991; Franzin and Macdonald, 2001). Since we found the same pattern at both low N and high N, pattern formation in the red cell membrane here appears to be uninfluenced by the possible penetration of the bilayer by some poly-L-lysine chains. However, the red cell membrane is far more complex than a lipid bilayer, and the presence of integral membrane proteins, as well as the glycocalyx, may not allow the poly-L-lysine chains, even the longest, to reach and penetrate the lipid bilayer.
An additional lipid bilayer fluorophore, cationic DiI, was also integrated into the membrane as in Picart and Discher (1999). No fluorescent pattern was visible, however. Such a result suggests that the topographical quenching outlined above is due to direct interactions of anionic probes (such as anionic Fl-PE) with poly-L-lysine.
Membrane protein patterns: Band 3 and F-actin
The red cell membrane is mostly protein by mass (Fig. 9 A), and so visualization of protein responses in strong cell adhesion was the next goal. In C and N regimes where lipid domain formation is observed (see Fig. 8), spatial inhomogeneities in the anion exchanger Band 3 were seen (Fig. 9 B). However, the spotty pattern of the EMA, which fluorescently marks the extracellular domain of Band 3 by a covalent attachment (Golan and Veatch, 1980), appears different from most lipid patterns. The pattern seems inverted from the spotted pattern of Fig. 3 A, and consists of small and sparse dark point-like regions (<500 nm). Although this pattern suggests spatial reorganization of the protein Band 3, the topographical interpretation above is that the dye is quenched in regions where the extracellular domain of Band 3 protein is in its own close contact with poly-L-lysine. Small molecular weight poly-L-lysine (3.6 kDa) has been shown before to induce aggregation of Band 3 protein on intact red cells (Clague and Cherry, 1989). The clustering there proved salt-dependent and reversible, indicating a direct interaction—undoubtedly electrostatic—between Band 3 and poly-L-lysine (Clague and Cherry, 1989).
FIGURE 9.
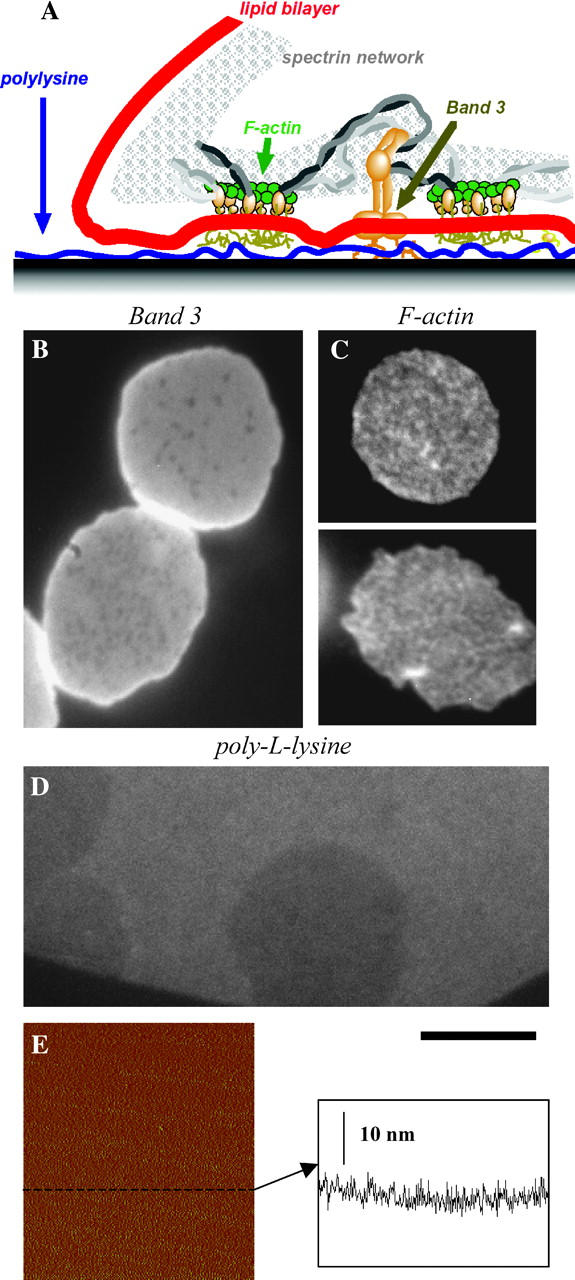
(A) The red cell membrane is a complex of lipid and protein, and its components respond differently in the strong adhesion regime. (B) Lipid domain formation is also accompanied by clear spatial perturbations in protein Band 3 distribution, presenting dense and smaller dark point-like regions. This is suggestive of reorganization or quenching of the dye in the regions where the eosin-labeled exoplasmic domain of Band 3 protein is in the favorable nanomolar distance to poly-L-lysine. (C) Rhodamine-labeled actin images of spread red cells suggest that actin is also perturbed, but to a very small degree. (D) Fluorescently labeled poly-L-lysine shows a uniform surface at the same scale. (E) Red cells in strong adhesion on this surface are shown to quench the dye. The AFM scan and height profile also shows the uniformity of hydrated poly-L-lysine on glass. Scale bar is 5 _μ_m.
Patterns in the membrane skeleton actin protofilaments (∼30 nm) are much harder to discern, but there is again a suggestion of a weakly nonuniform, grainy distribution in the contact zone when resealed red cells or ghosts are prelabeled fluorescently with rhodamine phalloidin (Fig. 9 C). Since the poly-L-lysine chain seems too short to penetrate the membrane or even to modify the lipid headgroup structure, it can be assumed that the perturbations induced in the F-actin distribution are indirect and due to direct topographical deformations as well as perturbations to integral proteins that are linked to the cytoskeleton. In a double-labeled red cell with rhodamine phalloidin and Fl-PE, the lipid pattern is again accompanied by a weaker, dim but observable perturbation of the actin distribution (data not shown).
Strong interactions with homogeneous poly-L-lysine film
Rhodamine-labeled poly-L-lysine shows in fluorescence a uniform surface under the cells (Fig. 9 D), using the same imaging conditions as above. This uniformity of the poly-L-lysine layer is in agreement with literature data (You and Yu, 1997; Leckband et al., 1993). Poly-L-lysine is known to adsorb electrostatically to clean glass or mica, both of which are negatively charged under physiological buffer. Atomic force microscopy of a dried poly-L-lysine monolayer on mica (N ≈ 300 kDa, C ≈ 0.25 mg/ml) has shown a uniform surface with only suboptical ∼50-nm holes in it (You and Yu, 1997). AFM tapping mode imaging here of the poly-L-lysine-coated glass slides in PBS buffer (N ≈ 3.8 kDa, bulk concentration of 10 mg/ml) also shows a uniform (nonreticulated) surface with an average roughness of 1.7 nm (Fig. 9 E). Fixation of the layer with glutaraldehyde gives similar data. In accord with these measurements, others have found that poly-L-lysine (10 kDa) absorbed on mica forms a uniform monolayer of 1.8 nm height in its hydrated state (Leckband et al., 1993). The fact that poly-L-lysine is uniform under red cells clearly indicates that membrane patterning is not merely following an underlying structure in the poly-L-lysine monolayer network. The lack of pattern in the poly-L-lysine is consistent with strong interactions but no mobility and no topographical reorganization of the poly-L-lysine. In sum, our data shows that if the cell faces a uniform and dense positively-charged surface of poly-L-lysine, then it not only attaches strongly to the surface, but also develops a macroscopic adhesive pattern over time.
THEORETICAL CONSIDERATIONS
In the studies here, the free energy landscape that seems to underlie membrane dynamics has three states (Fig. 10). The relatively free membrane (Fig. 1 at ∼0 ms) fluctuates greatly until it contacts the substrate and rapidly zips up on the surface. Strong interactions clearly drive this process to occur ∼100-fold faster than lipids can diffuse. Bubbles, gaps, or blisters often arise (Fig. 2), but the membrane seems to be locally flat and not in such strong or close contact. Only close contact quenches and darkens the fluorescent probe (Fig. 6). After tens of minutes (Fig. 3) such quenching occurs spontaneously in topographical patterns of ripples or stipples (Fig. 4). Adhesion within the dark regions is clearly so strong that it locks these patterns in place (Fig. 5, A′ and _C_′), despite clear evidence of lateral mobility (Figs. 3 and 5). Importantly, the time delay between the initial metastable bound state and the subsequent patterned ground state suggests that these two states are separated by a significant energy barrier.
FIGURE 10.
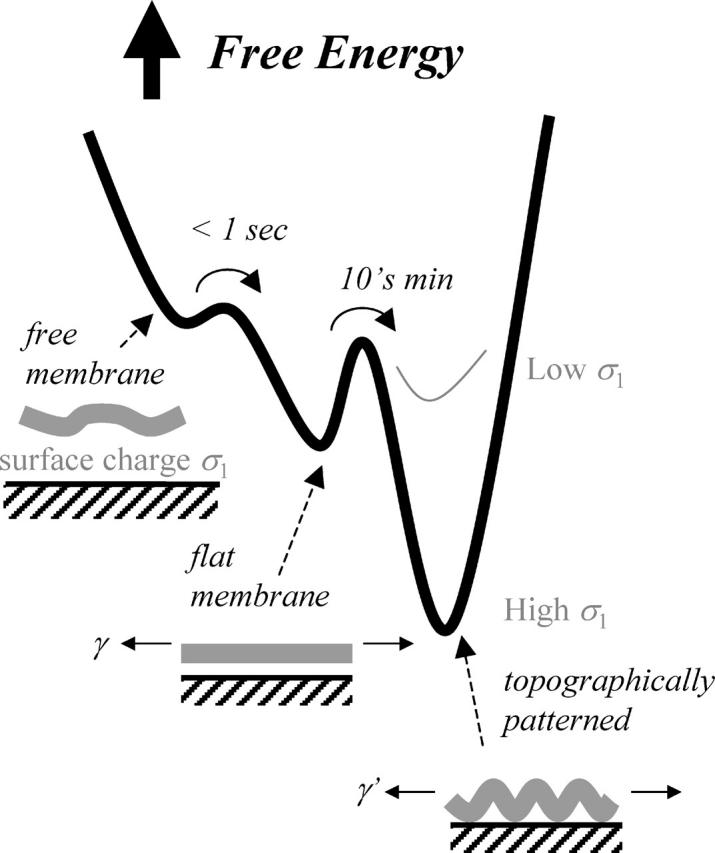
Free energy schematic for adhesion and two-stage topographical pattern formation in strong adhesion of the red cell membrane. If membrane tension, γ, exceeds _γ_lysis, the cell ruptures but the pattern persists.
The initial dynamics here of blister formation within an otherwise flat membrane are consistent with similar structures seen between two charged multicomponent lipid membranes, one of which was supported on glass (Nardi et al., 1997, 1998). The blisters also appear consistent with similar structures between the fluid and very flexible membranes of two red cells bound by both specific and nonspecific interactions (Coakley et al., 1999). Especially in the work on vesicles by Nardi et al. (1997, 1998), the role of counterions trapped in the gaps was suggested to compensate charges on the membrane while also generating an osmotic pressure. Over times of just seconds, this tends to drive blister enlargement, fusion, and frequent escape into bulk (Fig. 2). Here, on longer timescales, rippled or stippled patterns emerge in fluorescence imaging that are generally distinct from the simple blisters (Figs. 3–9). Arguably, this latter state is the most equilibrated bound state (Fig. 10), having allowed plenty of time for lipid diffusion to have occurred. Within this conceptual framework, an initial understanding is given below of both the poly-L-lysine dependence of the transition from unpatterned to patterned membrane and also the electrostatic nature of the adhesion. There is additional room for theory (and experiment) to gain understanding of the roles of glycocalyx compressibility, membrane bending, etc.
Rippling transition after long times: scaling with poly-L-lysine length
In the experiments on red cells here, the positive charge of surface-immobilized poly-L-lysine (of varied density _σ_1) attracts the mobile negative charge of the erythrocyte membrane (having constant density  ). The strength of the interaction increases with _σ_1 through increases in poly-L-lysine's concentration C. Sufficient _σ_1 also establishes a threshold for topographic patterns. In related experiments on charged vesicles adhering to a supported bilayer of opposite charge (Nardi et al., 1998), vesicle charge was readily varied by addition of lipid, and a threshold for the charge densities of the vesicle and substrate was detected for pattern formation. Coakley et al. (1999) likewise reported a “bifurcation” for gap formation within erythrocyte-erythrocyte adhesions. The thick black line in Fig. 8 reveals such a transition here to ripples and stipples that is dependent on C; the cooperative enhancement with increasing N of poly-L-lysine (per Eq. 1) is also understandable since it can make _σ_1 large at a molecular scale and thus foster zipping up in adhesion. Chain conformation in adsorption provides some explanation.
Scaling theories for polyelectrolyte adsorption onto charged substrates in salt-free solution have appeared (e.g., Borisov et al., 1994), but with added salt, the Coulomb repulsion within a chain is screened and chains are increasingly flexible. When adsorbed to a surface, the two-dimensional configurations scale with a radius of gyration R per well-known Flory theory as R ∼ Nβ where β = ¾. This agrees with the scaling reported in Eq. 1 where α = 0.76 (±0.10). The scaling seems a first clue that the conformation of poly-L-lysine contributes directly to the net-positive surface-charge density, _σ_1, which attracts the negatively charged cell membrane to the poly-L-lysine surface. Since poly-L-lysine's mass concentration C dictates the positive charge on the surface, it is expected that σ_1 = C/ζ, where the function ζ = ζ (R, …). This function indicates how much of the positive charge per area derived from the polymer chain is available for interacting with negative charge on the red cell (+z direction) as opposed to interacting just with negative charge on the glass (−_z direction), which is a fixed constant. Our conclusion from the scaling is that ζ is effectively linear in R, which seems a remarkably simple result. Understanding this result more deeply is beyond the scope of the present work, however.
Patterning transitions over long times: electrostatics
Electrostatic interactions are certainly central to membrane pattern formation based on the dependence of adhesion on C and N of poly-L-lysine. Isotonic sucrose also eliminates the patterning (Fig. 7 A) and thus highlights the importance of counterion entropy and perhaps the associated osmotic pressure. Debye-Hückel theory should thus apply in some form to the surface charges and counterions, and this should couple to the mechanics of membrane adhesion. This leads to a number of predictions that prove insightful for the red cell studies here. A first prediction is that topographical patterning occurs only after the limiting charge density exceeds a threshold. Recently established theory explains a threshold and gives estimates of overall energetics if not separate estimates for the two bound states of Fig. 10.
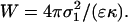
Topographical patterns—whether blisters or ripples—are expected to form (Nardi et al., 1998) in a strongly adherent membrane when a critical charge density σ* is exceeded per
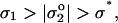 |
(2) |
|---|
where σ* = ɛ κ k_B_T/4_π e_ in terms of ɛ = 80_ɛ_o, the inverse Debye length is _κ_−1 ∼ 10−9 m (for 150 mM salt), and e is the electronic charge. For the present case, σ* ∼ 0.001 C/m2. The effective charge density  that dominates on the red cell membrane is attributed to sialic acid groups of the glycocalyx that can be removed by enzymatic treatments such as neuraminidase; the extra charge due to added Fl-PE lipid is estimated to be negligibly small compared to σ*, which is consistent with the fact that patterning in strong adhesion occurs regardless of Fl-PE addition (e.g., Fig. 9 B). The glycocalyx charge has been estimated by various means, with low frequency electrorotation of fixed red cells providing one recent measurement of
  (Georgieva et al., 1998). This charge density clearly satisfies the latter inequality of Eq. 2.
Estimation of the effective _σ_1 is complicated by the fact that a fraction ζ of the positive charge on the adsorbed poly-L-lysine—probably a small fraction—interacts with the cell instead of glass. Given C and N, a maximum _σ_1 can be calculated from estimates of poly-L-lysine deposited on the surface (see Materials and Methods): for 10 mg/ml of 3.8 kDa poly-L-lysine,  which is well above both σ* and
  and thus consistent with Eq. 2. A better estimate can probably be made by assuming that the mobile charges on the membrane are most important and accumulate in the adhesion zone (Fig. 3) to balance the fixed charge on the substrate. Nardi et al. (1998) show that
 |
(3) |
|---|
where φ is the average wetting angle of intact cells. In Fig. 8, cells with a spherical cap shape are typical just above the transition line (e.g., 10 mg/ml of 3.8 kDa poly-L-lysine). Hategan et al. (2003) determined φ = 60°. Eq. 3 thus yields _σ_1 = 5.33 | |, which is indicative of an excess of positive charge from poly-L-lysine and therefore pattern formation (per Eq. 2).
An electrostatic energy density in the limit of strong adhesion is also shown by Nardi et al. (1998) to be approximated as
 |
(4) |
|---|
From the estimations above, W ∼ 103 J/m2. The important comparison is to the spreading pressure
 |
(5) |
|---|
which can be determined by knowing the adhesion-induced membrane tension γ ≈ 0.8 mN/m (Hategan et al., 2003). Note that the membrane tension had been accurately determined by lysis times on the surface compared to lysis times while holding a red cell in a micropipette at a fixed tension. The result is reasonable because γ cannot exceed the “instantaneous” lysis tension of 10 mN/m for red cells. From Eq. 5, one obtains S ∼ 10−3 J/m2, which translates to a mechanical adhesion energy per cell of SA_contact ∼ 107 k_B_T. This is a large energy and clearly indicative of strong cell adhesion. However, dividing this by the 107 – 108 lipids in the contact zone gives molecular adhesion energies of ∼_k_B_T. This is key to explaining why lipid mobility is impeded but not eliminated in strong adhesion here (Figs. 3 and 5).
The estimations above clearly show S ≪ W, which is the limit expected for strong adhesion and topographical patterning as elaborated in Nardi et al. (1997, 1998). The lower value for the classic Young-Dupre S indicates that electrostatic interactions in W do not fully enter into mechanical aspects of membrane adhesion. Nardi et al. (1997, 1998) go on to show that component segregation within the membrane plane leads to pockets of diffusing counterions, accounting for some of the energy difference (W_–_S). The finding here that pattern formation does not occur in sucrose and seems to require counterions (Fig. 7) is very consistent with this conclusion.
The estimations above all clearly indicate strong adhesion, but do not distinguish the metastable bound state (with occasional blisters) from the rippled state of Fig. 10. The time delay between the initially uniform (sometimes blistered) adhesion state and the subsequent rippled state has suggested a significant energy barrier between the two stages or states. This can be understood in part as working against the adhesion-induced tension γ that opposes the excess area creation needed for topographical roughness. Regardless of such tension, the unsupported small gaps of the membrane allow the membrane to locally fluctuate, if slightly, and are thus entropically favored as are gaps filled with liberated rather than condensed counterions.
Domains and topography in red cell adhesion
In monolayer studies on lipids isolated from the red cell, Keller et al. (1998) have concluded that lipid bilayers of a red blood cell are near a miscibility critical point. An external interaction here such as strong adhesion might thus push the system to de-mix. Whereas Baumgart et al. (2003) have recently demonstrated the long-theorized coupling (Lipowsky and Sackmann, 1995) between membrane topography or curvature and phase separation in phospholipid vesicles (Baumgart et al., 2003), past studies on adhering red cells have focused more on just the topography. Transmission electron microscopy has previously shown that red cells kept suspended in poly-L-lysine solutions of various molecular weights (N ≈ 10 to 225 kDa) not only aggregate, but also show a contact region with spatially periodic contacts (Thomas et al., 1992). These gaps decrease in lateral separation from 1.6 to 0.8 microns as the concentration of the bulk poly-L-lysine is raised from 0.5 to 1 mg/ml. Likewise, the contact between a flexible erythrocyte and a rigid yeast cell in the presence of N ≈ 14 kDa or 175 kDa poly-L-lysine (C ∼ 0.005 mg/ml) also shows spatially discrete contact regions of spacing 0.83 _μ_m by transmission-electron microscopy (Hewison et al., 1988). Such static results prove similar to the poly-L-lysine-induced adhesion in an erythrocyte-erythrocyte system of Thomas et al. (1992). The yeast surface may better simulate the rigid surfaces here, since the yeast wall's elastic modulus (∼400 kPa; see Gad et al., 1997) far exceeds that of the erythrocyte membrane (∼1 kPa elastic modulus; see Evans and Skalak, 1980). It is also true, however, that the yeast wall with its long mannose chains is more complex than the simply positively charged hard surface of poly-L-lysine on glass, as used here. Extrapolating, nonetheless, from the published transmission-electron microscopy data, our dense poly-L-lysine layer appears consistent in leading to submicron gaps in red cell membrane contact.
Since the glycocalyx of the red cell defines its exoface, it is the first to interact with the charged poly-L-lysine surface. The presence of glycocalyx should generally dictate a finite separation between poly-L-lysine and the membrane lipid-protein bilayer. Indeed, studies on red cells attached to a less dense poly-L-lysine substrate (C ≈ 0.5 mg/ml bulk and N ≈ 10 kDa) indicate a separation of ∼12 nm (Braun and Fromherz, 1997). Taking into consideration the height resolution of RICM (∼5 nm) as well as the much stronger electrostatic interaction between a denser poly-L-lysine layer and the cell membrane, this distance should be smaller, on average, and the evident topographical variations clearly explain why the fluorescent dyes are partially quenched.
Although the evolution toward an adhesive pattern here takes many minutes, the process seems driven downhill in free energy. The immune synapse—where receptors on highly active T-cells organize in concert over many minutes with counter-receptors on antigen presenting cells—has indeed been shown to obey a Landau-Ginzburg dynamic (Qi et al., 2001). In addition to specific receptor interactions that incorporate disparate receptor lengths and flexibility, membrane bending and tension are integral to the free energy that is minimized in giving experimentally observed adhesive patterns. The patterns here on red cells are seen in lysed and fused membranes as well as intact cells under tension, which implies little to no role for tension in pattern formation.
Many of the above ideas have their origins in Helfrich's thinking about adhesion of soft, flexible membranes (Lipowsky and Sackman, 1995) with no need for metabolic input. Mobile adhesion receptors or “stickers” readily couple into the patterning (Lipowsky, 1996), and cooperative binding would tend to impede dynamics, leading over time to relatively static but rippled patterns as shown here. Metabolic input into the adhesion of nearly all other cells, including those that form focal adhesions or immune synapses, is a complicating factor that is not so clearly or easily addressed as with the red cells here.
CONCLUSIONS
The results here illustrate the behavior of a complex but passive biological membrane during and after adhesion to a dense, positive-charged polymer surface. As a consequence of the expectedly strong electrostatic interaction between the membrane's anionic groups and the positively charged surface, both lipids and proteins are shown to form macroscopic patterns. After the strong adhesion and spreading that is shown by RICM to be complete in <1 s, the fluorescent lipid Fl-PE in red cell membrane shows topographically rippled, worm-like network domains with a width of up to ∼500 nm. While the lipid remains fluid and laterally exchangeable, pattern formation and its structure are dependent on both the concentration of the poly-L-lysine and its molecular weight. Adhesion-induced rearrangements are seen with an integral membrane protein (Band 3) and more weakly with a peripheral protein (skeleton actin). Importantly, poly-L-lysine is shown to be uniform under cells, at similar length scales. Implications of the topographical pattern formation for either red cell adhesion or adhesion of more active cells with reinforcement by focal adhesions or synapses of various sorts need further exploration.
Acknowledgments
Support for this work is from a National Institutes of Health grant, NIH-R01, to D.D.
Alina Hategan's permanent address is Electron Accelerator Lab, National Institute for Lasers, Plasma, and Radiation Physics, 76900 Magurele, Bucharest, Romania.
References
- Albersdorfer, A., T. Feder, and E. Sackmann. 1997. Adhesion-induced domain formation by interplay of long-range repulsion and short-range attraction force: a model membrane study. Biophys. J. 73:245–257. [DOI] [PMC free article] [PubMed] [Google Scholar]
- Baker, A. J., W. T. Coakley, and D. Gallez. 1993. Influence of polymer concentration and molecular weight and of enzymic glycocalyx modification on erythrocyte interaction in dextran solutions. Eur. Biophys. J. 22:53–62. [DOI] [PubMed] [Google Scholar]
- Baumgart, T., S. T. Hess, and W. W. Webb. 2003. Imaging coexisting fluid domains in biomembrane models coupling curvature and line tension. Nature. 425:821–824. [DOI] [PubMed] [Google Scholar]
- Ben-Tal, N., B. Honig, R. M. Peitzsch, G. Denisov, and S. McLaughlin. 1996. Binding of small basic peptides to membranes containing acidic lipids: theoretical models and experimental results. Biophys. J. 71:561–575. [DOI] [PMC free article] [PubMed] [Google Scholar]
- Bernard, A. L., M. A. Guedeau-Boudeville, L. Jullien, and J. M. di Meglio. 2000. Strong adhesion of giant vesicles on surfaces: dynamics and permeability. Langmuir. 16:6809–6820. [Google Scholar]
- Borisov, O. V., E. B. Zhulina, and T. M. Birshtein. 1994. Polyelectrolyte molecule conformation near a charged surface. J. Phys. II France. 4:913–929. [Google Scholar]
- Braun, D., and P. Fromherz. 1997. Fluorescence interference-contrast microscopy of cell adhesion on oxidized silicon. Appl. Phys. A. 65:341–348. [Google Scholar]
- Carrier, D., H. H. Mantsch, and P. T. Wong. 1990. Protective effect of lipidic surfaces against pressure-induced conformational changes of poly(L-lysine). Biochemistry. 29:254–258. [DOI] [PubMed] [Google Scholar]
- Carrier, D., and M. Pezolet. 1986. Investigation of polylysine-dipalmitoylphosphatidylglycerol interactions in model membranes. Biochemistry. 25:4167–4174. [DOI] [PubMed] [Google Scholar]
- Clague, M. J., and R. J. Cherry. 1989. A comparative study of band 3 aggregation in erythrocyte membranes by melittin and other cationic agents. Biochim. Biophys. Acta. 980:93–99. [DOI] [PubMed] [Google Scholar]
- Coakley, W. T., L. A. Hewison, and D. Tilley. 1985. Interfacial instability and the agglutination of erythrocytes by polylysine. Eur. Biophys. J. 13:123–130. [DOI] [PubMed] [Google Scholar]
- Coakley, W. T., D. Gallez, E. Ramos de Souza, and H. Gauci. 1999. Ionic strength dependence of localized contact formation between membranes: nonlinear theory and experiment. Biophys. J. 77:817–828. [DOI] [PMC free article] [PubMed] [Google Scholar]
- Darmani, H., and W. T. Coakley. 1991. Contact patterns in concanavalin A agglutinated erythrocytes. Cell Biophys. 18:1–13. [DOI] [PubMed] [Google Scholar]
- Denisov, G., S. Wanaski, P. Luan, M. Glaser, and S. McLaughlin. 1998. Binding of basic peptides to membranes produces lateral domains enriched in the acidic lipids phosphatidylserine and phosphatidylinositol 4,5-biphosphate: an electrostatic model and experimental results. Biophys. J. 74:731–744. [DOI] [PMC free article] [PubMed] [Google Scholar]
- Discher, D. E., and N. Mohandas. 1996. Kinematics of red cell aspiration by fluorescence-imaged microdeformation. Biophys. J. 71:1680–1694. [DOI] [PMC free article] [PubMed] [Google Scholar]
- Evans, E. A., and R. Skalak. 1980. Mechanics and Thermodynamics of Biomembranes. CRC Press, Boca Raton, FL.
- Franzin, C., and P. M. Macdonald. 2001. Polylysine-induced 2H NMR-observable domains in phosphatidylserine/phosphatidylcholine lipid bilayers. Biophys. J. 81:3346–3362. [DOI] [PMC free article] [PubMed] [Google Scholar]
- Gad, M., A. Itoh, and A. Ikai. 1997. Mapping cell wall polysaccharides of living microbial cells using atomic force microscopy. Cell Biol. Int. 21:697–706. [DOI] [PubMed] [Google Scholar]
- Georgieva, R., B. Neu, V. M. Shilov, E. Knippel, A. Budde, R. Latza, E. Donath, H. Kiesewetter, and H. Baumler. 1998. Low frequency electrorotation of fixed red blood cells. Biophys. J. 74:2114–2120. [DOI] [PMC free article] [PubMed] [Google Scholar]
- Golan, D. E., and W. Veatch. 1980. Lateral mobility of band 3 in the human erythrocyte membrane studied by fluorescence photobleaching recovery: evidence for control by cytoskeletal interactions. Proc. Natl. Acad. Sci. USA. 77:2537–2541. [DOI] [PMC free article] [PubMed] [Google Scholar]
- Goodman, S. R., K. E. Krebs, C. F. Whitfield, B. M. Riederer, and I. S. Zagon. 1988. Spectrin and related molecules. CRC Crit. Rev. Biochem. 23:171–234. [DOI] [PubMed] [Google Scholar]
- Grakoui, A., S. K. Bromley, C. Sumen, M. M. Davis, A. S. Shaw, P. M. Alen, and M. L. Dustin. 1999. The immunological synapse: a molecular machine controlling T-cell activation. Science. 285:221–227. [DOI] [PubMed] [Google Scholar]
- Hategan, A., R. Law, S. Kahn, and D. E. Discher. 2003. Adhesively tensed cell membranes: lysis kinetics and atomic force microscopy probing. Biophys. J. 85:2746–2759. [DOI] [PMC free article] [PubMed] [Google Scholar]
- Hewison, L. A., W. T. Coakley, and H. W. Meyer. 1988. Spatially periodic discrete contact regions in polylysine-induced erythrocyte-yeast adhesion. Cell Biophys. 13:151–157. [DOI] [PubMed] [Google Scholar]
- Hill, T. L. 1985. Cooperativity Theory in Biochemistry. Steady State and Equilibrium Systems. Springer-Verlag, New York, Berlin, Heidelberg, Tokyo.
- Hillery, C. A., J. P. Scott, and M. C. Du. 1999. The carboxy-terminal cell-binding domain of thrombospondin is essential for sickle red blood cell adhesion. Blood. 94:302–309. [PubMed] [Google Scholar]
- Johnson, S. J., T. M. Bayerl, W. Weihan, H. Noack, J. Penfold, R. K. Thomas, D. Kanellas, A. R. Rennie, and E. Sackmann. 1991. Coupling of spectrin and polylysine to phospholipid monolayers studied by specular reflection of neutrons. Biophys. J. 60:1017–1025. [DOI] [PMC free article] [PubMed] [Google Scholar]
- Keller, S. L., W. H. Pitcher, W. H. Huestis, and H. M. McConnell. 1998. Red blood cell lipids form immiscible liquids. Phys. Rev. Lett. 81:5019–5022. [Google Scholar]
- Kleinschmidt, J. H., and D. Marsh. 1997. Spin-label electron spin resonance studies on the interaction of lysine peptides with phospholipids membranes. Biophys. J. 73:2546–2555. [DOI] [PMC free article] [PubMed] [Google Scholar]
- Leckband, D., Y. L. Chen, and J. Israelachvili. 1993. Measurements of conformational changes during adhesion of lipid and protein (polylysine and S-layer) surfaces. Biotechnol. Bioeng. 42:167–177. [DOI] [PubMed] [Google Scholar]
- Lipowsky, R. 1996. Adhesion of membranes via anchored stickers. Phys. Rev. Lett. 77:1652–1655. [DOI] [PubMed] [Google Scholar]
- Lipowsky, R., and E. Sackmann. 1995. Structure and Dynamics of Membranes. Generic and Specific Interactions. Elsevier Press, Amsterdam, Lausanne, New York, Oxford, Shannon, Tokyo.
- Middelkoop, E., B. H. Lubin, J. A. Op den Kamp, and B. Roelofsen. 1986. Flip-flop rates of individual molecular species of phosphatidylcholine in the human red cell membrane. Biochim. Biophys. Acta. 855:421–424. [DOI] [PubMed] [Google Scholar]
- Mohandas, N., and E. Evans. 1989. Rheological and adherence properties of sickle cells. Potential contribution to hematologic manifestations of the disease. Ann. N. Y. Acad. Sci. 565:327–337. [DOI] [PubMed] [Google Scholar]
- Nardi, J., T. Feder, R. Bruinsma, and E. Sackmann. 1997. Electrostatic adhesion between fluid membranes: phase separation and blistering. Europhys. Lett. 37:371–376. [Google Scholar]
- Nardi, J., R. Bruinsma, and E. Sackmann. 1998. Adhesion-induced reorganization of charged fluid membranes. Phys. Rev. E. 58:6340–6354. [Google Scholar]
- Noppl-Simson, D. A., and D. Needham. 1996. Avidin-biotin interactions at vesicle surfaces: adsorption and binding, cross-bridge formation and lateral interactions. Biophys. J. 70:1391–1401. [DOI] [PMC free article] [PubMed] [Google Scholar]
- Oldenborg, P. A., A. Zheleznyak, Y. F. Fang, C. F. Lagenaur, H. D. Gresham, and F. P. Lindberg. 2000. Role of CD47 as a marker of self on red blood cells. Science. 288:2051–2054. [DOI] [PubMed] [Google Scholar]
- Petrov, J. G., J. Ralston, M. Schneemilch, and R. A. Hayes. 2003a. Dynamics of partial wetting and dewetting in well-defined systems. J. Phys. Chem. 107:1034–1045. [Google Scholar]
- Petrov, J. G., J. Ralston, M. Schneemilch, and R. A. Hayes. 2003b. Dynamics of partial wetting and dewetting of an amorphous fluoropolymer by pure liquids. Langmuir. 19:2795–2801. [Google Scholar]
- Picart, C., and D. E. Discher. 1999. Actin protofilament orientation at the erythrocyte membrane. Biophys. J. 77:865–878. [DOI] [PMC free article] [PubMed] [Google Scholar]
- Ploem, J. S. 1975. Reflection contrast microscopy as a tool for investigation of the attachment of living cells to a glass surface. In Mononuclear Phagocytes in Immunity, Infection and Pathology. Blackwell Scientific Publications, Oxford, UK.
- Qi, S. Y., J. T. Groves, and A. K. Chakraborty. 2001. Synaptic pattern formation during cellular recognition. Proc. Natl. Acad. Sci. USA. 98:6548–6553. [DOI] [PMC free article] [PubMed] [Google Scholar]
- Rolfe, M., A. Parmar, T. G. Hoy, and W. T. Coakley. 2001. Erythrocyte agglutination by wheat germ agglutinin: ionic strength dependence of the contact seam topology. Mol. Membr. Biol. 18:169–176. [DOI] [PubMed] [Google Scholar]
- Sackmann, E., and R. Bruinsma. 2002. Cell adhesion as wetting transition? Chem. Phys. Phys. Chem. 3:262–269. [DOI] [PubMed] [Google Scholar]
- Sackmann, E., and T. Feder. 1995. Budding, fission and domain formation in mixed lipid vesicles induced by lateral phase separation and macromolecular condensation. Mol. Membr. Biol. 12:21–28. [DOI] [PubMed] [Google Scholar]
- Salhany, J. M., R. L. Sloan, and K. S. Cordes. 2003. The carboxyl side chain of glutamate 681 interacts with a chloride binding modifier site that allosterically modulates the dimeric conformational state of band 3 (AE1). Implications for the mechanism of anion/proton co-transport. Biochemistry. 42:1589–1602. [DOI] [PubMed] [Google Scholar]
- Scheffer, L., A. Bitler, E. Ben-Jacob, and R. Korenstein. 2001. Atomic force pulling: probing the local elasticity of the cell membrane. Eur. Biophys. J. 30:83–90. [DOI] [PubMed] [Google Scholar]
- Seifert, U., and R. Lipowsky. 1990. Adhesion of vesicles. Phys. Rev. A. 42:4768–4771. [DOI] [PubMed] [Google Scholar]
- Setty, B. N., S. Kulkarni, and M. J. Stuart. 2002. Role of erythrocyte phosphatidylserine in sickle red cell-endothelial adhesion. Blood. 99:1564–1571. [DOI] [PubMed] [Google Scholar]
- Takahashi, H., S. Matuoka, S. Kato, K. Ohki, and I. Hatta. 1991. Electrostatic interaction of poly(L-lysine) with dipalmitoylphosphatidic acid studied by x-ray diffraction. Biochim. Biophys. Acta. 1069:229–234. [DOI] [PubMed] [Google Scholar]
- Tanaka, M., S. Kaufmann, J. Nissen, and M. Hochrein. 2001. Orientation selective immobilization of human erythrocyte membranes on ultrathin cellulose films. Phys. Chem. Chem. Phys. 3:4091–4095. [Google Scholar]
- Thomas, N. E., W. T. Coakley, and G. Akay. 1992. The lateral separation of contacts of erythrocytes agglutinated by polylysine. Cell Biophys. 20:125–147. [DOI] [PubMed] [Google Scholar]
- Thomas, N. E., and W. T. Coakley. 1995. Localized contact formation by erythrocyte membranes: electrostatic effects. Biophys. J. 69:1387–1401. [DOI] [PMC free article] [PubMed] [Google Scholar]
- Trommler, A., D. Gingell, and H. Wolf. 1985. Red blood cells experience electrostatic repulsion but make molecular adhesions with glass. Biophys. J. 48:835–841. [DOI] [PMC free article] [PubMed] [Google Scholar]
- Tuvia, S., A. Almagor, A. Bitler, S. Levin, R. Korenstein, and S. Yedgar. 1997. Cell membrane fluctuations are regulated by medium macroviscosity: evidence for a metabolic driving force. Proc. Natl. Acad. Sci. USA. 94:5045–5049. [DOI] [PMC free article] [PubMed] [Google Scholar]
- Wolf, H., and D. Gingell. 1983. Conformational response of the glycocalyx to ionic strength and interaction with modified glass surfaces: study of live red cells by interferometry. J. Cell Sci. 63:101–112. [DOI] [PubMed] [Google Scholar]
- Wolkers, W. F., M. G. van Kilsdonk, and F. A. Hoekstra. 1998. Dehydration-induced conformational changes of poly-L-lysine as influenced by drying rate and carbohydrates. Biochim. Biophys. Acta. 1425:127–136. [DOI] [PubMed] [Google Scholar]
- Wong, A. P., and J. T. Groves. 2001. Topographical imaging of an intermembrane junction by combined fluorescence interference and energy transfer microscopies. J. Am. Chem. Soc. 123:12414–12415. [DOI] [PubMed] [Google Scholar]
- Wong, A. P., and J. T. Groves. 2002. Molecular topography imaging by intermembrane fluorescence resonance energy transfer. Proc. Natl. Acad. Sci. USA. 99:14147–14152. [DOI] [PMC free article] [PubMed] [Google Scholar]
- You, H., and L. Yu. 1997. Investigation of the image contrast of tapping-mode atomic force microscopy using protein-modified cantilever tips. Biophys. J. 73:3299–3308. [DOI] [PMC free article] [PubMed] [Google Scholar]