The Hydrodynamic Radii of Macromolecules and Their Effect on Red Blood Cell Aggregation (original) (raw)
Abstract
The effects of nonionic polymers on human red blood cell (RBC) aggregation were investigated. The hydrodynamic radius (_R_h) of individual samples of dextran, polyvinylpyrrolidone, and polyoxyethylene over a range of molecular weights (1500–2,000,000) were calculated from their intrinsic viscosities using the Einstein viscosity relation and directly measured by quasi-elastic light scattering, and the effect of each polymer sample on RBC aggregation was studied by nephelometry and low-shear viscometry. For all three polymers, despite their different structures, samples with _R_h <4 nm were found to inhibit aggregation, whereas those with _R_h >4 nm enhanced aggregation. Inhibition increased with _R_h and was maximal at ∼3 nm; above 4 nm the pro-aggregant effect increased with _R_h. For comparison, the _R_h of 12 plasma proteins were calculated from literature values of intrinsic viscosity or diffusion coefficient. Each protein known to promote RBC aggregation had _R_h >4 nm, whereas those with _R_h <4 nm either inhibited or had no effect on aggregation. These results suggest that the influence of a nonionic polymer or plasma protein on RBC aggregation is simply a consequence of its size in an aqueous environment, and that the specific type of macromolecule is of minor importance.
INTRODUCTION
The aggregation behavior of human red blood cells (RBCs) has been studied for decades, with the pioneering rheologic studies of Fåhræus (1921, 1929) among the first to describe the phenomenon. The effects of RBC aggregation on blood rheology are well known. In normal blood at stasis, or flowing at low-shear rates, RBCs spontaneously aggregate, forming long linear stacks (known as “rouleaux”) and large three-dimensional structures that cause a marked increase in the blood viscosity. This process is fully reversible: the rouleaux are easily disrupted by the shear forces that arise as the flow rate increases, but reappear as soon as such forces are removed. This shear-dependent variation in its microscopic structure is the primary cause of the characteristic non-Newtonian, shear-thinning flow behavior of human blood (Merrill, 1969; Chien, 1975). RBC aggregation is often significantly increased in disease states (Hardwicke and Squire, 1952; Lowe, 1988; Olshaker and Jerrard, 1997). In medical practice, RBC aggregation is usually measured indirectly via the erythrocyte sedimentation rate (ESR), a simple test in which a sample of anticoagulated blood is drawn into a narrow vertical tube and left to stand (Westergren, 1921). RBC aggregation in the stationary blood leads to the formation of multicellular aggregates which, due to their larger Stokes radii, sediment more rapidly than single RBCs (Fåhræus, 1921). After precisely 1 h, the height of the clear plasma layer visible above the RBC fraction (although not strictly a “rate”) is usually taken as the ESR result.
RBC aggregation is known to be a consequence of the presence of high-molecular weight proteins in the plasma, primarily fibrinogen (340,000) and immunoglobulins IgM (950,000) and IgG (150,000). These proteins are present at baseline levels in health, and thus some degree of RBC aggregation is an invariable finding in blood from normal donors, the rate and extent of which varies from individual to individual. In disease, a high ESR is usually associated with an elevated plasma fibrinogen concentration (Hardwicke and Squire, 1952; Lowe, 1988), but occasionally occurs due to increased IgM levels (Waldenstrom's macroglobulinemia) or very high concentrations of IgG or IgA, such as may occur in myeloma (MacKenzie and Babcock, 1975; Preston et al., 1978; Imaizumi and Shiga, 1983). Several other large plasma proteins, such as ceruloplasmin (135,000), haptoglobin (multiple isoforms from 100,000-900,000) and _α_-2 macroglobulin (725,000) have also been shown to aggregate RBCs or to enhance fibrinogen-mediated aggregation in vitro (Ruhenstroth-Bauer et al., 1962; Schmid-Schönbein et al., 1973; Weng et al., 1996). Small proteins such as hemoglobin and albumin (65,000 and 66,000) do not induce RBC aggregation in their native state (Rampling and Martin, 1992), but albumin oligomers (Forsdyke et al., 1982) and polymerized hemoglobin (average molecular weight >200,000) (Tsai and Wong, 1996; Sakai et al., 2000) are strongly pro-aggregant. These observations suggest that the effects of any protein on RBC aggregation may depend mostly upon its size, rather than any particular functional or structural property.
Nonionic polymers such as polysaccharides and synthetic polymers also promote RBC aggregation when infused in vivo or added to suspensions of RBCs in buffer or plasma in vitro. Examples of polymers that induce human RBC aggregation are dextrans of molecular weights 60,000–500,000, polyvinylpyrrolidone of 360,000, and polyoxyethylene (POE) of 20,000 and above (Hardwicke and Squire, 1952; Hint, 1971; Sewchand and Canham, 1979; Sewchand and Bruckschwaiger, 1980; Geller et al., 1981; Nash and Meiselman, 1983; Donner et al., 1993; Armstrong et al., 2002). In general, for each of these polymers, the aggregating potential tends to increase with degree of polymerization (dP) and hence the molecular weight, but the precise relationship is polymer-specific, and varies over an order of magnitude for different polymer types.
A less widely recognized property of these same nonionic polymers is that fractions with a lower dP (or molecular weight) can inhibit RBC aggregation. Studies in the 1950s and 1960s with dextran fractions showed a strong dose-dependent and molecular weight-dependent reduction of aggregation when added to blood in vitro, with a detectable effect on ESR at ∼10,000 and a maximum inhibitory effect at 30,000 (Ruhenstroth-Bauer et al., 1962; Hint, 1964; Richter, 1966; Hint, 1971). In vivo, solutions of 40,000 dextran reduced RBC aggregation and low-shear viscosity after infusion into experimental animals or hospitalized patients (Thorsén and Hint, 1950; Bergan et al., 1965; Hint, 1969). This observation led to the realization that administration of a 40,000 dextran (e.g., “RheoMacrodex,” Pharmacia, Sweden) was advantageous when an improvement in blood flow was specifically required, whereas a higher molecular weight dextran (e.g., 70,000 “Macrodex”) was preferable when plasma volume expansion was the primary goal (Arturson et al., 1964; Hint, 1969), because it has a longer circulation time. More recently, Geller et al. (1981) showed that 4000–6000 POE strongly inhibits RBC aggregation in whole blood. This observation is consistent with the known rheologic effects of poloxamer 188, an 8400 triblock copolymer composed of 80% POE and 20% polyoxypropylene, which reduces RBC aggregation in blood in vitro and in vivo (Toth et al., 1997, 2000), and has shown some benefit as an infusible agent to improve blood rheology in sickle cell disease (Orringer et al., 2001).
It is clear that there is a connection between the size of both proteins and nonionic polymers and their effects on RBC aggregation, but it is also clear that the relationship is not simply a function of molecular weight or dP per se, since the molecular weight ranges at which different types of polymer induce or inhibit RBC aggregation overlap significantly. For example, when added to whole blood, 6000 POE inhibit RBC aggregation, whereas 20,000 promote aggregation, but for dextran, the equivalent effects are seen at 20,000–30,000 and 60,000, respectively. These differences should be expected, since the relationship between the molecular weight of a polymer and its physicochemical properties when dissolved in an aqueous solution depends upon numerous factors, such as the formula weight of the monomer, the types of intermonomer bonds, the flexibility of the polymer chain, the degree of branching, intermolecular interactions, and the degree of expansion of the polymer chain by the solvent. This study was designed to systematically evaluate the effects of three different nonionic water-soluble polymers on the inhibition or promotion of RBC aggregation in human blood and in polymer solutions, and in particular, to test the hypothesis that the hydrodynamic radius of a polymer is the principal determinant of its effect on RBC aggregation. The results support this hypothesis, and provide a rational basis for the use of such polymers to either promote or inhibit RBC aggregation for research or therapeutic applications.
MATERIALS AND METHODS
Polymers
Polyoxyethylene (POE) samples of discrete molecular weights from 1450 to 1,000,000, commonly known as poly(ethylene glycol) (PEG) for molecular weights <20,000 or as poly(ethylene oxide) (PEO) for molecular weights >20,000, and polyvinylpyrrolidone (PVP) samples of molecular weights from 2500 to 360,000, were purchased from Sigma-Aldrich (St. Louis, MO), Fluka Chemical (Ronkonoma, NY), and PolySciences (Warrington, PA). Dextran fractions with molecular weights from 10,000 to 2,000,000 were purchased from Sigma Chemical and Pharmacia Fine Chemicals (Uppsala, Sweden). Lyophilized human fibrinogen was purchased from IMCO (Stockholm, Sweden) and human serum albumin, as a 30% w/v solution, was obtained from Sigma. The molecular mass (weight average, _M_w) of each polymer was provided by the supplier, with intrinsic viscosities determined experimentally (see below).
Determination of hydrodynamic radius, _R_h
Stock polymer solutions of 10, 50, 100, or 200 mg/ml were prepared at 25°C in phosphate-buffered saline (PBS, 10 mM phosphate, pH 7.4, 290 mOsm/kg). All solutions were clear without evidence of insoluble material. Ten serial dilutions of each stock solution were prepared on a v/v basis and the viscosity of each solution was measured in triplicate at 25°C using a calibrated Coulter Capillary Viscometer II (Coulter Electronics, Luton, UK). The intrinsic viscosity, [_η_] (ml/g), of polymer solutions was determined by extrapolation of specific viscosity (_η_sp) divided by concentration, versus concentration to infinite dilution:
 |
(1) |
|---|
where _η_sp = (η − _η_0)/_η_0, η = viscosity of polymer solution, _η_0 = viscosity of solvent (PBS = 0.90 mPa.s at 25°C), and C = concentration of polymer (g/cm3).
The hydrodynamic radius _R_h was calculated according to the Einstein viscosity relation, modeling the hydrated polymer molecules in terms of equivalent hydrodynamic spheres that would increase the viscosity to the same extent as solid spherical particles of volume _V_e:
 |
(2) |
|---|
where M = polymer molecular weight (g/mol), N = Avogadro's number, and _V_e = the volume of an equivalent spherical particle (cm3). Since  rearrangement of Eq. 2 gives:
 |
(3) |
|---|
This equation is effectively identical to the Flory-Fox expression for the root-mean-squared end-to-end distance of polymer molecules in solution:  (Flory and Fox, 1951). The constant φ for polymer molecules in a good solvent has been found experimentally to have a value of 2.1 × 10²¹ (Flory, 1953). Thus, the equivalent value for
  for each polymer is simply 3.1-fold greater than _R_h.
Hydrodynamic radii were also determined using quasi-elastic light scattering (QELS) measurements (MiniDAWN Tristar and QELS; Wyatt Technology, Santa Barbara, CA). All measurements were performed at room temperature (25°C), with an aqueous mobile phase (100 mM NaNO3, 2 mM phosphate buffer, pH 7.4). All data were analyzed using a dedicated software package (Astra, version 4.90.07, Wyatt Technology, Santa Barbara, CA).
Experimental design
Two series of experiments were designed to study the effects of each molecular weight fraction of dextran, POE, and PVP on red blood cell aggregation in plasma. The first series was conducted at a fixed concentration of 5 mg/ml of each polymer. In the second series, the amount of each polymer added to the plasma was varied to maintain the suspending phase at a constant viscosity: the concentration of each polymer required was calculated using the Huggins equation:
 |
(4) |
|---|
where _η_d = desired viscosity and _η_o = initial (plasma) viscosity; a value of 0.4 was used for the Huggins constant k. To increase the viscosity by 21% from a baseline of 1.42 ± 0.04 mPa.s (mean ± SD for five donor samples) the concentrations ranged from 0.73 mg/ml for POE of 300,000 up to 45 mg/ml for dextran of 9500 (Table 1), which corresponds to a polymer volume fraction of 0.078. The final suspending phase viscosity (1.76 ± 0.08 mPa/s) was similar for all samples regardless of molecular weight or polymer type, but slightly higher than the predicted value (1.72 mPa.s), perhaps because the initial plasma viscosity was treated as a pure solvent viscosity, neglecting the volume fraction occupied by the plasma proteins.
TABLE 1.
The molecular weight, intrinsic viscosity [_η_], and equivalent sphere hydrodynamic radius, _R_h, (Eq. 1), for each of the polymers used in this study
| Polymer | Molecular weight ( ) (kg/mol)* ) (kg/mol)* |
Intrinsic viscosity [_η_] (ml/g) | Hydrodynamic radius _R_h (nm) | CSV concentration (mg/ml) |
|---|---|---|---|---|
| POE | 1.45 | 6.29 | 1.13 | 30.98 |
| POE | 2.0 | 7.88 | 1.36 | 24.74 |
| POE | 3.35 | 10.70 | 1.79 | 18.23 |
| POE | 5.0 | 15.17 | 2.29 | 12.85 |
| POE | 6.45 | 14.86 | 2.48 | 10.06 |
| POE | 7.5 | 19.37 | 2.85 | 8.33 |
| POE | 8.50 | 18.37 | 2.92 | 6.50 |
| POE | 11.84 | 22.59 | 3.49 | 6.00 |
| POE | 22.80 | 31.81 | 4.87 | 6.59 |
| POE | 29.60 | 45.45 | 5.98 | 5.21 |
| POE | 35.0 | 51.28 | 6.59 | 3.80 |
| POE | 100 | 107.3 | 11.95 | 1.82 |
| POE | 300 | 266.8 | 23.36 | 0.73 |
| POE | 600 | 374.5 | 32.95 | † |
| POE | 1000 | 452.8 | 41.62 | † |
| Dextran | 9.5 | 4.27 | 1.86 | 45.64 |
| Dextran | 19.5 | 10.97 | 3.24 | 17.76 |
| Dextran | 39.1 | 17.57 | 4.78 | 11.10 |
| Dextran | 73.0 | 23.52 | 6.49 | 8.29 |
| Dextran | 110 | 27.34 | 7.82 | 7.13 |
| Dextran | 250 | 37.87 | 11.46 | 5.15 |
| Dextran | 500 | 50.50 | 15.90 | 3.86 |
| Dextran | 2000 | 61.11 | 26.89 | 3.19 |
| PVP | 2.5 | 4.70 | 1.23 | 41.47 |
| PVP | 10.0 | 6.30 | 2.16 | 30.93 |
| PVP | 29.0 | 16.40 | 4.23 | 11.88 |
| PVP | 40.0 | 20.79 | 5.10 | 9.38 |
| PVP | 55.0 | 20.57 | 5.65 | 9.48 |
| PVP | 360 | 118.7 | 18.95 | 1.64 |
| Albumin (HSA) | 66 | 4.11 | 3.51 | 47.42 |
| Fibrinogen | 340 | 24.28 | 10.95 | 8.03 |
In addition to the studies in plasma, a third series of experiments was carried out to examine RBC aggregation for washed cells suspended in a solution of 0.25 to 3.0% w/v of each polymer sample in PBS.
Blood sample preparation
After obtaining informed consent, blood was drawn by venipuncture from healthy adult donors and anticoagulated with EDTA (1.5 mg/mL); the study was approved by the University of Southern California Institutional Review Board. For studies of RBCs suspended in plasma, the hematocrit of the blood was adjusted to 40 ± 1% via addition of either autologous plasma or packed RBC; hematocrit values were determined using the microhematocrit method (14,000 × g, 4 min). An appropriate volume of stock polymer solution in PBS was added to an aliquot of the RBC suspension to yield the desired plasma polymer concentration; an equivalent volume of polymer-free PBS was added to the controls. For studies with RBCs suspended in polymer solutions, RBCs were washed twice with PBS (1400 × g, 6 min), then resuspended in 0.25 to 3.0% (w/v) polymer in PBS to a final hematocrit of 40 ± 1%. Concentrations of 0.25 to 1.5% (w/v) were used for medium- to high-molecular weight polymers, and concentrations of 1.5 and 3.0% (w/v) were used for low-molecular weight polymers. All experiments were completed within 8 h of venipuncture. Microscopic examination of all RBC suspensions showed normal discocytic cell morphology.
Aggregation and viscometry measurements
The extent of RBC aggregation at stasis for cells suspended in various media was determined at room temperature using a computerized Myrenne aggregometer (Roetgen, Germany; Bauersachs et al., 1989). This instrument consists of a transparent horizontal plate and rotating cone between which the blood sample is placed, with a light source and photocell arranged vertically (i.e., perpendicular to the plane of the cone and plate) to measure light transmission through the sample. The Myrenne “_M_” aggregation parameter is determined as follows: The sample is first exposed to a brief period of high shear (600 s−1) to disrupt any preexisting RBC aggregates. The rotation is then stopped, and the light transmittance through the blood sample is recorded for 10 s; the average change in light transmission over this period is taken as the M value (units are arbitrary). If no aggregation occurs, then the light transmission remains constant, and M = 0. Aggregation of the RBCs reduces scattering and allows more of the light to reach the photocell, giving a positive M value, the magnitude of which increases with the degree of aggregation. For the studies where the polymers were dissolved in plasma, a “normalized” M index was determined by dividing the M value of the test samples by the M value for the RBCs in polymer-free plasma. An M index value of greater than unity thus reflects an increase in aggregation, whereas a value of <1 indicates a reduction of aggregation relative to that observed for plasma alone. Triplicate M values were averaged for each sample tested.
For RBCs suspended in polymer/PBS solutions, the aggregation was also measured using the Myrenne system, and the apparent viscosity was determined at 25°C using a Contraves LS-30 Couette viscometer (Contraves AG, Basel, Switzerland). The shear rate was varied in discrete steps, and the resulting torque was recorded for ∼10 s and extrapolated back to time zero to compensate for syneresis (Cokelet, 1972). The ratio of the viscosity measured at low shear rate (0.15 s−1) to that measured at high shear rate (94.5 s−1) was used as a viscometric index of RBC aggregation (Chien, 1975). As with the M index, this ratio increases with enhanced aggregation. The viscosity of plasma samples was determined at 25°C using a Coulter capillary viscometer.
RESULTS
Polymer characteristics
Intrinsic viscosities [_η_] and hydrodynamic radii _R_h calculated from the intrinsic viscosity data are shown in Table 1. Comparison of these polymers by molecular weight indicates that intrinsic viscosities follow the order POE ≫ PVP ≥ dextran, indicating that a considerably greater volume is occupied by each hydrated POE chain, thus the _R_h values are significantly larger for POE molecules than for PVP or dextran at an equivalent molecular weight.
For expanded flexible polymer chains, the intrinsic viscosity is related to molecular weight by an empirical relation, the Mark-Houwink equation (Eq. 5), where K and a are constants for a given polymer type (Flory, 1953):
 |
(5) |
|---|
Table 2 shows the experimental values of K and a for the three polymers. For each series, the correlation coefficient was >0.97 and the values for K and a show good agreement with literature values (Grönwall, 1957; Bailey and Koleske, 1967; Hint, 1971; Salamova et al., 1996; Güner and Ataman, 1997).
TABLE 2.
Mark-Houwink parameters K and a from Eq. 5
| Polymer | K × 10−3 | a | _R_2 |
|---|---|---|---|
| Polyoxyethylene | 0.4915 | 0.67 | 0.995 |
| Dextran | 1.3608 | 0.45 | 0.986 |
| Polyvinylpyrrolidone | 0.1874 | 0.66 | 0.950 |
Although in theory it is preferable to use a viscometer that allows extrapolation of the data back to zero shear, the use of a clinical capillary viscometer that only measures at one fixed shear stress did not appear to cause any practical difficulty. The main disadvantage of the intrinsic viscosity method to determine _R_h is that the average molecular mass of the polymer must be known in advance. Molecular mass data for polymers are usually available from the supplier, but their reliability may vary from one provider to the next. In contrast, an absolute method, such as QELS, does not require any additional information, since _R_h is derived directly from the diffusion coefficient. To assess the significance of possible errors in the stated molecular mass, the hydrodynamic radii obtained by the intrinsic viscosity method were compared with those determined directly by QELS. Both methods showed good agreement for all three polymers (correlation coefficient = 0.964), and the _R_h and  were comparable with literature values (Bailey and Koleske, 1967; Salamova et al., 1996; Güner and Ataman, 1997). Thus, the intrinsic viscosity-based method for estimating hydrodynamic radii appears to be suitable for this type of study, and has the advantage that it requires only a simple capillary viscometer, rather than expensive and specialized light-scattering apparatus.
Aggregation versus polymer molecular weight
The effects of POE, dextran, or PVP molecular weight on red blood cell aggregation for RBCs suspended in plasma are presented in Fig. 1. The two sets of data on each panel show the effects of the polymers at a constant concentration (CC) of 5 mg/ml (open symbols) and at a constant suspending phase viscosity (CSV) (solid symbols). The general trends for both experiments were very similar for each of the three polymer types, i.e., low-molecular weight samples inhibited RBC aggregation and high-molecular weight samples promoted RBC aggregation, with the magnitude of either inhibition or promotion dependent on the concentration of polymer in solution. However, as expected, the transition from inhibition to promotion of aggregation was seen at a different molecular weight for each polymer type (POE ≈ 15,000, PVP ≈ 20,000, and dextran ≈ 40,000).
FIGURE 1.
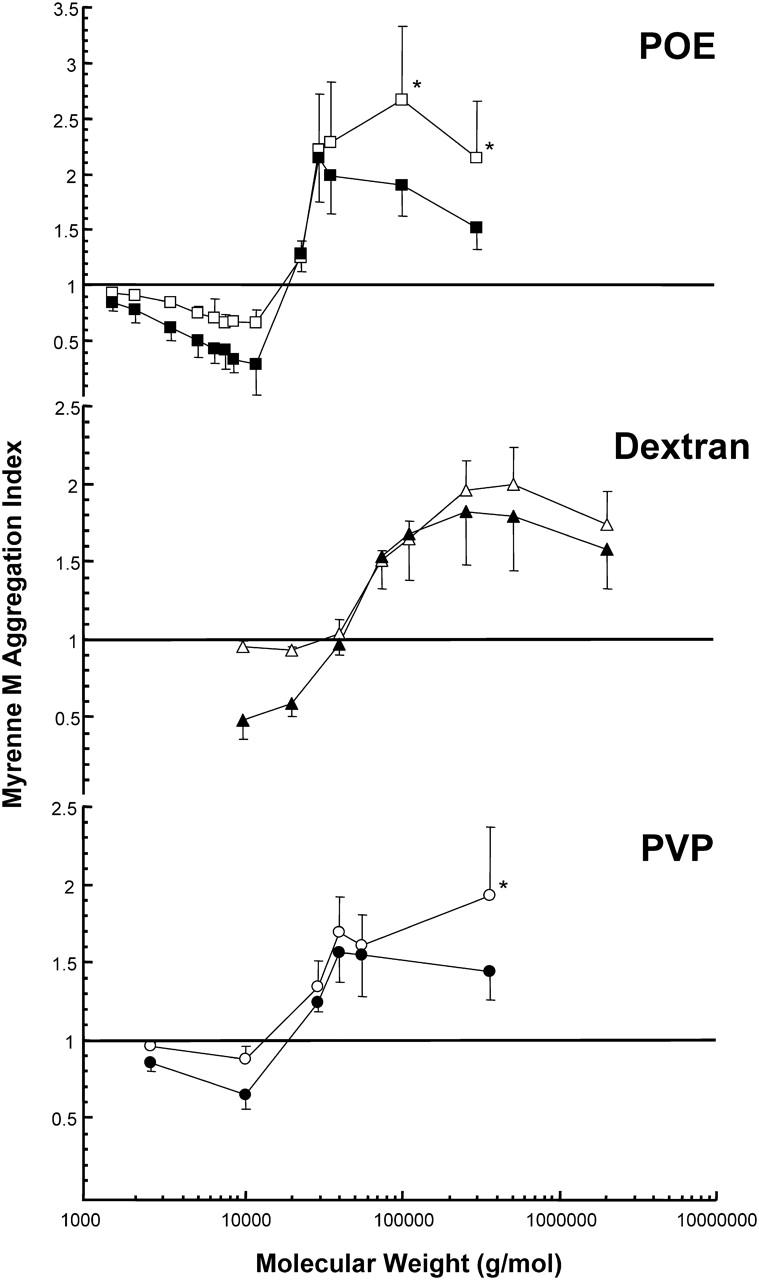
The effect of POE, dextran, and PVP on red blood cell aggregation for cells suspended in plasma (n = 5, mean ± SD) as a function of molecular weight. Data are normalized by control values; a value >1 indicates enhanced aggregation; a value <1 indicates inhibition of aggregation. Open symbols represent a fixed polymer concentration of 5 mg/mL (* = 2.5 mg/mL) and solid symbols represent a fixed suspending phase viscosity of 1.76 mPa.s. The transition from anti- to pro-aggregant occurs at a different molecular mass for each polymer type (POE ≈ 15,000, PVP ≈ 20,000, and dextran ≈ 40,000).
RBCs suspended in polymer-free PBS do not aggregate, and thus gave a Myrenne M value of zero and a low-shear/high-shear viscosity ratio of ∼1.3 (i.e., near-Newtonian flow behavior). Fig. 2 A illustrates the Myrenne data for RBCs in polymer/PBS solutions. No aggregation was detected (i.e., M = 0) for cells in low-molecular weight polymer solutions, but above a certain molecular weight there is an abrupt onset of aggregation, reflected in positive M values. Viscometric data for these suspensions (Fig. 2 B) are consistent with the Myrenne results: below a polymer-specific molecular weight, essentially no aggregation is detected and the viscosity ratio is the same as for cells in polymer-free PBS; above the critical molecular weight there is a marked increase of the ratio. Despite the different nature of the suspending phase (i.e., protein-free buffer), the threshold molecular weight for each polymer studied was the same as that found for the RBC-plasma suspensions (Fig. 1).
FIGURE 2.
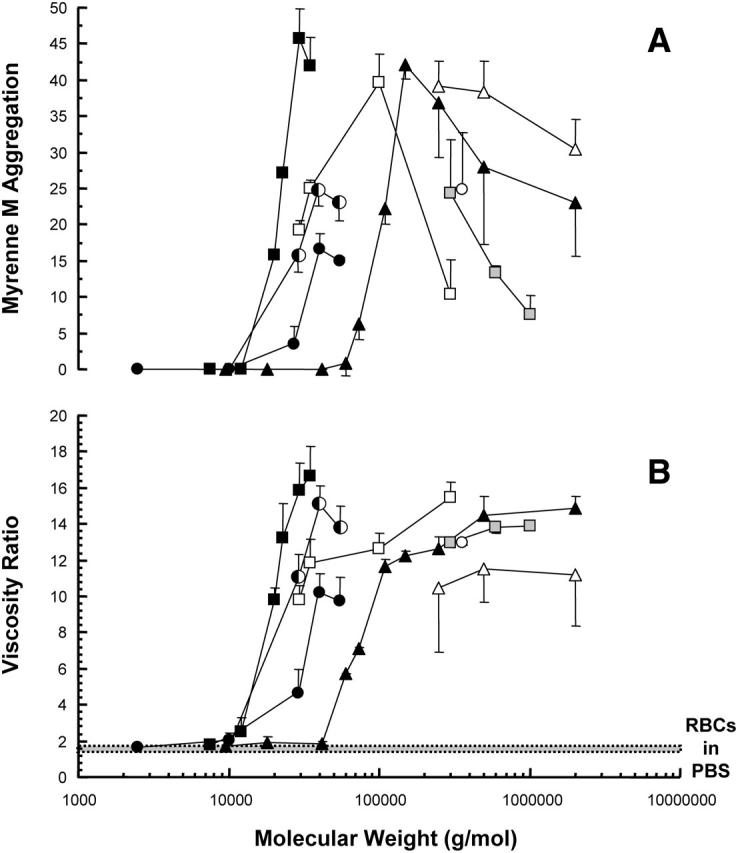
The effect of POE (□), dextran (▵), and PVP (○) on red blood cell aggregation (A) and blood viscosity (B) for cells suspended in polymer solution (n = 5 ± SD) as a function of molecular weight. Polymer concentrations are 3% w/v (half-solid symbols), 1.5% w/v (solid symbols), 0.5% w/v (open symbols), and 0.25% w/v (shaded symbols). The ratio of low-shear viscosity (0.15 s−1) to high-shear viscosity (94.5 s−1) provides a viscometric index of RBC aggregation. The transition from a nonaggregating to an aggregating-suspension occurs at a different molecular weight for each polymer type.
Aggregation versus polymer hydrodynamic radius
Although each polymer showed a similar biphasic relationship between molecular weight and aggregation, the relative displacement of the three curves in Fig. 1 confirmed that the precise relationship with molecular weight was different for each polymer type. In Fig. 3, the aggregation and viscometry results are compared to the hydrodynamic radius, a measure of the size of the polymer molecule calculated from its apparent volume in solution (Eq. 2). It can be seen that the three curves are superimposed, and that the transition from inhibition to promotion of aggregation (or nonaggregating to aggregating for cells suspended in polymer solutions) occurs at ∼4 nm for each polymer type. Thus, for all three polymers, molecular weight fractions with _R_h <4 nm inhibited RBC aggregation, whereas those with _R_h >4 nm promoted RBC aggregation. In the region below the 4-nm threshold, inhibition of aggregation progressively increased with _R_h, with the maximum inhibitory effect between 2 and 3 nm. This is most clearly illustrated by the POE data, because a wider range of discrete molecular weight samples was available, but the general trend was also the same for dextran and PVP. The inhibitory effect was greater in the CSV experiments, presumably because in the size range up to 4 nm, the polymer concentration required to reach the desired viscosity was higher than the 5 mg/mL used for the CC experiments (see Table 1).
FIGURE 3.
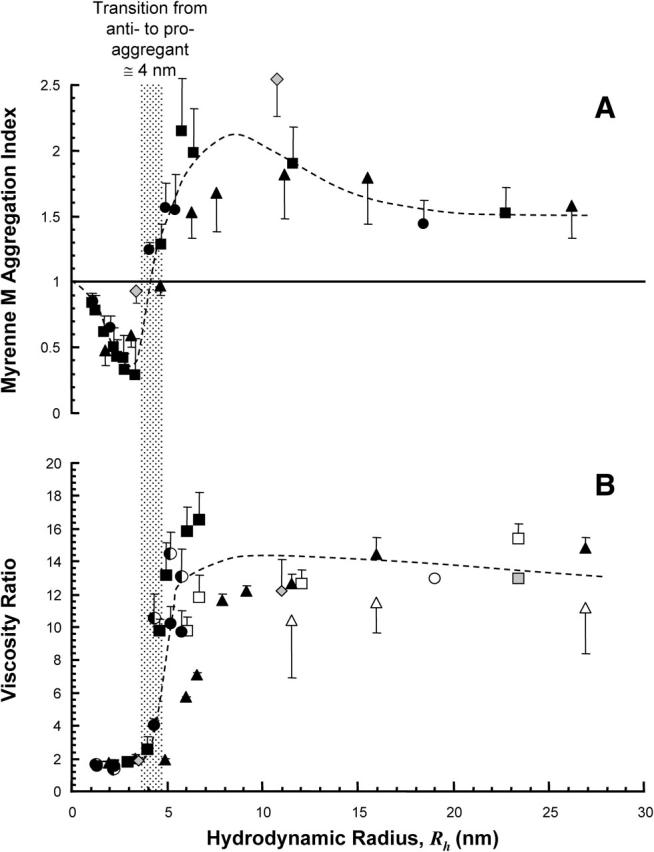
The effect of POE (□), dextran (▵), and PVP (○) on red blood cell aggregation for cells suspended in plasma (A) and blood viscosity (B) for cells suspended in polymer solution (n = 5 ± SD) as a function of hydrodynamic radius (_R_h). For cells suspended in polymer solution, polymer concentrations are 3% w/v (half-solid symbols), 1.5% w/v (solid symbols), 0.5% w/v (open symbols), and 0.25% w/v (shaded symbols). The effects of albumin and fibrinogen (shaded diamond) are shown for comparison. The shaded bar shows the transition from an anti- to a proaggregating system occurring at a hydrodynamic radius of ∼4 nm for all macromolecules studied.
Aggregation versus protein hydrodynamic radius
Addition of exogenous albumin and fibrinogen to plasma also showed effects consistent with those observed for nonionic polymers (Fig. 3 A). Albumin (_R_h = 3.5 nm) did not promote aggregation, whereas fibrinogen (_R_h = 11.0 nm) caused strong aggregation. These data suggested the possibility that a similar _R_h versus aggregation relationship might also be applicable to plasma proteins. To evaluate this hypothesis further, the hydrodynamic radii of 12 different plasma proteins were calculated (Table 3) using physicochemical data from published sources (Björk and Lindh, 1974; Masson, 1976; Ahmad and McPhie, 1980; Lentner, 1984; Kilar et al., 1985; Jossang et al., 1988; Fronticelli et al., 2001). For consistency with the polymer data, Eq. 3 was used for the 10 proteins for which intrinsic viscosities were available from the literature; there was very close agreement between the viscosity-derived _R_h and the Stokes radii calculated from the diffusion coefficient (D) and sedimentation coefficient (S) (Eqs. 6 and 7). In the absence of intrinsic viscosity data for IgA and haptoglobin, the _R_h values were derived from _D_20,w and _S_20,w respectively:
 |
(6) |
|---|
 |
(7) |
|---|
where η and ρ are the viscosity and density of water at 20°C, and  partial specific volume.
TABLE 3.
Comparison of the hydrodynamic radii of plasma proteins and their relative influence on RBC aggregation, and summary of the primary data from which the relative influence on RBC aggregation was deduced
| Protein |  (g/mol) (g/mol) |
Intrinsic viscosity [_η_] (ml/g) | Hydrodynamic radius (_R_h) (nm) | RBC aggregation (0 – 4+) |
|---|---|---|---|---|
| Hemoglobin A | 65,000 | 3.06 | 3.18 | 0/inhibition |
| Human serum albumin | 66,000 | 4.11 | 3.51 | inhibition |
| _α_-1 Acid glycoprotein | 44,000 | 6.9 | 3.64 | 0 |
| Transferrin | 76,000 | 4.4 | 3.72 | 0 |
| _α_-1 Antitrypsin | 51,000 | 6.8 | 3.81 | 0 |
| Ceruloplasmin | 135,000 | 4.4 | 4.56 | + |
| IgG | 150,000 | 6.2 | 5.29 | + |
| IgA (monomer) | 162,000 | (D20,w = 3.3) | 6.50 | ++ |
| Haptoglobin (multiple isoforms) | 100–900k | (S20,w = 4.4–7.5) | 4.7–25.0 | +++ |
| Fibrinogen | 340,000 | 24.3 | 10.95 | +++ |
| IgM | 950,000 | 13.4 | 12.65 | +++ |
| _α_-2 Macroglobulin | 725,000 | 6.8 | 9.22 | ++++ |
| Study | Method | Medium | Relative effect on aggregation |
|---|---|---|---|
| Ruhenstroth-Bauer et al. (1962) | ESR | Buffer | Fibrinogen > haptoglobin > ceruloplasmin > transferrin = gamma globulin = albumin (no effect) |
| Ruhenstroth-Bauer et al. (1962) | ESR | Plasma | Fibrinogen > haptoglobin > ceruloplasmin > gamma globulin > transferrin (minimal effect) > albumin (inhibition) |
| Weng et al. (1996) | Light scattering | Plasma | Haptoglobin > fibrinogen ≫ ceruloplasmin > _α_-1 acid glycoprotein = _α_-1 antitrypsin (no effect) |
| Imaizumi and Shiga (1983) | Observation under shear | Diluted plasma | IgM > fibrinogen > IgA > IgG |
| Schmid-Schönbein et al. (1973) | Observation under shear | Serum | _α_-2 Macroglobulin > IgM > IgA, IgG |
| Tsai and Wong (1996) | ESR | Plasma | Polymerized hemoglobin ⋙ hemoglobin (no effect) |
The 12 proteins were chosen because their influence on RBC aggregation has been evaluated either directly or indirectly (Ruhenstroth-Bauer et al., 1962; Schmid-Schönbein et al., 1973; Imaizumi and Shiga, 1983; Tsai and Wong, 1996; Weng et al., 1996; Menu et al., 2000). The use of different methodologies and protein concentrations in these studies precludes a direct numerical comparison of the effects of all 12 proteins on RBC aggregation, but since at least one protein was common to two or more studies, it was possible to summarize their effects semiquantitatively (Table 3, column 5). This revealed a relationship between RBC aggregation and plasma protein _R_h which was remarkably similar to that observed for the nonionic polymers: proteins <4 nm (hemoglobin, albumin, _α_-1 acid glycoprotein, and _α_-1 antitrypsin) either have no effect or inhibit aggregation when added to plasma; those >4 nm (e.g., ceruloplasmin, IgG, and IgA) enhance RBC aggregation in plasma and may also cause aggregation in buffer; and the large proteins (fibrinogen, haptoglobin, _α_-2 macroglobulin, IgM) are strongly pro-aggregating in plasma or buffer.
DISCUSSION
The three nonionic polymers used in this study have very different molecular structures and physicochemical properties. The polysaccharide dextran is a polymer of glucose molecules joined mostly by linear α(1→6) linkages but with a few branching α(1→4) linkages. POE and PVP are synthetic polymers: POE is a linear polymer of ethylene oxide units linked by ether bonds, and PVP has a linear alkyl backbone with pendant pyrrolidone groups. The molecular weights of the monomeric units of dextran, POE, and PVP are 179, 44, and 111, respectively. Thus, at the same molecular weight, the dP varies significantly (up to fourfold) among these different polymers, and since the backbone of each polymer contains different chemical bonds, the length and flexibility of the molecule would be different even at the same dP or molecular weight. Also, each polymer may have a different affinity for water and expand to a greater or lesser degree when dissolved. Thus, even at the same molecular weight or dP, when dissolved in buffer or plasma the three polymers will have dissimilar sizes, and thus would not be expected to, and did not, show similar effects on RBC aggregation.
The key finding of this study was that the different polymers showed very similar effects on RBC aggregation when compared on the basis of their hydrodynamic radius, a measurement that reflects the contribution of all the above-mentioned physicochemical properties. Specifically, samples of all three polymers with _R_h <4 nm inhibited aggregation, whereas those with _R_h >4 nm promoted RBC aggregation. The ability of the smaller polymers to inhibit aggregation increased with _R_h, with a maximum effect between 2 and 3 nm. Whether there is a significant difference in the inhibitory “potency” of the different polymers at their optimum _R_h is unclear from this study, since they could not be directly compared at the same molar concentration, and also because the dextran and PVP samples (especially the latter) were more polydisperse than the POE samples, and thus contained a broader mixture of molecules of different sizes.
For all polymers, the inhibitory effect became less evident above 3 nm until there was no effect on aggregation at 4 nm. Above 4 nm, the aggregating increased with _R_h, reaching a maximum somewhere between 6 and 12 nm, despite the decrease in molar concentration for the CC experiments and mass concentration for the CSV experiments. For polymers with _R_h >12 nm, both the Myrenne and viscometric measures of aggregation were lower than the maximum value, but it is not obvious that this reflects a true decrease in the aggregating “potential” of the suspending phase. Microscopically, aggregation was clearly evident, and the aggregates tended to form rounded and compressed clumps rather than elongated rouleaux. Such differences in aggregate morphology have been noted previously, e.g., with RBCs exposed to _α_-2 macroglobulin (Schmid-Schönbein et al., 1973), or suspended in solutions of hemoglobin polymers or conjugates (Sakai et al., 2000), and suggest that the net aggregating “force” may in fact be greater with these very large macromolecules. Although very high molecular weight polymers have a large effect on solution viscosity, the difference between the samples studied at CC and CSV clearly shows that the apparent decrease in aggregation is not simply an artifact of the suspending phase viscosity. However, other possible measurement artifacts may affect the Myrenne data for large polymers, such as incomplete disruption of strongly interacting RBCs at high shear rates, a nonuniform cell concentration gradient, or an anomaly due to non-Newtonian behavior of the suspending phase, and cannot be ruled out.
At present, there are two coexisting yet mutually exclusive “models” for red blood cell aggregation—the so-called “bridging” and “depletion” models. The bridging model proposes that RBC aggregation occurs when the attractive bridging force arising from the nonspecific adsorption of macromolecules onto adjacent cell surfaces exceeds the disaggregating forces due to electrostatic repulsion, membrane strain, and mechanical shearing (Brooks, 1973; Chien and Lang, 1987; Brooks, 1988). Chien has formalized this model using a force balance equation (Chien, 1975), and data for RBC surface adsorption of dextrans (Chien et al., 1977) and RBC intracellular separation as a function of dextran molecular weight (Chien and Jan, 1973) have been published. In contrast, depletion-mediated RBC aggregation is driven by a relatively lower concentration of protein or polymer in the fluid near the cell surface (termed the “depletion layer”) compared to the bulk-phase suspending medium. Aggregation occurs if the energy available from merging the depletion layers of adjacent cells is sufficient to overcome the steric and electrostatic repulsive forces arising from the RBC glycocalyx. The role of depletion-mediated particle aggregation in colloidal systems is well known (Asakura and Oosawa, 1954, 1958; Vrij, 1976; de Gennes, 1989; van Oss, 1994), and the theory has been extended to red blood cell aggregation (van Oss et al., 1990; Bäumler et al., 1999). It is important to note that the depletion model does not preclude some degree of polymer adsorption onto the RBCs; it is only necessary that the concentration of the polymer in the depletion layer must be less than the bulk solution (de Gennes, 1989; Bäumler et al., 2001).
Either model provides a possible mechanism for RBC aggregation, but neither has been explicitly verified by experiment. Although it may appear intuitive and simpler in concept, some features of RBC aggregation are difficult to reconcile in terms of the bridging model. One problem is simply the requirement for relatively strong nonspecific adsorption of the macromolecule (the origin or nature of which is unclear), which seems at odds with the observation that so many different types of polymer and large plasma proteins induce RBC aggregation. Another is the observation that aggregating RBCs slip quickly into a face-to-face rouleaux configuration after initial contact (McMillan et al., 1989). This phenomenon is not easily explained with a bridging mechanism, since it would call for a very rapid turnover of multiple attachment points, otherwise unstructured agglutinates would be observed rather than rouleaux. In contrast, with a depletion-mediated aggregation mechanism, the type of macromolecule in solution is essentially irrelevant: it is only necessary that a sufficiently large depletion layer be developed relative to the bulk-phase concentration. Also, since the attractive forces do not involve direct contact between the cell surfaces and the macromolecules, the RBCs can slide freely into a reduced energy configuration as seen in rouleaux. Several other lines of evidence favoring the depletion over bridging for polymer- or protein-mediated RBC aggregation have been discussed in detail in recent articles (Bäumler et al., 1996, 2001; Armstrong et al., 1999; Neu and Meiselman, 2001, 2002) but debate still continues as to the relative merits of each model.
Both the bridging and depletion models require the macromolecules to exceed a critical size in order to induce aggregation: For bridging, a macromolecule would clearly have to be large enough to span the gap between adjacent RBCs at their closest point of approach. Similarly, depletion-mediated aggregation would occur only if the depletion layer exceeds a certain minimum thickness, which is also a function of the size of the depleted macromolecules (Bäumler et al., 2001; Neu and Meiselman, 2001). Thus, superficially, the results of this present study appear to be consistent with either model. However, it is important to recognize that the hydrodynamic radius—the radius of a hypothetical hard sphere that would increase fluid viscosity the same amount (or diffuse at the same rate) as the molecule under examination—is merely an abstraction. In practice, most macromolecules in solution are not spherical and are in continuous motion, including rotation: the calculated _R_h thus represents an average “dynamic” size of these hydrated, tumbling, asymmetric molecules. Since the depletion layer results from the dynamic behavior of the macromolecules in solution, the depletion model of aggregation would predict that polymers with similar hydrodynamic radii should also have similar effects on aggregation. The same is not true for the bridging model, which assumes that the macromolecules are static, bound simultaneously to the surfaces of two adjacent cells. Different polymers or proteins, even if they have similar hydrodynamic radii in solution, may not exhibit the same relative dimensions when immobilized on a RBC surface, due to loss of entropy, stabilization of orientation (if asymmetrical), and differences in the length of polymer chain required to attach to the putative binding sites. Thus, for the bridging model, the effective “span” of the bridge would be expected to vary not only with _R_h but also with the polymer type. The close relationship between hydrodynamic radius and RBC aggregation observed in this study for all types of macromolecule therefore appears to support the depletion model more strongly than the bridging model.
With regard to the mechanism of the anti-aggregating effect of low-molecular weight polymers, the possible interpretations are again model-specific. The bridging model explanation is that macromolecules too small to form an intercellular bridge will reduce aggregation by competing for binding sites, interfering with the attachment of larger, bridging macromolecules. This explanation appears to be reasonable if the inhibiting and aggregating molecules are similar (e.g., low-molecular weight and high-molecular weight fractions of the same polymer), but it is much less plausible for polymers of different types. For example, it would follow that any small macromolecules that can reduce RBC aggregation in plasma, such as low-molecular weight dextran and POE, must somehow interfere with the nonspecific adsorption of fibrinogen and immunoglobulins despite the fact that they only bind weakly and nonspecifically themselves.
The depletion model allows for a generally neater and more convincing explanation for the inhibitory effect of smaller polymers, although the precise details still need to be worked out. RBCs are covered with a glycocalyx, which extends out several nanometers from the RBC membrane into the suspending phase, and contains large numbers of sialic acid residues providing a strong net negative charge. We hypothesize that small polymers (_R_h <4nm) can permeate the RBC glycocalyx. If true, then the depletion layer for these smaller molecules may not extend beyond the limits of the glycocalyx, thus adjacent RBCs would remain separated due to the mutual repulsion and aggregation would not occur. In a mixture containing both large (proaggregating) and small polymer molecules, the small molecules will tend to inhibit aggregation, since although the depletion layer of the larger polymer would still be present, the smaller polymer is not excluded from this region and will decrease the osmotic potential, reducing the attractive force between the cells (Neu et al., 2001).
Proteins are also polymers, but they are composed of amino acids with different side chains with different chemical properties, and are structurally much more complex than the simple nonionic polymers used in the experimental part of this study. The plasma proteins that were compared all have smaller _R_h values for their molecular weight than any of the nonionic polymers, indicating a much more compact structure. The 12 proteins also differ substantially from each other in terms of primary sequence, molecular weight, numbers of subunits, secondary structure (folding), and intramolecular and intersubunit cross-links, and contain different numbers of ionizable, hydrophobic or hydrophilic groups that might potentially influence their interaction with the RBC surface. Thus, it was remarkable that these proteins showed not only the same general relationship between _R_h and RBC aggregation, but also that the critical _R_h for aggregation was precisely the same as for the three nonionic polymers. Taken together, these results indicate that the hydrodynamic radius is by far the most important determinant of RBC aggregation, at least for nonionic polymers and most plasma proteins, and it seems reasonable to predict that this simple relationship between _R_h and aggregation will also be found for numerous other types of polysaccharides, proteins, and synthetic polymers.
An appreciation of the relationship between the effective size of a protein and RBC aggregation allows some earlier studies to be reinterpreted and better understood. For example, many investigators have noted the correlation between the increase in concentration of several plasma proteins seen after inflammation or trauma (the so-called acute-phase reactants) and an elevation of the ESR (Scherer et al., 1975; Kollmeier et al., 1972; Talstad et al., 1997). Some of the acute-phase proteins, such as fibrinogen and haptoglobin, are known to directly aggregate RBCs. Others, such as ceruloplasmin and C-reactive protein have been shown to enhance RBC aggregation when added to blood in vitro, but some acute-phase proteins, such as _α_-1 acid glycoprotein and _α_-1 antitrypsin, show no effect on aggregation in vitro (Weng et al., 1996) despite a strong correlation between their in vivo concentration and the ESR. These observations are fully consistent with the findings of this study: the hydrodynamic radii of the aggregating proteins, fibrinogen, haptoglobin, and ceruloplasmin (11.0, >25.0, and 4.6 nm, respectively) all exceed 4 nm, whereas the radii of _α_-1 acid glycoprotein (3.6 nm) and _α_-1 antitrypsin (3.8 nm) do not reach the 4-nm threshold for aggregation. It appears, therefore, that changes in the concentration of these small glycoproteins during the acute-phase response have no direct effect on the ESR, but rather reflect a parallel change in the concentration of fibrinogen or other large proteins.
The existence of a minimum _R_h for RBC aggregation also neatly explains the results of some other RBC aggregation studies, such as in vitro investigations into the effect of enzymatically cleaved fibrinogen. Incubation of fibrinogen with plasmin initially yields two fragments designated as X and Y (Marder et al., 1969) which are then further cleaved by plasmin to produce the end-stage products D and E. Studies of the effects of these fragments on the ESR (Hormann, 1975; Marsh, 1979), showed that fragment X retained a strong aggregating effect, though less than the native fibrinogen, fragment Y had a reduced effect, and fragments D and E had no demonstrable aggregating effect. These findings were later confirmed by direct observation with a rheoscope by Maeda et al. (1987), who suggested that the cleavage of fragments X and Y into D and E disrupts the binding site required for the interaction of fibrinogen with the RBC surface. The _R_h values for each fragment (from Marder et al., 1969, Table 4) suggest an explanation that is much simpler: the radii of fragments X and Y are relatively large, with X > Y, which is consistent with their effects on aggregation, but the radii of fragments D and E are both <4 nm, and thus they would not be expected to cause aggregation.
TABLE 4.
Comparison of the hydrodynamic radii of fibrinogen and its plasmin-generated fragments calculated from their diffusion coefficients ( )
)
| Diffusion coefficient (cm2/s × 107) | Hydrodynamic radius, _R_h (nm) | |
|---|---|---|
| Fibrinogen | 2.43 | 8.83 |
| Fragment X | 2.94 | 7.30 |
| Fragment Y | 3.64 | 5.89 |
| Fragment D | 5.79 | 3.70 |
| Fragment E | 5.70 | 3.76 |
Similarly, IgG molecules can be cleaved with pepsin or papain into Fc, Fab, or F(ab′)2 fragments. Unmodified IgG and the F(ab′)2 fragment accelerated RBC aggregation in 60% diluted plasma (Imaizumi and Shiga, 1983) but the Fc and Fab fragments had no accelerating effect, and, in another study (Izumida, 1991), were shown to inhibit aggregation. Table 5 contains representative _R_h values for these fragments, calculated from sedimentation coefficients from various sources (Fang and Mukkur, 1976; Jossang et al., 1988; Morgan et al., 1992; Carrasco et al., 2001). The F(ab′)2 fragment (_R_h = 4.48 nm) is large enough to promote RBC aggregation, but the Fc (_R_h = 3.19 nm) and Fab (_R_h = 2.91 nm) fragments are too small. Interestingly, the radii of the Fc and Fab fragments are in the appropriate size range for inhibition of aggregation (_R_h ≈ 3 nm), consistent with their reported inhibitory effects.
TABLE 5.
Comparison of the hydrodynamic radii of IgG and IgG fragments calculated from their sedimentation coefficients ( )
)
| Molecular weight (g/mol) | Sedimentation coefficient (Svedbergs) | Hydrodynamic radius (_R_h) (nm)* | |
|---|---|---|---|
| IgG | 150,000 | 6.6 | 5.41 |
| F(ab′)2 | 95,000 | 5.1 | 4.48 |
| Fc | 51,000 | 3.85 | 3.19 |
| Fab | 47,500 | 3.92 | 2.91 |
Blood from different animal species shows a great variability in the tendency of RBCs to aggregate. For example, horse blood shows a remarkably fast aggregation and a very high ESR (Popel et al., 1994) whereas bovine RBCs can only be induced to aggregate by adding supranormal concentrations of fibrinogen or by enzyme pretreatment (Kaibara, 1983). When suspended in the same aggregating medium (e.g., 3% dextran, 70,000), different human donors may show up to a twofold variation in their “intrinsic aggregation,” and even within the same subject, older RBCs show enhanced aggregability relative to younger RBCs (Meiselman, 1993; Rampling et al., 2003). These differences among individuals and species have long intrigued hemorheologists, since they should provide insight into the mechanisms and possible physiological role of RBC aggregation, but few hard facts have yet emerged. The methodologies presented herein may provide a useful additional tool for comparative studies of this type. If we are correct in our assumption that the ability of a polymer to promote or inhibit RBC aggregation depends primarily upon whether it is excluded from the glycocalyx, then the use of a series of well-characterized, near-monodisperse, polymer probes of increasing molecular mass to identify the _R_h threshold for aggregation will indicate the size exclusion limit for the glycocalyx (which may or may not relate to the glycocalyx thickness). An advantage of this technique is that it looks only for the critical _R_h at which aggregation occurs, not the magnitude of aggregation, and thus should be relatively independent of the precise methodology used to study aggregation.
In summary, this study demonstrates that nonionic polymers will only induce aggregation if they exceed a minimum absolute size, that this critical size (_R_h ∼4 nm) seems to be independent of polymer type, and that smaller polymer molecules of an optimal size (between 2 and 3 nm) are effective inhibitors of RBC aggregation. A similar relationship also appears to apply to the common plasma proteins, and may be generally applicable to many other types of macromolecules, such as modified starches or other polysaccharides (e.g., hydroxyethyl starch and ficoll), or modified proteins (e.g., gelatin, polymer-conjugated enzymes, polyhemoglobin, and engineered immunoglobulins). If this straightforward relationship is confirmed for other proteins and polymer types, it will simplify the interpretation of studies of RBC aggregation in various disease states, may provide another tool for comparative aggregation studies, and should provide a basis for the rational design of superior plasma volume expanders or other agents specifically designed to improve blood rheology.
Acknowledgments
This work was supported by National Institutes of Health research grants HL 15722, HL 48484, and HL 70595. Support for J.K.A. was provided by a Scholar Award from the National Institutes of Health-funded University of Southern California Comprehensive Sickle Cell Center (HL 48484 and HL 70595).
References
- Ahmad, F., and P. McPhie. 1980. The intrinsic viscosity of glycoproteins. Int. J. Biochem. 11:91–96. [DOI] [PubMed] [Google Scholar]
- Armstrong, J. K., H. J. Meiselman, and T. C. Fisher. 1999. Evidence against macromolecular “bridging” as the mechanism of red blood cell aggregation induced by nonionic polymers. Biorheology. 36:433–437. [PubMed] [Google Scholar]
- Armstrong, J. K., H. J. Meiselman, and T. C. Fisher. 2002. Red blood cell aggregation: the effect of nonionic polymers and the role of hydrodynamic root mean square radius of gyration. Biorheology. 39:611. (Abstr.) [Google Scholar]
- Arturson, G., K. Granath, L. Thorén, and G. Wallenius. 1964. The renal excretion of low molecular weight dextran. Acta Chir. Scand. 127:543–551. [PubMed] [Google Scholar]
- Asakura, S., and F. Oosawa. 1954. On interaction between two bodies immersed in a solution of macromolecules. J. Chem. Phys. 22:1255–1256. [Google Scholar]
- Asakura, S., and F. Oosawa. 1958. Interaction between particles suspended in solutions of macromolecules. J. Polymer Sci. 33:183–192. [Google Scholar]
- Bailey, F. E., Jr., and J. V. Koleske. 1967. Hydrodynamics of the polyoxyethylene chain. In Nonionic Surfactants, Vol 1. M. J. Shick, editor. Marcel Dekker, New York. 794–822.
- Bauersachs, R. M., R. B. Wenby, and H. J. Meiselman. 1989. Determination of specific red blood cell aggregation indices via an automated system. Clin. Hemorheol. 9:1–25. [Google Scholar]
- Bäumler, H., E. Donath, A. Krabi, W. Knippel, A. Budde, and H. Kiesewetter. 1996. Electrophoresis of human red blood cells and platelets. Evidence for depletion of dextran. Biorheology. 33:333–351. [DOI] [PubMed] [Google Scholar]
- Bäumler, H., B. Neu, E. Donath, and H. Kiesewetter. 1999. Basic phenomena of red blood cell rouleaux formation. Biorheology. 36:439–442. [PubMed] [Google Scholar]
- Bäumler, H., B. Neu, R. Mitlohner, R. Georgieva, H. J. Meiselman, and H. Kiesewetter. 2001. Electrophoretic and aggregation behavior of bovine, horse and human red blood cells in plasma and in polymer solutions. Biorheology. 38:39–51. [PubMed] [Google Scholar]
- Bergan, J. J., O. H. Trippel, H. A. Kaupp, J. C. Kukral, and W. F. Nowlin. 1965. Low molecular weight dextran in treatment of severe ischemia. Arch. Surg. 91:338–341. [Google Scholar]
- Björk, I., and E. Lindh. 1974. Gross conformation of human secretory immunogloublin A and its component parts. Eur. J. Biochem. 45:135–145. [DOI] [PubMed] [Google Scholar]
- Brooks, D. E. 1973. The effect of neutral polymers on the electrokinetic potential of cells and other charged particles. J. Colloid Interface Sci. 43:700–713. [Google Scholar]
- Brooks, D. E. 1988. Mechanism of red cell aggregation. In Blood Cells, Rheology and Aging. D. Platt, editor. Springer Verlag, Berlin. 158–162.
- Carrasco, B., J. Garcia de la Torre, K. G. Davis, S. Jones, D. Athwal, C. Walters, D. R. Burton, and S. E. Harding. 2001. Crystallohydrodynamics for solving the hydration problem for multi-domain proteins: open physiological conformations for human IgG. Biophys. Chem. 93:181–196. [DOI] [PubMed] [Google Scholar]
- Chien, S. 1975. Biophysical behavior of red cells in suspensions. In The Red Blood Cell. D. M. Surgenor, editor. Academic Press, New York. 1031–1133.
- Chien, S., and K. M. Jan. 1973. Ultrastructural basis of the mechanism of rouleaux formation. Microvasc. Res. 5:155–166. [DOI] [PubMed] [Google Scholar]
- Chien, S., and L. A. Lang. 1987. Physicochemical basis and clinical implications of red cell aggregation. Clin. Hemorheol. 7:71–91. [Google Scholar]
- Chien, S., S. Simchon, R. E. Abbot, and K. M. Jan. 1977. Surface adsorption of dextrans on human red cell membrane. J. Colloid Interface Sci. 62:461–470. [Google Scholar]
- Cokelet, G. R. 1972. The rheology of human blood. In Biomechanics. Y. C. Fung, N. Perrone, and M. Anliker, editors. Prentice-Hall, Englewood Cliffs, NJ. 63–103.
- de Gennes, P. G. 1989. Model polymers at interfaces. In Physical Basis for Cell-Cell Adhesion. P. Bongrand, editor. CRC Press, Boca Raton, FL. 39–60.
- Donner, M., P. De Wachter, G. Cauchois, M. Gentils, M. Kurtz, M. C. Laxenaire, and J.-F. Stoltz. 1993. In vivo effects of plasma substitutes on the rheologic properties of blood. J. Mal. Vasc. 18:126–133. [PubMed] [Google Scholar]
- Fåhræus, R. 1921. Suspension stability of the blood. Acta Med. Scand. 55:1–157. [Google Scholar]
- Fåhræus, R. 1929. The suspension stability of the blood. Physiol. Rev. 9:241–274. [Google Scholar]
- Fang, W. D., and T. K. Mukkur. 1976. Physiochemical characterization of proteolytic cleavage fragments of bovine colostral immunoglobulin G1 (IgG1). Biochem. J. 155:25–30. [DOI] [PMC free article] [PubMed] [Google Scholar]
- Flory, P. J., and T. G. Fox, Jr. 1951. Treatment of intrinsic viscosity. J. Am. Chem. Soc. 73:1904–1906. [Google Scholar]
- Flory, P. J. 1953. Principles of Polymer Chemistry. Cornell University Press, Ithaca, N.Y.
- Forsdyke, D. R., R. G. Palfree, and A. Takeda. 1982. Formation of erythrocyte rouleaux in preheated normal serum: roles of albumin polymers and lysophosphatidylcholine. Can. J. Biochem. 60:705–711. [DOI] [PubMed] [Google Scholar]
- Fronticelli, C., D. Arosio, K. M. Bobofchak, and G. B. Vasquez. 2001. Molecular engineering of a polymer of tetrameric hemoglobins. Proteins. 44:212–222. [DOI] [PubMed] [Google Scholar]
- Geller, N. M., V. A. Kropachev, V. A. Leftov, and I. V. Potapova. 1981. The influence of polyethylene oxide on the aggregation of erythrocytes. Polim. Med. 11:83–93. [PubMed] [Google Scholar]
- Grönwall, A. 1957. Dextran and Its Use in Colloidal Infusion Solutions. Academic Press, New York.
- Güner, A., and M. Ataman. 1997. Properties of aqueous salt solutions of poly(vinylpyrrolidone). II. Polymer dimensions and thermodynamic quantities. Polym. Int. 44:30–34. [Google Scholar]
- Hardwicke, J., and J. R. Squire. 1952. The basis of the erythrocyte sedimentation rate. Clin. Sci. 11:333–355. [PubMed] [Google Scholar]
- Hint, H. 1964. The relationship between the molecular weight of dextran and its effects. In Rheomacrodex: Reports of Symposia, Vol. 1. Report of The London and Cardiff Meetings, November 1964. Pharmacia International, Uppsala, Sweden. 2–12.
- Hint, H. 1969. . The pharmacology of dextran and the physiological background for the clinical use of Rheomacrodex and Macrodex. Acta Anaesthesiol. Belg. 19:119–138. [PubMed] [Google Scholar]
- Hint, H. 1971. In Dextrans: Current Concepts of Basic Actions and Clinical Applications. J. R. Derrick and M. Mason-Guest, editors. Charles C. Thomas, Springfield, IL. 3–26.
- Hormann, H. 1975. The mechanism of blood cell sedimentation. XVIII. Sedimentation effect of fibrinogen plasminolysis products. Blut. 30:51–58. [DOI] [PubMed] [Google Scholar]
- Imaizumi, K., and T. Shiga. 1983. Effect of immunoglobulins and IgG-fragments on the human erythrocyte aggregation, studied by a rheoscope combined with image analyzer. Biorheology. 20:569–577. [DOI] [PubMed] [Google Scholar]
- Izumida, Y. 1991. Roles of plasma proteins and surface negative charge of erythrocytes in erythrocyte aggregation. Nippon Seirigaku Zasshi. 53:1–12. [PubMed] [Google Scholar]
- Jossang, T., J. Feder, and E. Rosenqvist. 1988. Photon correlation spectroscopy of human IgG. J. Protein Chem. 7:165–171. [DOI] [PubMed] [Google Scholar]
- Kaibara, M. 1983. Rheological behaviors of bovine blood forming artificial rouleaux. Biorheology. 20:583–592. [DOI] [PubMed] [Google Scholar]
- Kilar, R., I. Simon, S. Lakatos, F. Vonderviszt, G. A. Medgyesi, and P. Zavodszky. 1985. Conformation of human IgG subclasses in solution. Small-angle X-ray scattering and hydrodynamic studies. Eur. J. Biochem. 147:17–25. [DOI] [PubMed] [Google Scholar]
- Kollmeier, H., H. Baumann, C. Kallweit, and J. Rox. 1972. Correlation between erythrocyte sedimentation rate and plasma proteins. Klin. Wochenschr. 50:116–118. [DOI] [PubMed] [Google Scholar]
- Lentner, C. 1984. Geigy Scientific Tables, 8th ed, Vol. 3. Physicochemical and Biological Properties of Plasma Proteins. Ciba-Geigy Medical Education Division, West Caldwell, NJ.
- Lowe, G. D. O. 1988. Clinical Blood Rheology. CRC Press, Boca Raton, FL.
- MacKenzie, M. R., and J. Babcock. 1975. Studies of the hyperviscosity syndrome. II. Macroglobulinemia. J. Lab. Clin. Med. 85:227–234. [PubMed] [Google Scholar]
- Maeda, N., M. Seike, S. Kume, T. Takaku, and T. Shiga. 1987. Fibrinogen-induced erythrocyte aggregation: erythrocyte-binding site in the fibrinogen molecule. Biochim. Biophys. Acta. 904:81–91. [DOI] [PubMed] [Google Scholar]
- Marder, V. J., N. R. Shulman, and W. R. Carroll. 1969. High molecular weight derivatives of human fibrinogen produced by plasmin. I. Physicochemical and immunological characterization. J. Biol. Chem. 244:2111–2119. [PubMed] [Google Scholar]
- Marsh, N. A. 1979. The accelerating effect of fibrinogen and early fibrinogen degradation products on erythrocyte sedimentation. Thromb. Haemost. 42:757–763. [PubMed] [Google Scholar]
- Masson P. L. 1976. CRC Handbook of Biochemistry and Molecular Biology, 3rd ed, Proteins, Vol. 3. Gerald D. Fasman, editor. CRC Press, Cleveland, OH. 242–250.
- McMillan, D. E., N. G. Utterback, and M. M. Lee. 1989. Red cells slide as they form doublets and deform in rouleaux. Biorheology. 26:899–906. [PubMed] [Google Scholar]
- Meiselman, H. J. 1993. Red blood cell role in RBC aggregation: 1962–1993 and beyond. Clin. Hemorheol. 13:575–592. [Google Scholar]
- Menu, P., W. Bleeker, D. Longrois, A. Caron, B. Faivre-Fiorina, S. Muller, P. Labrude, and J.-F. Stoltz. 2000. In vivo effects of Hb solutions on blood viscosity and rheologic behavior of RBCs: comparison with clinically used volume expanders. Transfusion. 40:1095–1103. [DOI] [PubMed] [Google Scholar]
- Merrill, E. M. 1969. Rheology of blood. Physiol. Rev. 49:863–888. [DOI] [PubMed] [Google Scholar]
- Morgan, P. J., O. D. Byron, and S. E. Harding. 1992. Ultracentrifugation: The Solution Conformation of Novel Antibody Fragments Studied Using Analytical Ultracentrifugation. Technical Information DS-83.4. Beckman Instruments, Palo Alto, CA.
- Nash, G. B., and H. J. Meiselman. 1983. Effects of dextran and polyvinylpyrrolidone on red cell geometry and membrane elasticity. Ann. N. Y. Acad. Sci. 416:255–262. [DOI] [PubMed] [Google Scholar]
- Neu, B., J. K. Armstrong, T. C. Fisher, and H. J. Meiselman. 2001. Aggregation of human RBC in binary dextran-PEG polymer mixtures. Biorheology. 38:53–68. [PubMed] [Google Scholar]
- Neu, B., and H. J. Meiselman. 2001. Sedimentation and electrophoretic mobility behavior of human red blood cells in various dextran solutions. Langmuir. 17:7973–7975. [Google Scholar]
- Neu, B., and H. J. Meiselman. 2002. Depletion-mediated red blood cell aggregation in polymer solutions. Biophys. J. 83:2482–2490. [DOI] [PMC free article] [PubMed] [Google Scholar]
- Olshaker, J. S., and D. A. Jerrard. 1997. The erythrocyte sedimentation rate. J. Emerg. Med. 15:869–874. [DOI] [PubMed] [Google Scholar]
- Orringer, E. P., J. F. Casella, K. I. Ataga, M. Koshy, P. Adams-Graves, L. Luchtman-Jones, T. Wun, M. Watanabe, F. Shafer, A. Kutlar, M. Abboud, M. Steinberg, B. Adler, P. Swerdlow, C. Terregino, S. Saccente, B. Files, S. Ballas, R. Brown, S. Wojtowicz-Praga, and J. M. Grindel. 2001. Purified poloxamer 188 for treatment of acute vaso-occlusive crisis of sickle cell disease: A randomized controlled trial. JAMA. 286:2099–2106. [DOI] [PubMed] [Google Scholar]
- Popel, A. S., P. C. Johnson, M. V. Kameneva, and M. A. Wild. 1994. Capacity for red blood cell aggregation is higher in athletic mammalian species than in sedentary species. J. Appl. Physiol. 77:1790–1794. [DOI] [PubMed] [Google Scholar]
- Preston, F. E., K. B. Cooke, M. E. Foster, D. A. Winfield, and D. Lee. 1978. Myelomatosis and the hyperviscosity syndrome. Br. J. Haematol. 38:517–530. [DOI] [PubMed] [Google Scholar]
- Rampling, M. W., and G. Martin. 1992. Albumin and rouleaux formation. Clin. Hemorheol. 12:761–765. [Google Scholar]
- Rampling, M. W., H. J. Meiselman, B. Neu, and O. K. Baskurt. 2003. Influence of cell-specific factors on red blood cell aggregation. Biorheology. 41:91–112. [PubMed] [Google Scholar]
- Richter, W. 1966. Normalizing effect of low molecular weight fractions on the reduced suspension stability of human erythrocytes in vitro. Acta Chir. Scand. 131:1–8. [PubMed] [Google Scholar]
- Ruhenstroth-Bauer, G., G. Brittinger, F.-H. Kayser, G. Nass, and M. Tautfest. 1962. Der mechanismus der blutkörperchensenkung. Klin. Wochenschr. 40:1200–1206. [Google Scholar]
- Sakai, H., M. Yuasa, H. Onuma, S. Takeoka, and E. Tsuchida. 2000. Synthesis and physicochemical characterization of a series of hemoglobin-based oxygen carriers: objective comparison between cellular and acellular types. Bioconjug. Chem. 11:56–64. [DOI] [PubMed] [Google Scholar]
- Salamova, U. U., Z. M. O. Rzaev, S. Altindal, and A. A. Masimov. 1996. Effect of inorganic salts on the main parameters of the dilute aqueous poly(vinylpyrrolidone) solutions. Polym. 37:2415–2421. [Google Scholar]
- Scherer, R., A. Morarescu, and G. Ruhenstroth-Bauer. 1975. Die spezifische wirkung der plasmaproteine bei der blutkörperchensenkung. Klin. Wochenschr. 33:262–273. [PubMed] [Google Scholar]
- Schmid-Schönbein, H., G. Gallasch, E. Volger, and H. J. Klose. 1973. Microrheology and protein chemistry of pathological red cell aggregation (blood sludge) studies in vitro. Biorheology. 10:213–227. [DOI] [PubMed] [Google Scholar]
- Sewchand, L. S., and P. B. Canham. 1979. Modes of rouleaux formation of human red blood cells in polyvinylpyrrolidone and dextran solutions. Can. J. Physiol. Pharmacol. 57:1213–1222. [DOI] [PubMed] [Google Scholar]
- Sewchand, L. S., and D. Bruckschwaiger. 1980. Observed differences in dextran and polyvinylpyrrolidone as rouleaux-inducing agents. Can. J. Physiol. Pharmacol. 58:271–274. [DOI] [PubMed] [Google Scholar]
- Talstad, I., and H. F. Haugen. 1997. The relationship between the erythrocyte sedimentation rate (ESR) and plasma proteins in clinical materials and models. Scand. J. Clin. Lab. Invest. 39:519–524. [DOI] [PubMed] [Google Scholar]
- Thorsén, G., and H. Hint. 1950. Aggregation, sedimentation and intravascular sludging of erythrocytes. Acta Chir. Scand. Suppl. 154:1–5. [Google Scholar]
- Toth, K., L. Bogar, I. Juricskay, M. Kelta, S. Yusuf, L. J. Haywood, and H. J. Meiselman. 1997. The effect of RheothRx injection on the hemorheological parameters in patients with acute myocardial infarction. Clin. Hemorheol. Microcirc. 17:117–125. [PubMed] [Google Scholar]
- Toth, K., R. B. Wenby, and H. J. Meiselman. 2000. Inhibition of polymer-induced red blood cell aggregation by poloxamer 188. Biorheology. 37:301–312. [PubMed] [Google Scholar]
- Tsai, S.-P., and J. T.-F. Wong. 1996. Enhancement of erythrocyte sedimentation rate by polymerized hemoglobin. Artif. Cells Blood Substit. Immob. Biotech. 24:513–523. [DOI] [PubMed] [Google Scholar]
- van Oss, C. J. 1994. Interfacial Forces in Aqueous Media. Marcell Dekker, New York.
- van Oss, C. J., K. Arnold, and W. T. Coakley. 1990. Depletion flocculation and depletion stabilization of erythrocytes. Cell Biophys. 17:1–10. [DOI] [PubMed] [Google Scholar]
- Vrij, A. 1976. Polymers at interfaces and interactions in colloidal dispersions. Pure Appl. Chem. 8:471–483. [Google Scholar]
- Weng, X., G. Cloutier, R. Beaulieu, and G. O. Roederer. 1996. Influence of acute-phase proteins on erythrocyte aggregation. Am. J. Physiol. 271:H2346–H2352. [DOI] [PubMed] [Google Scholar]
- Westergren. 1921. Studies of the suspension stability of the blood in pulmonary tuberculosis. Acta Med. Scand. 54:247–281. [Google Scholar]