Vitamin D receptor in chondrocytes promotes osteoclastogenesis and regulates FGF23 production in osteoblasts (original) (raw)
Abstract
Genomic actions induced by 1α25-dihydroxyvitamin D3 [1,25(OH)2D3] are crucial for normal bone metabolism, mainly because they regulate active intestinal calcium transport. To evaluate whether the vitamin D receptor (VDR) has a specific role in growth-plate development and endochondral bone formation, we investigated mice with conditional inactivation of VDR in chondrocytes. Growth-plate chondrocyte development was not affected by the lack of VDR. Yet vascular invasion was impaired, and osteoclast number was reduced in juvenile mice, resulting in increased trabecular bone mass. In vitro experiments confirmed that VDR signaling in chondrocytes directly regulated osteoclastogenesis by inducing receptor activator of NF-κB ligand (RANKL) expression. Remarkably, mineral homeostasis was also affected in chondrocyte-specific _VDR_-null mice, as serum phosphate and 1,25(OH)2D levels were increased in young mice, in whom growth-plate activity is important. Both in vivo and in vitro analysis indicated that VDR inactivation in chondrocytes reduced the expression of FGF23 by osteoblasts and consequently led to increased renal expression of 1α-hydroxylase and of sodium phosphate cotransporter type IIa. Taken together, our findings provide evidence that VDR signaling in chondrocytes is required for timely osteoclast formation during bone development and for the endocrine action of bone in phosphate homeostasis.
Introduction
Vitamin D is the major regulator of calcium homeostasis and protects the organism from calcium deficiency via effects on the intestine, kidney, and bone. Vitamin D interacts with the vitamin D receptor (VDR), a transcription factor regulating gene expression in several cell types, including osteoblasts and chondrocytes. Disorders of the vitamin D endocrine system by mutations in or inactivation of the VDR (1–3) or the 1α-hydroxylase gene, CYP27B1 (4–6), result in profound disturbances of mineral homeostasis and of bone mineralization. Decreased active intestinal calcium absorption due to reduced expression of epithelial calcium channels (7) is a crucial mechanism contributing to the phenotype. The importance of calcium absorption is further evidenced by the fact that calcium supplementation rescued hypocalcemia and hyperparathyroidism and restored bone mineralization both in patients and mice with loss of VDR function (8, 9), which raises questions about the role of VDR in bone metabolism. However, these data do not exclude the possibility that VDR may have a specific, although not essential, role in bone. Accordingly, the ability of osteoblasts to support osteoclastogenesis is regulated by but not dependent on vitamin D signaling (10). In addition, in vitro studies revealed that osteoblasts lacking VDR demonstrate enhanced differentiation potential (11) although transgenic overexpression of VDR in mature osteoblasts suggests that VDR exerts an anabolic function in bone (12). Finally, growth-plate abnormalities in mice lacking VDR were observed before the onset of hypocalcemia (3), suggesting a defined role for VDR in endochondral-bone formation.
The start of endochondral ossification is characterized by differentiation of aggregated mesenchymal cells into chondrocytes forming cartilage elements that later evolve to hypertrophic and finally terminal differentiated chondrocytes. The latter region is subsequently invaded by blood vessels accompanied by osteoclasts and osteoblasts, thereby replacing the cartilage with bone and bone marrow (13). Vitamin D signaling may regulate this process, as enhanced vascular invasion is observed when mice are treated with 1α25-dihydroxyvitamin D3 [1,25(OH)2D3], probably resulting from increased availability of VEGF (14).
Besides its role in calcium homeostasis, vitamin D also affects phosphate homeostasis by participating in a negative feedback loop with FGF23. The phosphaturic factor FGF23 is mainly produced by bone (15) and induces renal phosphate wasting by suppressing renal tubular sodium phosphate cotransporter type IIa (NPT2a) expression (16). Vitamin D enhances the production of FGF23, which in its turn suppresses renal CYP27B1 expression (16). Mice lacking VDR show decreased circulating FGF23 levels in agreement with the negative reciprocal regulation (17).
To elucidate the role of vitamin D genomic action during endochondral bone development under assumed normal mineral homeostasis, we generated mice lacking VDR specifically in chondrocytes. The inactivation of VDR in chondrocytes did not manifestly affect chondrocyte development. Yet trabecular bone volume (BV/TV) was increased in early life due to reduced osteoclast number. In vitro experiments confirmed that VDR signaling in chondrocytes directly regulates osteoclastogenesis by inducing receptor activator of NF-κB ligand (RANKL) expression. Unexpectedly, serum phosphate and 1,25(OH)2D levels were increased in these mice before weaning. Both in vivo and in vitro analysis showed that normal FGF23 production by osteoblasts is dependent on VDR genomic action in chondrocytes. Taken together, these results show that VDR signaling in chondrocytes is required for timely osteoclastogenesis during bone development and regulates FGF23 production by osteoblasts.
Results
Loss of VDR in growth-plate chondrocytes does not affect their development.
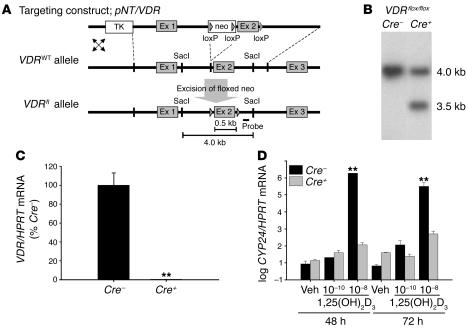
To evaluate the contribution of VDR in early endochondral-bone development, floxed VDR (VDRfl/fl) mice were intercrossed with transgenic mice in which Cre recombinase was driven by collagen 2a1 (Col2) promoter (Figure 1A). The efficiency of chondrocyte-specific VDR inactivation was assessed at the DNA, RNA, and functional levels. Correct excision of the floxed VDR exon was demonstrated by Southern blot analysis of tail-extracted DNA from 15-day-old Col2Cre+/–VDRfl/fl mice (further defined as mutant Cre+VDRfl/fl), which was not observed in WT Col2Cre–/–VDRfl/fl (Cre–VDRfl/fl) mice. At this age, the tail vertebrae still contain collagen 2–expressing cells (Figure 1B). Analysis of VDR mRNA expression by quantitative real-time PCR (qRT-PCR) revealed undetectable VDR levels in chondrocytes isolated from neonatal Cre+VDRfl/fl mice whereas VDR was abundantly expressed in Cre–VDRfl/fl chondrocytes (Figure 1C). This efficient VDR inactivation was confirmed by assessing 1,25(OH)2D3–induced gene transcription in cultured primary chondrocytes (Figure 1D). CYP24 mRNA expression was strongly increased by 1,25(OH)2D3 treatment (10–8 M) in Cre–VDRfl/fl chondrocytes, as anticipated, but not in Cre+VDRfl/fl chondrocytes. On the other hand, VDR activity and/or expression was not altered in cultured osteoblasts, kidney, or intestine (data not shown) of Cre+VDRfl/fl mice.
Figure 1. Inactivation of the VDR gene in chondrocytes.
(A) Schematic representation of targeting construct pNT vector/VDR, the _VDR_WT allele, and the VDRfl allele after Cre excision of the floxed neo cassette and probe used for identifying correct Cre excision of floxed exon 2. Restriction sites are indicated. Ex, exon. (B) Southern blot of _Sac_I-digested genomic DNA from Cre–VDRfl/fl and Cre+VDRfl/fl mice using internal probe. (C) VDR gene expression in growth-plate chondrocytes of Cre–VDRfl/fl (Cre–) and Cre+VDRfl/fl (Cre+) mice (n = 6) was assessed by qRT-PCR analysis and calculated as a ratio to the HPRT mRNA copies. Cre–VDRfl/fl value was set at 100%. **P < 0.01 versus Cre–VDRfl/fl. (D) qRT-PCR analysis of CYP24 mRNA levels in primary chondrocyte culture stimulated with vehicle (veh) or 1,25(OH)2D3 (10–10 M and 10–8 M) for 48 hours and 72 hours. Values are corrected for HPRT mRNA copies and are shown as means ± SEM in log scale. **P < 0.01 versus vehicle.
Cre+VDRfl/fl mice were viable, showed normal growth curves during the examined period, and did not display any overt phenotype (data not shown).
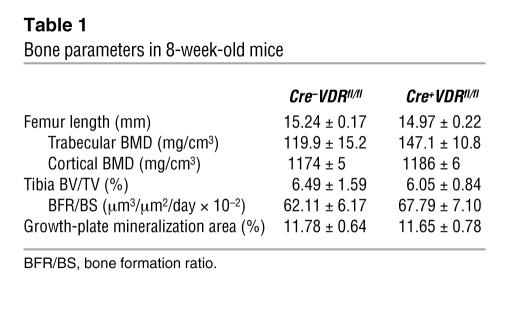
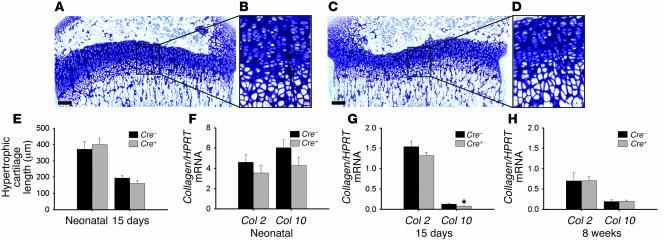
Longitudinal bone growth, assessed by measuring femur length, was similar between the 2 genotypes at all investigated ages, including E15.5, the neonatal period, 15 days (data not shown), and 8 weeks (Table 1). To determine whether VDR inactivation affects chondrocyte development, growth-plate morphology and gene expression were analyzed. No gross morphological changes, assessed on toluidine blue–stained sections of the tibiae, were noticed at any age in cartilage of Cre+VDRfl/fl mice (Figure 2, C and D; only histology of 15-day-old mice is shown.). The total length of the growth plate (data not shown) as well as the length of hypertrophic cartilage in tibiae of neonatal and 15-day-old mice were similar between the 2 genotypes (Figure 2E). Also, the amount of growth-plate mineralization in 8-week-old mice did not differ (Table 1). The mRNA level of Col2, a marker of proliferating chondrocytes, was assessed in neonatal, 15-day-old, and 8-week-old femora but was not significantly different between the 2 genotypes (Figure 2, F–H). In addition, its expression pattern in the growth plates of 15-day-old mice was indistinguishable between genotypes, as revealed by collagen 2 immunostaining (Supplemental Figure 1; supplemental material available online with this article; doi:10.1172/JCI29463DS1). Compared with Cre–VDRfl/fl mice, collagen 10 (Col10) mRNA level, a specific marker of hypertrophic chondrocytes, was unaltered in neonatal Cre+VDRfl/fl mice (Figure 2F), decreased in 15-day-old mice (P < 0.05; Figure 2G), and at normal levels at the age of 8 weeks (Figure 2H). These data suggest that lack of VDR in chondrocytes does not manifestly impair chondrocyte development but suppresses temporarily the terminal differentiation of the chondrocytes.
Table 1 .
Bone parameters in 8-week-old mice
Figure 2. Normal growth-plate development in chondrocyte-specific _VDR_-null mice.
(A–D) Toluidine blue staining of the proximal tibiae from 15-day-old Cre–VDRfl/fl (A and B) and Cre+VDRfl/fl mice (C and D). Scale bar: 200 μm. (E) Quantification of the length of the hypertrophic cartilage zone in the proximal tibiae. (F–H) Gene expression of Col2 and Col10 in neonatal (F), 15-day-old (G), and 8-week-old (H) femora from Cre–VDRfl/fl and Cre+VDRfl/fl mice, assessed by qRT-PCR and calculated as a ratio to HPRT mRNA copies. *P < 0.05 versus Cre–VDRfl/fl.
BV/TV is increased in juvenile Cre+VDRfl/fl mice.
During endochondral ossification, cartilage becomes progressively replaced by mineralized bone, which is a highly coordinated process, depending partially on factors produced by chondrocytes. To investigate the effect of VDR inactivation in chondrocytes on this process, trabecular bone parameters were quantified at several ages. At 8 weeks, static and dynamic bone parameters were normal, as evidenced by similar values between the 2 genotypes for trabecular and cortical bone mineral density (BMD) analyzed by peripheral quantitative computed tomography of the femur, BV/TV quantified on von Kossa–stained sections, and bone formation ratio (BFR/BS) assessed on unstained sections of the tibiae (Table 1).
In contrast, BV/TV was significantly increased, by 50%, in neonatal and 15-day-old Cre+VDRfl/fl compared with Cre–VDRfl/fl mice (Figure 3A). In addition, von Kossa staining revealed that trabecular bone extended more deeply into the metaphyseal area of the proximal tibiae in 15-day-old Cre+VDRfl/fl mice (Figure 3, B and C).
Figure 3. Chondrocyte-specific VDR inactivation results in increased metaphyseal bone volume in neonatal and 15-day-old mice.
(A) Quantification of BV/TV in the proximal tibiae metaphysis on von Kossa–stained sections shows a significant increase in BV/TV in Cre+VDRfl/fl mice compared with Cre–VDRfl/fl mice. (B and C) von Kossa staining on tibiae sections of 15-day-old Cre–VDRfl/fl (B) and Cre+VDRfl/fl mice (C). Scale bar: 400 μm. (D) Osteocalcin gene expression in femora (total bone or dissected diaphysis) of 15-day-old Cre–VDRfl/fl and Cre+VDRfl/fl mice was assessed by qRT-PCR analysis and calculated as a ratio to the HPRT mRNA copies. Cre–VDRfl/fl value was set at 100%. *P < 0.05; **P < 0.01 versus Cre–VDRfl/fl.
Vascularization and osteoclast invasion are delayed when chondrocytes lack VDR.
The observed changes in bone mass in 15-day-old Cre+VDRfl/fl mice may have resulted from increased bone formation and/or decreased bone resorption. Osteoblast function was not manifestly changed by VDR inactivation in chondrocytes, as suggested by the normal mRNA expression of the osteoblastic marker osteocalcin (Figure 3D) and runt-related transcription factor 2 (Runx2) (data not shown) in 15-day-old femora. In addition, in vitro osteogenic differentiation of bone marrow stromal cells (CFU-osteoblast) isolated from 15-day-old mice did not differ between genotypes, as comparable number and size of colonies staining positive for alkaline phosphatase or alizarin red were obtained (data not shown).
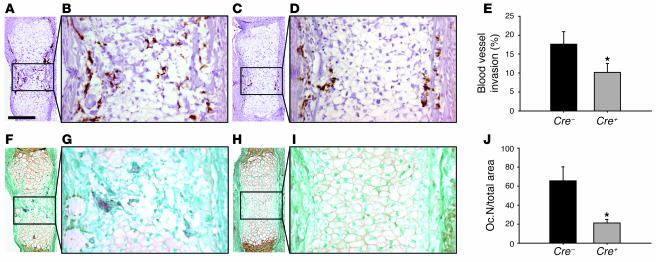
On the other hand, bone resorption may be impaired; this is often associated at these stages with changes in vascularization. These processes were investigated at E15.5 and in neonatal and 15-day-old mice. Initial blood vessel invasion in Cre–VDRfl/fl tibiae, assessed by CD31 staining, was observed at E15.5, showing endothelial cells located at the bone collar/perichondrium but also invading the cartilage core (Figure 4, A and B). In contrast, in Cre+VDRfl/fl mice, endothelial cells were solely detected along the bone collar/perichondrium (Figure 4, C and D). At the same time, tartrate-resistant acid phosphatase–positive (TRAP-positive) multinuclear osteoclasts accompanying endothelial cells had just started to invade the tibial cartilage, forming the primary ossification center in Cre–VDRfl/fl tibiae (Figure 4, F and G) whereas these cells were hardly observed in Cre+VDRfl/fl tibiae (Figure 4, H and I). Quantification revealed that blood vessel invasion in Cre+VDRfl/fl tibiae was only 57% of the Cre–VDRfl/fl level (P < 0.05; Figure 4E) and that the number of TRAP-positive cells even decreased, with 70% in Cre+VDRfl/fl tibiae compared with Cre–VDRfl/fl (P < 0.05; Figure 4J).
Figure 4. Vascular invasion and osteoclast formation are impaired in E15.
Cre+VDRfl/fl mice. (A–D, F–I) Sets of adjacent tibial sections were immunostained for CD31 (A–D) or TRAP (F–I) to visualize endothelial cells or osteoclasts in E15.5 Cre–VDRfl/fl (A, B, F, and G) and Cre+VDRfl/fl (C, D, H, and I) mice, respectively. Scale bar: 200 μm. (E) Invasion of blood vessels from the perichondrium into the cartilage core was measured and expressed relative to the cartilage width in Cre+VDRfl/fl and Cre–VDRfl/fl tibiae. (J) Quantification of the number of osteoclasts (Oc.N) in the primary ossification center. *P < 0.05 versus Cre–VDRfl/fl.
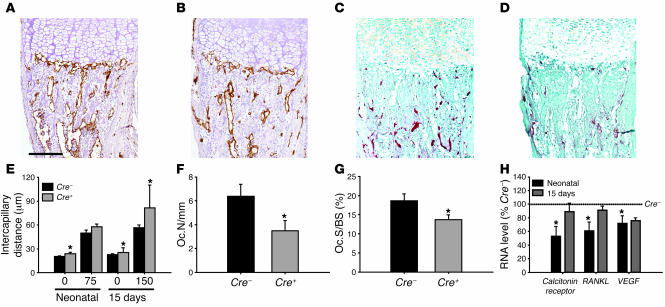
In neonatal tibiae, the number of blood vessels invading the terminal row of the hypertrophic chondrocytes of the growth plate was reduced in Cre+VDRfl/fl mice (Figure 5B) as compared with Cre–VDRfl/fl mice (Figure 5A). Accordingly, intercapillary distance was significantly larger in neonatal Cre+VDRfl/fl tibiae (P < 0.05; Figure 5E). Also, in 15-day-old Cre+VDRfl/fl mice, the intercapillary distance was significantly increased both at the terminal row of the growth plate and in the metaphysis, 150 μm distal from the hypertrophic chondrocytes (Figure 5E). The changes in vascularization were accompanied by alterations in osteoclast formation, as shown by the reduced TRAP positivity in Cre+VDRfl/fl mice (Figure 5D) compared with Cre–VDRfl/fl mice (Figure 5C). The number of TRAP-positive cells at the border of the growth plate was decreased by 50% in neonatal Cre+VDRfl/fl tibiae (Figure 5F). This was reflected in a significant reduction of the calcitonin receptor mRNA level, a marker of differentiated osteoclasts, in Cre+VDRfl/fl mice (Figure 5H). Also, at 15 days, osteoclast surface in trabecular bone was decreased in Cre+VDRfl/fl tibiae (Figure 5G). These 2 processes, osteoclast formation and angiogenesis, are regulated by the secreted factors RANKL and VEGF, respectively. In agreement with the histological findings, mRNA expression of both factors was significantly reduced in neonatal Cre+VDRfl/fl femora compared with Cre–VDRfl/fl mice (P < 0.05; Figure 5H). These data indicate that vascular invasion at the growth plate and resorption of trabecular bone is decreased in Cre+VDRfl/fl mice, which can explain the observed increased bone volume.
Figure 5. Decreased vascularization and osteoclast number in neonatal and 15-day-old Cre+VDRfl/fl mice.
(A–D) Endothelial cells and osteoclasts were visualized by CD31 (A and B) and TRAP (C and D) staining, respectively, in neonatal Cre–VDRfl/fl (A and C) and Cre+VDRfl/fl (B and D) tibiae. Scale bar: 200 μm. (E) Intercapillary distance, measured at 0, 75, and 150 μm from the growth-plate border in neonatal and 15-day-old tibiae was larger in Cre+VDRfl/fl mice compared with Cre–VDRfl/fl mice. (F) The number of osteoclasts at the terminal row of hypertrophic chondrocytes in neonatal tibiae was significantly lower in Cre+VDRfl/fl mice. (G) Osteoclast surface (Oc.S) was significantly decreased in 15-day-old Cre+VDRfl/fl tibiae. (H) Calcitonin receptor, RANKL, and VEGF mRNA levels in neonatal and 15-day-old Cre+VDRfl/fl femora was determined by qRT-PCR, corrected for HPRT mRNA copies, and expressed relative to Cre–VDRfl/fl mice set at 100%. *P < 0.05 versus Cre–VDRfl/fl.
Chondrocytes promote osteoclastogenesis by 1,25(OH)2D3–induced RANKL expression.
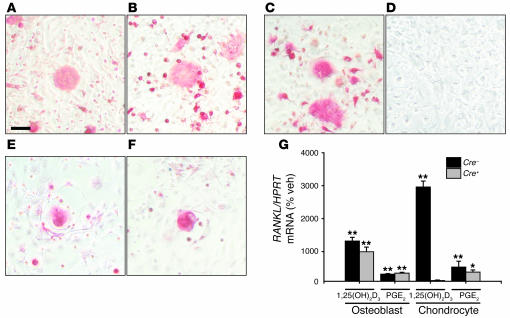
Since Cre+VDRfl/fl mice displayed retarded osteoclast invasion into cartilage and reduced RANKL gene expression in neonatal femora, we investigated whether 1,25(OH)2D3 genomic signaling in chondrocytes regulates osteoclastogenesis, using cocultures with spleen cells. TRAP-positive multinuclear cells were formed in 1,25(OH)2D3-treated (10–8 M) cocultures of calvarial-derived osteoblasts and splenocytes irrespective of the genotype (Figure 6, A and B; only results of Cre–VDRfl/fl splenocytes are shown). Under similar experimental conditions, chondrocytes isolated from Cre–VDRfl/fl mice induced TRAP-positive multinuclear osteoclasts in cocultures with splenocytes from either genotype (Figure 6C). However, no osteoclasts were formed when Cre+VDRfl/fl chondrocytes were used (Figure 6D). This effect was specific for the 1,25(OH)2D3/VDR signaling pathway, as prostaglandin E2 (PGE2) (10–6 M) induced osteoclast formation irrespective of the chondrocyte genotype (Figure 6, E and F).
Figure 6. Signaling of 1,25(OH)2D3 in chondrocytes promotes osteoclast differentiation by the RANKL pathway.
(A–F) Microscopic observation of TRAP-positive multinuclear cells formed after 1 week of coculturing osteoblasts or chondrocytes with Cre–VDRfl/fl splenocytes. Osteoclast formation was similar whether osteoblasts from Cre–VDRfl/fl (A) or Cre+VDRfl/fl mice (B) were used and treated with 1,25(OH)2D3 (10–8 M). Chondrocytes from Cre–VDRfl/fl mice induced TRAP-positive cells when stimulated with 1,25(OH)2D3 (C) or 10–6 M PGE2 (E) whereas chondrocytes from Cre+VDRfl/fl mice induced osteoclasts only when treated with PGE2 (F) and not with 1,25(OH)2D3 (D). Scale bar: 100 μm. (G) qRT-PCR analysis of RANKL mRNA expression in primary osteoblast or chondrocyte cultures from Cre–VDRfl/fl and Cre+VDRfl/fl mice stimulated by 10–8 M 1,25(OH)2D3 or 10–6 M PGE2 for 2 days. Values are calculated as ratio to HPRT mRNA copies and expressed relative to vehicle set as 100%. *P < 0.05; **P < 0.01 versus vehicle.
As osteoclastogenesis is dependent on the ratio of RANKL to osteoprotegerin (OPG), the mRNA level of these factors was quantified in 1,25(OH)2D3- or PGE2-treated primary cultures and compared with vehicle treatment. RANKL gene expression was significantly induced in osteoblasts (P < 0.001) regardless of the genotype and stimulus (Figure 6G). In addition, 1,25(OH)2D3 (10–8 M) increased RANKL expression 30-fold in Cre–VDRfl/fl chondrocytes (P < 0.001) whereas no induction was noticed in Cre+VDRfl/fl chondrocytes (Figure 6G). On the other hand, PGE2 significantly induced RANKL expression in chondrocytes from either genotype (Figure 6G). OPG mRNA levels did not differ in any condition. Thus, these findings clearly indicate that chondrocytes can promote osteoclast differentiation by expressing RANKL, which is strongly induced by 1,25(OH)2D3 genomic signaling.
1,25(OH)2D3 genomic signaling in chondrocytes modulates phosphaturic factor expression.
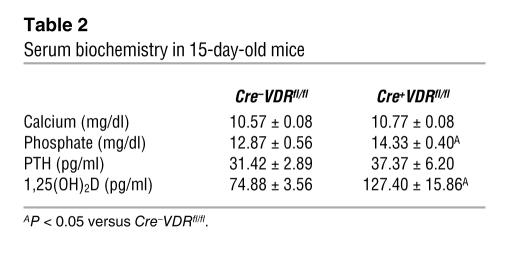
In systemic _VDR_-null mice, mineral homeostasis becomes manifestly disturbed after weaning, concurrent with the development of skeletal changes. In the present study, we investigated serum biochemistry at the age of 15 days, when endochondral ossification was clearly affected in Cre+VDRfl/fl mice. Chondrocyte-specific VDR inactivation did not affect calcium and parathyroid hormone (PTH) levels (Table 2). On the other hand, phosphate and 1,25(OH)2D serum concentrations were significantly increased in Cre+VDRfl/fl mice compared with Cre–VDRfl/fl mice (P < 0.05; Table 2). These changes were no longer observed in 8-week-old mice, as both serum phosphate (13.5 ± 0.6 mg/dl in Cre–VDRfl/fl versus 12.9 ± 0.8 mg/dl in Cre+VDRfl/fl) and 1,25(OH)2D (128 ± 13 pg/ml in Cre–VDRfl/fl versus 121 ± 1 pg/ml in Cre+VDRfl/fl) showed normal values.
Table 2 .
Serum biochemistry in 15-day-old mice
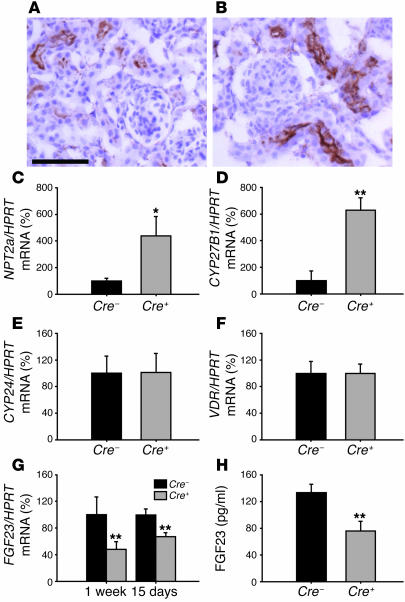
Since phosphate homeostasis is mainly regulated by renal phosphate reabsorption, we assessed the expression of NPT2a, the major player in this process, expressed at the apical membrane of proximal tubular cells. Immunohistochemical staining showed more abundant NPT2a expression in 15-day-old Cre+VDRfl/fl kidneys (Figure 7B) compared with Cre–VDRfl/fl kidneys (Figure 7A), which is in agreement with the increased serum phosphate level. Quantification of renal NPT2a mRNA level by qRT-PCR revealed a 4-fold increase in Cre+VDRfl/fl mice (P < 0.05; Figure 7C), confirming the immunohistochemical analysis. Concerning 1,25(OH)2D serum levels, these are mainly regulated by renal CYP27B1 expression, which hydroxylates 25-hydroxyvitamin D to its active form. In accordance with the increased 1,25(OH)2D serum levels, CYP27B1 mRNA level was significantly increased in Cre+VDRfl/fl kidney (P < 0.01; Figure 7D) while gene expression of the catabolic enzyme CYP24 was not changed (Figure 7E). It is noteworthy that no difference in renal VDR mRNA levels was observed between the 2 genotypes (Figure 7F).
Figure 7. Chondrocyte-specific VDR inactivation affects phosphate–vitamin D homeostasis by decreasing FGF23 expression in bone.
(A and B) Immunohistochemical staining of renal NPT2a in 15-day-old Cre–VDRfl/fl (A) and Cre+VDRfl/fl (B) mice. Scale bar: 50 μm. (C–G) qRT-PCR analysis of renal NPT2a (C), CYP27B1 (D), CYP24 (E), and VDR (F) mRNA expression in 15-day-old mice and of FGF23 (G) mRNA expression in 1-week-old and 15-day-old femora, corrected for HPRT mRNA levels. Cre+VDRfl/fl values are expressed relative to Cre–VDRfl/fl set at 100%. (H) Serum FGF23 level was significantly decreased in 15-day-old Cre+VDRfl/fl mice. *P < 0.05; **P < 0.01 versus Cre–VDRfl/fl.
These data suggest a link between the altered renal expression of these 2 genes and VDR inactivation in chondrocytes. A plausible factor that may affect 1,25(OH)2D as well as phosphate serum levels is FGF23, as FGF23 suppresses the expression of the renal phosphate transporter NPT2a and of CYP27B1 (16). In addition, bone has been identified as the largest source and regulatory site of FGF23, and FGF23 expression is induced by 1,25(OH)2D3 (17). Accordingly, FGF23 mRNA level was significantly decreased in Cre+VDRfl/fl femora of 1-week-old and 15-day-old mice, as revealed by qRT-PCR (P < 0.01; Figure 7G). In addition, FGF23 serum levels were 43% lower in 15-day-old Cre+VDRfl/fl mice compared with Cre–VDRfl/fl mice (P < 0.01; Figure 7H). As with the age-related changes of serum phosphate and 1,25(OH)2D levels, no difference in FGF23 serum levels was observed between the 2 genotypes in 8-week-old mice (71.4 ± 6.3 pg/ml in Cre–VDRfl/fl versus 76.9 ± 12.2 pg/ml in Cre+VDRfl/fl mice). These data indicate that the increased phosphate and 1,25(OH)2D serum concentrations before weaning are likely caused by decreased FGF23 production in bone, leading to increased renal NPT2a and CYP27B1 mRNA expression.
Genomic action of 1,25(OH)2D3 in chondrocytes regulates FGF23 expression in osteoblasts in vitro.
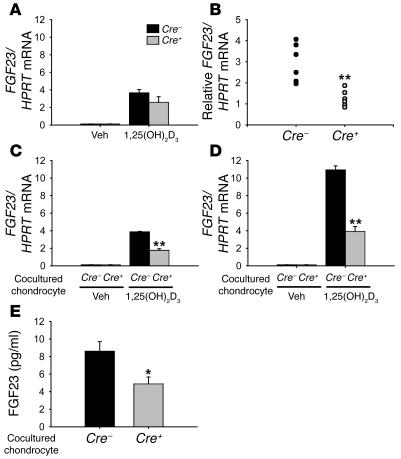
In bone, the cells identified as producing FGF23 are osteoblasts and osteocytes. To elucidate whether chondrocytes express FGF23 and whether this expression is regulated by 1,25(OH)2D3, in vitro experiments were performed. Treatment with 1,25(OH)2D3 (10–8 M, 48 hours) induced FGF23 mRNA expression 100-fold in primary osteoblasts derived from either Cre+VDRfl/fl or Cre–VDRfl/fl mice (Figure 8A). On the other hand, the FGF23 message was undetectable in cultured primary chondrocytes, both in basal conditions and after 1,25(OH)2D3 treatment (data not shown). These data indicate that FGF23 expression is restricted to osteoblasts and suggest that the reduced FGF23 expression in Cre+VDRfl/fl mice most likely results from altered expression of a chondrocyte-derived factor due to lack of VDR action. Several in vitro experiments were performed to investigate this hypothesis. First, metatarsals at E16.5, a stage when interaction between osteoblasts and chondrocytes is abundantly present, were cultured for 24 hours, after which 1 metatarsal was treated with 1,25(OH)2D3 (10–8 M) and the contralateral with vehicle. The relative induction of FGF23 mRNA by 1,25(OH)2D3 treatment was significantly higher in Cre–VDRfl/fl than in Cre+VDRfl/fl metatarsals (P < 0.005; Figure 8B). However, the number of osteoblasts in the metatarsals may be different between the 2 genotypes, as vascular invasion and formation of the primary ossification center is delayed in Cre+VDRfl/fl metatarsals (Figure 4). We therefore introduced a coculture system of primary osteoblasts and chondrocytes to characterize more precisely their interaction on FGF23 expression. Primary chondrocytes were isolated from both genotypes and cultured during 4 days, after which osteoblasts isolated from Cre–VDRfl/fl calvaria were added to the culture. Treatment with 1,25(OH)2D3 induced FGF23 mRNA expression in cocultures regardless of the presence of VDR in chondrocytes. However, the increase in FGF23 mRNA expression by 1,25(OH)2D3 treatment was significantly impaired when Cre+VDRfl/fl chondrocytes were used in cocultures, as compared with Cre–VDRfl/fl chondrocytes (P < 0.001; Figure 8C), indicating that a 1,25(OH)2D3-responsive chondrocyte-derived factor contributes to FGF23 expression in osteoblasts.
Figure 8. Signaling of 1,25(OH)2D3 in chondrocytes supports FGF23 expression in osteoblasts.
(A–D) qRT-PCR analysis of FGF23 mRNA expression in primary osteoblast cultures (A), in E16.5 metatarsal cultures (B), in cocultures of chondrocytes and osteoblasts (C), and in primary osteoblasts cultured in the Transwell system with chondrocytes cultured on the membrane (D), corrected for HPRT mRNA copies. Cultures derived from Cre–VDRfl/fl or Cre+VDRfl/fl mice were treated with 1,25(OH)2D3 (10–8 M) for 48 hours or vehicle. FGF23 mRNA expression in 1,25(OH)2D3-treated metatarsals is depicted as an increase relative to its vehicle-treated contralateral (B). (E) FGF23 protein level was measured in the culture media of the Transwell system after 1,25(OH)2D3 treatment. In the cocultures, only Cre–VDRfl/fl osteoblasts were used whereas the genotype of the chondrocytes varied as indicated. *P < 0.05; **P < 0.005 versus Cre–VDRfl/fl.
Finally, to elucidate whether FGF23 mRNA expression in osteoblasts was modulated by a secreted factor produced by chondrocytes, a Transwell system was used with primary chondrocytes from either genotype cultured on the insert and primary osteoblasts derived from Cre–VDRfl/fl calvaria on the bottom plate. No manifest differences in the growth and differentiation of osteoblasts and chondrocytes were observed between the different conditions, as osteocalcin expression by the osteoblasts and Col10 expression by the chondrocytes were comparable (data not shown). The induction of FGF23 mRNA level by 1,25(OH)2D3 was significantly higher in osteoblasts cultured with Cre–VDRfl/fl chondrocytes than in cultures with Cre+VDRfl/fl chondrocytes (P < 0.001; Figure 8D). In addition, 1,25(OH)2D3-treated osteoblasts showed a more pronounced induction of FGF23 mRNA levels when cultured with Cre–VDRfl/fl chondrocytes in the Transwell system than when cultured alone (compare FGF23 mRNA level in Figure 8D with level in Figure 8A). In agreement with the results of mRNA expression, FGF23 protein level was more increased in conditioned media from cocultures with Cre–VDRfl/fl chondrocytes than from cultures with Cre+VDRfl/fl chondrocytes (P < 0.01; Figure 8E). These results indicate that vitamin D genomic signaling in chondrocytes contributes to FGF23 expression in osteoblasts by altering the expression of a secreted factor.
Discussion
VDR is a 1,25(OH)2D3-regulated transcription factor required for normal mineral and skeletal homeostasis, which it contributes to mainly by regulating intestinal calcium absorption. The predominant effects of vitamin D deficiency or resistance before the end of puberty are impaired bone mineralization and abnormal growth-plate structure. Both can be corrected by a high-calcium diet. Nevertheless, a specific but possibly redundant role for VDR in bone metabolism has been suggested by in vitro data using _VDR_-null cells (11) and by in vivo overexpression of VDR in osteoblasts (12). To elucidate the function of VDR during endochondral bone development, we generated mice with chondrocyte-specific inactivation of VDR. Loss of VDR in chondrocytes did not interfere with chondrocyte development but resulted unexpectedly in increased trabecular bone mass during early postnatal life due to reduced osteoclastogenesis accompanied by decreased vascularization. In addition, serum 1,25(OH)2D and phosphate levels were transiently increased in juvenile mice; this resulted from decreased FGF23 production by osteoblasts. Taken together, these data reveal what we believe to be a novel role for VDR in chondrocytes as regulators of osteoclastogenesis and controllers of phosphate homeostasis, which they achieve by affecting FGF23 production.
During endochondral bone development, chondrocytes proliferate and subsequently differentiate into hypertrophic chondrocytes that finally undergo apoptosis while being replaced by bone. Chondrocytes lacking VDR expression develop normally; this agrees with previous findings in _VDR_-null mice (3). In this latter model, the typical morphology of rickets with enlargement of the zone of hypertrophic chondrocytes mainly develops after weaning (2, 3, 7). These features can be rescued by a high-calcium/high-lactose diet, which suggests an indirect function of VDR. Recently, Sabbagh et al. (18) demonstrated that rickets is due to impaired apoptosis of the late hypertrophic chondrocytes secondary to hypophosphatemia. Consistent with this model, the length of the zone of hypertrophic chondrocytes in chondrocyte-specific _VDR_-null mice was not altered, as calcium level was normal and phosphate level was even increased. Rather, a temporary decrease in the differentiation of hypertrophic chondrocytes was observed, as Col10 expression was reduced in 15-day-old mice. These results indicate that VDR expression in chondrocytes does not contribute to the proliferation of chondrocytes but rather minimally affects hypertrophic differentiation.
During hypertrophic differentiation, chondrocytes synthesize VEGF, a key regulator of vascular invasion, first at the primary ossification center and later at the growth plate; these are essential steps in endochondral ossification. Deficient VEGF synthesis by hypertrophic chondrocytes (19) or reduced release of VEGF from the matrix (20) due to MMP-9 inactivation results in decreased vascular invasion at the growth plate and expansion of the hypertrophic chondrocyte layer. As a known regulator of VEGF transcription, 1,25(OH)2D3 promotes vascularization at the growth plate (14). In agreement with these findings, the present results now reveal that VDR inactivation in chondrocytes results in decreased VEGF expression before weaning, associated with a reduced number of blood vessels at the border of the growth plate. Also, at the stage of primary ossification during embryonic bone development, chondrocytic _VDR_-null tibiae exhibited decreased angiogenic invasion into the cartilage anlage compared with VDR WT mice. However, at 8 weeks, blood vessel invasion at the growth plate was normal, suggesting that this process was rescued. This temporary phenomenon is also observed in MMP-9–null mice, in which the enlarged hypertrophic chondrocyte zone is only detected until 8 weeks (20). Taken together, these results indicate that timely VEGF mRNA expression by hypertrophic chondrocytes, required for vascular invasion of this zone, is partly dependent on 1,25(OH)2D3 genomic action.
Concomitant with vascular invasion, the calcified matrix surrounding hypertrophic chondrocytes became degraded by chondroclasts/osteoclasts. In embryonic tibiae, the number of TRAP-positive multinuclear cells was significantly reduced when VDR expression was lacking in chondrocytes. Also, at later ages, fewer osteoclasts were detected, particularly at the border of the growth plate but also in the proximal diaphysis. These data were corroborated by decreased mRNA expression of calcitonin receptor, a specific marker for osteoclasts.
A plausible explanation for the reduced number of osteoclasts is impaired expression of RANKL, an essential factor in osteoclastogenesis. This factor is mainly produced by osteoblasts or mesenchymal cells under the control of several cytokines and hormones, including 1,25(OH)2D3 (21). We identified a novel role for chondrocytes in supporting osteoclastogenesis by expressing RANKL, an effect regulated by 1,25(OH)2D3 genomic action. The evidence therefore is provided by both in vivo and in vitro findings. First, RANKL mRNA expression was decreased in neonatal femora lacking VDR expression in chondrocytes. Second, growth-plate chondrocytes expressed RANKL in vitro, confirming a recent finding by Takamoto et al. (22). Comparable to WT osteoblasts, the mRNA expression of RANKL in WT chondrocytes was increased by 1,25(OH)2D3 treatment whereas this induction was lacking in VDR-deficient chondrocytes. Third, WT chondrocytes supported osteoclastogenesis in 1,25(OH)2D3-treated cocultures with splenocytes although less efficiently than WT osteoblasts. Osteoclasts were, however, not formed when chondrocytes lacked VDR. It is noteworthy that RANKL expression and osteoclast formation were normal when _VDR_-deficient chondrocytes were stimulated with PGE2, reminiscent of the osteoblast characteristics derived from systemic _V_DR-null mice (10).
These results indicate that 1,25(OH)2D3 genomic action in chondrocytes contributes to normal RANKL expression and timely osteoclast invasion in the primary ossification center and later at the border of hypertrophic chondrocytes during metaphyseal growth. The observed decrease in osteoclastogenesis in Cre+VDRfl/fl mice may also explain the increased BV/TV observed before weaning. Moreover, no changes in osteoblast parameters were noticed at these stages, as both Runx2 and osteocalcin mRNA expression did not differ between genotypes. Additionally, in vitro osteogenic differentiation of bone marrow stromal cells was not altered in Cre+VDRfl/fl mice. The increase in bone mass was only observed in juvenile mice. This is consistent with the temporary role of the growth plate, which remains active through puberty but fuses in adult mice.
Bone metabolism and mineral homeostasis are closely interconnected and regulated mainly by the hormones 1,25(OH)2D3 and PTH. As elucidated in this study, 1,25(OH)2D3 genomic actions directly affect endochondral bone development by regulating specific gene expression. The 1,25(OH)2D3/VDR pathway also plays a role in mineral homeostasis, mainly by inducing intestinal and renal calcium transporter gene expression, thereby promoting calcium (re)absorption. The effect of 1,25(OH)2D3 on phosphate homeostasis is, however, more complex, as it stimulates phosphate (re)absorption both directly (23) and indirectly by downregulating PTH secretion (24) while, on the other hand, it increases FGF23 secretion, thereby promoting renal phosphate excretion (16). In this latter pathway, 1,25(OH)2D3 stimulates FGF23 expression in osteoblasts, which in turn decreases renal 1α-hydroxylase expression and NPT2 apical localization, resulting in impaired phosphate reabsorption. This suggests that bone is involved in mineral homeostasis, which it contributes to not only by releasing calcium and phosphate but also by secreting this phosphaturic factor.
We now provide evidence that VDR action in chondrocytes contributes to this endocrine negative feedback loop between 1,25(OH)2D3 and FGF23. In 15-day-old chondrocyte-specific _VDR_-null mice, serum 1,25(OH)2D and phosphate levels were significantly increased, an unexpected finding. The increased 1,25(OH)2D levels correlated with and most likely resulted from enhanced renal CYP27B1 mRNA levels in these mice. Likewise, the increased phosphate levels can be explained by abundant NPT2a localization at the apical membrane, as shown by immunohistochemistry, and by enhanced NPT2a mRNA expression. In contrast, serum calcium and PTH levels were normal and therefore provide no explanation for the altered serum 1,25(OH)2D and phosphate levels. Searching for the signaling mechanism between VDR inactivation in chondrocytes and altered renal expression of CYP27B1 and NPT2a, we investigated the expression of the major phosphatonin FGF23. FGF23 mRNA levels were decreased in bone from chondrocyte-specific _VDR_-null mice, which explains the decreased serum FGF23 levels in these mice, as bone is the major source of circulating FGF23. This reduced FGF23 level can clarify the increased CYP27B1 and NPT2 expression in the kidney, which in its turn results in increased 1,25(OH)2D and phosphate levels in chondrocyte-specific _VDR_-null mice. It is noteworthy that renal CYP24 expression was not affected in chondrocyte-specific _VDR_-null mice, despite the increased serum 1,25(OH)2D level. However, FGF23 has recently been reported to induce CYP24 expression in the kidney (25). A plausible explanation reconciling both findings is that the decreased circulating FGF23 levels in chondrocyte-specific _VDR_-null mice neutralize the inducing effect of 1,25(OH)2D on renal CYP24 expression.
The contribution of chondrocytes to FGF23 expression in bone is most likely indirect, as we noticed that chondrocytes do not express FGF23. The present data reveal that a soluble chondrocyte-derived factor induced by 1,25(OH)2D3 genomic signaling contributes to FGF23 expression in osteoblasts. To date, the mechanism of FGF23 induction by 1,25(OH)2D3 is still not fully characterized. Transcriptional regulation via VDR has been proposed although a VDRE has not yet been identified in the promoter region of FGF23. In addition, indirect regulation by an intermediary factor has been suggested (17, 26). We now expand this model by adding a paracrine factor secreted by chondrocytes in a 1,25(OH)2D3-dependent manner. Further investigations are necessary to identify this unknown factor.
The biological effect of VDR inactivation in chondrocytes is observed in early life but is transient. Indeed, the relative increase in bone mass, renal CYP27B1 expression, serum 1,25(OH)2D3, and phosphate disappeared at 8 weeks of age when the growth plate of mice became less active as the long bones nearly attained their final length.
In conclusion, the present study indicates that 1,25(OH)2D3 genomic action in chondrocytes is not crucial for growth-plate development but regulates via paracrine factors bone development and phosphate homeostasis. These vitamin D–regulated genes are essential for timely vascularization and osteoclast invasion into the hypertrophic chondrocyte zone and participate in the interactive loop between FGF23 and 1,25(OH)2D3. This study also elucidates a novel function for chondrocytes as coplayers in the endocrine function of bone.
Methods
Animals.
Targeted mutagenesis to generate _VDRfl/fl_mice was achieved by homologous and Cre/loxP–mediated site-specific recombination in embryonic stem cells. The targeting vector consisted of cDNA containing lox P sites upstream and downstream of exon 2 (Figure 1A), as described previously (7). Chondrocyte-specific inactivation of VDR was obtained by crossing _VDRfl/fl_mice with transgenic mice expressing Cre recombinase under the control of Col2 gene promoter (27). After appropriate breeding, Cre+VDRfl/fl and Cre–VDRfl/fl littermates were used in the analysis. Genotyping was performed by Southern blot analysis or PCR of genomic DNA extracted from tail biopsies. All mice were bred in our animal housing facilities (Proefdierencentrum Leuven) and received normal diet containing 1.1% calcium and 0.8% phosphate (Standard; Carfil Quality-Pavan Service). These experiments were approved by the ethical committee of Katholieke Universiteit Leuven.
The age of the embryos was stated as E0.5, which was the morning a vaginal plug was observed after overnight mating. When indicated, mice received 2 intraperitoneal injections of the fluorochrome calcein (16 mg/kg; Sigma-Aldrich) 7 and 3 days before sacrifice. Blood was collected, and kidneys, intestine, and bones were dissected and processed as described (7, 28).
Serum biochemistry.
Calcium and phosphate were analyzed by Synchron Clinical System (Beckman Coulter). Levels of 1,25(OH)2D and PTH were determined using [125I] 1,25(OH)2D RIA kit (DiaSorin) and mouse-PTH ELISA kit (Immutopics), respectively. FGF23 protein levels in serum and cell culture media were determined using Human Intact FGF-23 ELISA kit (Kainos Laboratories Inc.) (n = 6 per genotype).
Bone length and BMD of the femur.
The left femur of 8-week-old mice (n = 8 per genotype) was fixed in Burkhardt’s solution. The length was measured using a caliper (Digimatic; Mitutoyo), and BMD was assessed by quantitative computed tomography, using Stratec XCT Research M+ (Norland Medical Systems Inc.) (29).
Histology, immunohistochemistry, and histomorphometry.
Tibiae from E15.5 (n = 6–7 per genotype), neonatal (n = 8), 15-day-old (n = 8), and 8-week-old (n = 8) mice were analyzed. Left tibiae were fixed in Burkhardt’s solution, embedded undecalcified in methyl methacrylate, and sectioned at 10 μm. Right tibiae were fixed in 2% paraformaldehyde, decalcified in 0.5 M EDTA (pH 7.4)/PBS prior to dehydration, embedded in paraffin, and sectioned at 5 μm.
For general morphological analysis, decalcified sections were stained with Harris H&E or with 2% toluidine blue. Methyl methacrylate sections were stained according to the von Kossa method to assess mineralized bone. Osteoclasts were visualized on paraffin sections reacted for TRAP activity (28). Additional sections were used for CD31 and collagen 2 staining as previously described (28, 30). Histomorphometric analysis was done as previously described (28, 29), using a Kontron Elektronik image-analyzing system (KS 400 V 3.00; Zeiss). Dynamic bone parameters were calculated using formulas described previously (31).
Kidneys were incubated overnight in 30% sucrose after fixation in 4% paraformaldehyde for 2 hours, embedded in Shandon Cryomatrix (Thermo Electron Corp.), and sectioned at 5 μm. Immunohistochemical staining for NPT2a was performed with rabbit anti-NPT2a in 1:400 dilutions (32) followed by incubation with horseradish peroxidase–conjugated goat anti-rabbit immunoglobulin (EnVision system; Dako). Harris H&E was used for counterstaining.
Primary osteoblast, chondrocyte, and bone marrow stromal cell cultures and cocultures.
Primary growth-plate chondrocytes were isolated from proximal tibiae and distal femora of 3-day-old mice by 0.2% collagenase-A digestion (30). From the same mice, primary osteoblasts were isolated from calvaria by sequential digestion with 0.1% collagenase A and 0.2% dispase. Osteoblastic cells from the second to fifth fraction were pooled (33). Cells were cultured for 4 days (40,000 cells/cm2), then treated with 10–8 M and 10–10 M 1,25(OH)2D3 (a kind gift from J.P. Vandevelde, Solvay, Weesp, The Netherlands), 10–6 M PGE2, (Sigma-Aldrich), or vehicle for another 2 or 3 days, whereafter cells were harvested for RNA isolation. Bone marrow stromal cells isolated from 15-day-old femora were cultured according to the method described previously (34). To assess CFU osteoblast, cells were cultured in 6-well plates (52,000 cells/cm2) for 10 days and 21 days, whereafter they were stained for alkaline phosphatase or with alizarin red, respectively (34).
The regulation of FGF23 expression was studied in cocultures of primary osteoblasts and chondrocytes. Two types of coculture were used: either the 2 cell types were cultured adjacent to each other or they were cultured separated by a membrane. In the first condition, Cre–VDRfl/fl or Cre+VDRfl/fl chondrocytes were cultured in 12-well plates (40,000 cells/cm2) in DMEM/F12 (1:1) (Invitrogen) supplemented with 10% FCS, 50 μg/ml ascorbic acid, and 100 μg/ml sodium pyruvate for 4 days, whereafter primary Cre–VDRfl/fl osteoblasts (40,000 cells/cm2) were added. In the second setup, the same cell types were used, but chondrocytes were cultured on BD Falcon cell culture insert (16,000 cells/cm2; pore size 0.4 μm), and after 4 days, osteoblasts were seeded in the lower well. After 2 days, cocultures were treated with 10–8 M 1,25(OH)2D3 for 48 hours. All quantifications were performed on 4 wells per group and repeated 2 to 4 times.
In vitro osteoclast differentiation.
Osteoclast formation was studied in cocultures of primary osteoblasts or chondrocytes and spleen cells using all 4 combinations of genotypes. Osteoblasts (23,000 cells/cm2) or chondrocytes (45,000 cells/cm2) were cultured in 8-well chamber slides (Lab-Tek II; Nunc) in α-MEM/10% FCS for 6 hours, whereafter spleen cells (230,000 cells/cm2) were added. Cultures were treated with 10–8 M 1,25(OH)2D3 or 10–6 M PGE2 for 7 days, with medium and factors replaced every 2 days. At the end of the culture period, cells were stained for TRAP (33). TRAP-positive multinuclear cells containing more than 3 nuclei were identified as osteoclasts.
Metatarsal cultures.
Right and left metatarsals were dissected from E16.5 embryos (n = 6 per genotype), stripped of skin and surrounding tissues, and cultured on a BD Falcon insert membrane (pore size, 0.4 μm) in 12-well plates in BGJb medium (Invitrogen) supplemented with 0.1% BSA, 25 μg/ml ascorbic acid, and 10 mM β-glycerophosphate. After 24 hours, the right metatarsal was treated with 10–8 M 1,25(OH)2D3 and the contralateral with vehicle for 2 days, whereafter RNA was isolated.
Isolation of RNA and qRT-PCR.
Total RNA of femora from neonatal, 1-week-old, 15-day-old, and 8-week-old mice (n = 8 per group), of kidneys from 15-day-old mice (n = 8 per group), and of cultured metatarsals was extracted with Trizol (Invitrogen). RNA from cultured chondrocytes or osteoblasts was isolated using Trizol LS (Invitrogen) or RNeasy Mini Kit (Qiagen). Subsequently, cDNA was synthesized using reverse transcriptase SuperScript II RT (Invitrogen). Real-time qRT-PCR was performed on an ABI Prism 7700 Sequence Detector (Applied Biosystems). Specific forward and reverse oligonucleotide primers and probes with fluorescent dye (FAM) and quencher (TAMRA) were used for calcitonin receptor, Col2, Col10, CYP24, CYP27B1, FGF23, OPG, osteocalcin, RANKL, Runx2, VEGF, and VDR. Expression levels were normalized for hypoxanthine-guanine phosphoribosyl transferase (HPRT) expression (Supplemental Table 1). NPT2a mRNA expression was analyzed by TaqMan Gene Expression Assays (ID Mm00441450 m1; Applied Biosystems).
Statistics.
Results are expressed as the mean ± SEM. To assess the effect of genotype or treatment, data were compared by 2-tailed Student’s t test or Mann-Whitney U test after F test using StatView (SAS) software. P < 0.05 was considered significant.
Supplementary Material
Supplemental data
Acknowledgments
We are grateful to R. Behringer for providing Col2a1 Cre mice, to J. Biber for providing NPT2a antiserum, and to N. Smets, I. Jans, K. Moerman, and A. Vanden Bosch for technical help. This work was supported by a grant from the Fund for Scientific Research–Flanders (FWO; G. 0508.05). C. Maes is a postdoctoral fellow from FWO (Belgium).
Footnotes
Nonstandard abbreviations used: BMD, bone mineral density; BV/TV, trabecular bone volume; Col2, collagen 2a1; Col2Cre, Cre driven by collagen 2 promoter; Cre–VDRfl/fl, Col2Cre–/–VDRfl/fl (mice); HPRT, hypoxanthine-guanine phosphoribosyl transferase; NPT2a, sodium phosphate cotransporter type IIa; 1,25(OH)2D3, 1α25-dihydroxyvitamin D3; OPG, osteoprotegerin; PGE2, prostaglandin E2; PTH, parathyroid hormone; qRT-PCR, quantitative real-time PCR; RANKL, receptor activator of NF-κB ligand; Runx2, runt-related transcription factor 2; TRAP, tartrate-resistant acid phosphatase; VDR, vitamin D receptor; VDRfl/fl, floxed VDR (mice).
Conflict of interest: The authors have declared that no conflict of interest exists.
Citation for this article: J. Clin. Invest. 116:3150–3159 (2006). doi:10.1172/JCI29463
References
- 1.Haussler M.R., et al. The nuclear vitamin D receptor: biological and molecular regulatory properties revealed. J. Bone Miner. Res. 1998;13:325–349. doi: 10.1359/jbmr.1998.13.3.325. [DOI] [PubMed] [Google Scholar]
- 2.Yoshizawa T., et al. Mice lacking the vitamin D receptor exhibit impaired bone formation, uterine hypoplasia and growth retardation after weaning. Nat. Genet. 1997;16:391–396. doi: 10.1038/ng0897-391. [DOI] [PubMed] [Google Scholar]
- 3.Li Y.C., et al. Targeted ablation of the vitamin D receptor: an animal model of vitamin D-dependent rickets type II with alopecia. Proc. Natl. Acad. Sci. U. S. A. 1997;94:9831–9835. doi: 10.1073/pnas.94.18.9831. [DOI] [PMC free article] [PubMed] [Google Scholar]
- 4.Kitanaka S., et al. Inactivating mutations in the 25-hydroxyvitamin D3 1α-hydroxylase gene in patients with pseudovitamin D-deficiency rickets. . N. Engl. J. Med. . 1998;338:653–661. doi: 10.1056/NEJM199803053381004. [DOI] [PubMed] [Google Scholar]
- 5.Panda D.K., et al. Targeted ablation of the 25-hydroxyvitamin D 1α-hydroxylase enzyme: evidence for skeletal, reproductive, and immune dysfunction. Proc. Natl. Acad. Sci. U. S. A. 2001;98:7498–7503. doi: 10.1073/pnas.131029498. [DOI] [PMC free article] [PubMed] [Google Scholar]
- 6.Dardenne O., Prud’homme J., Arabian A., Glorieux F.H., St-Arnaud R. Targeted inactivation of the 25-hydroxyvitamin D3-1α-hydroxylase gene (CYP27B1) creates an animal model of pseudovitamin D-deficiency rickets. . Endocrinology. 2001;142:3135–3141. doi: 10.1210/endo.142.7.8281. [DOI] [PubMed] [Google Scholar]
- 7.Van Cromphaut S.J., et al. Duodenal calcium absorption in vitamin D receptor-knockout mice: functional and molecular aspects. Proc. Natl. Acad. Sci. U. S. A. 2001;98:13324–13329. doi: 10.1073/pnas.231474698. [DOI] [PMC free article] [PubMed] [Google Scholar]
- 8.Balsan S., et al. Long-term nocturnal calcium infusions can cure rickets and promote normal mineralization in hereditary resistance to 1,25-dihydroxyvitamin D. J. Clin. Invest. 1986;77:1661–1667. doi: 10.1172/JCI112483. [DOI] [PMC free article] [PubMed] [Google Scholar]
- 9.Amling M., et al. Rescue of the skeletal phenotype of vitamin D receptor-ablated mice in the setting of normal mineral ion homeostasis: formal histomorphometric and biomechanical analyses. Endocrinology. 1999;140:4982–4987. doi: 10.1210/endo.140.11.7110. [DOI] [PubMed] [Google Scholar]
- 10.Takeda S., et al. Stimulation of osteoclast formation by 1,25-dihydroxyvitamin D requires its binding to vitamin D receptor (VDR) in osteoblastic cells: studies using VDR knockout mice. Endocrinology. . 1999;140:1005–1008. doi: 10.1210/endo.140.2.6673. [DOI] [PubMed] [Google Scholar]
- 11.Sooy K., Sabbagh Y., Demay M.B.2005Osteoblasts lacking the vitamin D receptor display enhanced osteogenic potential in vitro . J. Cell. Biochem. 9481–87. [DOI] [PubMed] [Google Scholar]
- 12.Gardiner E.M., et al. Increased formation and decreased resorption of bone in mice with elevated vitamin D receptor in mature cells of the osteoblastic lineage. FASEB J. 2000;14:1908–1916. doi: 10.1096/fj.99-1075com. [DOI] [PubMed] [Google Scholar]
- 13.Karsenty G., Wagner E.F. Reaching a genetic and molecular understanding of skeletal development. Dev. Cell. 2002;2:389–406. doi: 10.1016/s1534-5807(02)00157-0. [DOI] [PubMed] [Google Scholar]
- 14.Lin R., et al. 1α,25-dihydroxyvitamin D3 promotes vascularization of the chondro-osseous junction by stimulating expression of vascular endothelial growth factor and matrix metalloproteinase 9. . J. Bone Miner. Res. 2002;17:1604–1612. doi: 10.1359/jbmr.2002.17.9.1604. [DOI] [PubMed] [Google Scholar]
- 15.Mirams M., Robinson B.G., Mason R.S., Nelson A.E. Bone as a source of FGF23: regulation by phosphate? Bone. 2004;35:1192–1199. doi: 10.1016/j.bone.2004.06.014. [DOI] [PubMed] [Google Scholar]
- 16.Saito H., et al. Human fibroblast growth factor-23 mutants suppress Na+-dependent phosphate co-transport activity and 1α,25-dihydroxyvitamin D3 production. . J. Biol. Chem. 2003;278:2206–2211. doi: 10.1074/jbc.M207872200. [DOI] [PubMed] [Google Scholar]
- 17.Kolek O.I., et al. 1α,25-Dihydroxyvitamin D3 upregulates FGF23 gene expression in bone: the final link in a renal-gastrointestinal-skeletal axis that controls phosphate transport. . Am. J. Physiol. Gastrointest. Liver Physiol. 2005;289:G1036–G1042. doi: 10.1152/ajpgi.00243.2005. [DOI] [PubMed] [Google Scholar]
- 18.Sabbagh Y., Carpenter T.O., Demay M.B. Hypophosphatemia leads to rickets by impairing caspase-mediated apoptosis of hypertrophic chondrocytes. Proc. Natl. Acad. Sci. U. S. A. 2005;102:9637–9642. doi: 10.1073/pnas.0502249102. [DOI] [PMC free article] [PubMed] [Google Scholar]
- 19.Haigh J.J., Gerber H.P., Ferrara N., Wagner E.F. Conditional inactivation of VEGF-A in areas of collagen2a1 expression results in embryonic lethality in the heterozygous state. Development. 2000;127:1445–1453. doi: 10.1242/dev.127.7.1445. [DOI] [PubMed] [Google Scholar]
- 20.Vu T.H., et al. MMP-9/gelatinase B is a key regulator of growth plate angiogenesis and apoptosis of hypertrophic chondrocytes. Cell. 1998;93:411–422. doi: 10.1016/s0092-8674(00)81169-1. [DOI] [PMC free article] [PubMed] [Google Scholar]
- 21.Yasuda H., et al. Osteoclast differentiation factor is a ligand for osteoprotegerin/osteoclastogenesis-inhibitory factor and is identical to TRANCE/RANKL. . Proc. Natl. Acad. Sci. U. S. A. . 1998;95:3597–3602. doi: 10.1073/pnas.95.7.3597. [DOI] [PMC free article] [PubMed] [Google Scholar]
- 22.Takamoto M., et al. Hedgehog signaling enhances core-binding factor a1 and receptor activator of nuclear factor-kappaB ligand (RANKL) gene expression in chondrocytes. J. Endocrinol. 2003;177:413–421. doi: 10.1677/joe.0.1770413. [DOI] [PubMed] [Google Scholar]
- 23.Yamamoto H., et al. Alternative promoters and renal cell-specific regulation of the mouse type IIa sodium-dependent phosphate cotransporter gene. Biochim. Biophys. Acta. 2005;1732:43–52. doi: 10.1016/j.bbaexp.2005.11.003. [DOI] [PubMed] [Google Scholar]
- 24.Zhao N., Tenenhouse H.S. Npt2 gene disruption confers resistance to the inhibitory action of parathyroid hormone on renal sodium-phosphate cotransport. Endocrinology. 2000;141:2159–2165. doi: 10.1210/endo.141.6.7484. [DOI] [PubMed] [Google Scholar]
- 25.Inoue Y., et al. Role of the vitamin D receptor in FGF23 action on phosphate metabolism. Biochem. J. 2005;390:325–331. doi: 10.1042/BJ20041799. [DOI] [PMC free article] [PubMed] [Google Scholar]
- 26.Ito M., et al. Vitamin D and phosphate regulate fibroblast growth factor-23 in K-562 cells. Am. J. Physiol. Endocrinol. Metab. 2005;288:E1101–E1109. doi: 10.1152/ajpendo.00502.2004. [DOI] [PubMed] [Google Scholar]
- 27.Ovchinnikov D.A., Deng J.M., Ogunrinu G., Behringer R.R. Col2a1-directed expression of Cre recombinase in differentiating chondrocytes in transgenic mice. Genesis. 2000;26:145–146. [PubMed] [Google Scholar]
- 28.Maes C., et al. Impaired angiogenesis and endochondral bone formation in mice lacking the vascular endothelial growth factor isoforms VEGF164 and VEGF188. . Mech. Dev. 2002;111:61–73. doi: 10.1016/s0925-4773(01)00601-3. [DOI] [PubMed] [Google Scholar]
- 29.Daci E., Verstuyf A., Moermans K., Bouillon R., Carmeliet G. Mice lacking the plasminogen activator inhibitor 1 are protected from trabecular bone loss induced by estrogen deficiency. J. Bone Miner. Res. 2000;15:1510–1516. doi: 10.1359/jbmr.2000.15.8.1510. [DOI] [PubMed] [Google Scholar]
- 30.Maes C., et al. Soluble VEGF isoforms are essential for establishing epiphyseal vascularization and regulating chondrocyte development and survival. J. Clin. Invest. 2004;113:188–199. doi: 10.1172/JCI200419383. [DOI] [PMC free article] [PubMed] [Google Scholar]
- 31.Masuyama R., et al. Dietary calcium and phosphorus ratio regulates bone mineralization and turnover in vitamin D receptor knockout mice by affecting intestinal calcium and phosphorus absorption. J. Bone Miner. Res. 2003;18:1217–1226. doi: 10.1359/jbmr.2003.18.7.1217. [DOI] [PubMed] [Google Scholar]
- 32.Custer M., Lotscher M., Biber J., Murer H., Kaissling B. Expression of Na-P(i) cotransport in rat kidney: localization by RT-PCR and immunohistochemistry. Am. J. Physiol. 1994;266:F767–F774. doi: 10.1152/ajprenal.1994.266.5.F767. [DOI] [PubMed] [Google Scholar]
- 33.Daci E., Udagawa N., Martin T.J., Bouillon R., Carmeliet G. The role of the plasminogen system in bone resorption in vitro. J. Bone Miner. Res. 1999;14:946–952. doi: 10.1359/jbmr.1999.14.6.946. [DOI] [PubMed] [Google Scholar]
- 34.Miyamoto K., et al. Prostaglandin E2-mediated anabolic effect of a novel inhibitor of phosphodiesterase 4, XT-611, in the in vitro bone marrow culture. . J. Bone Miner. Res. 2003;18:1471–1477. doi: 10.1359/jbmr.2003.18.8.1471. [DOI] [PubMed] [Google Scholar]
Associated Data
This section collects any data citations, data availability statements, or supplementary materials included in this article.
Supplementary Materials
Supplemental data
