Novel roles for APC family members and Wingless/Wnt signaling during Drosophila brain development (original) (raw)
. Author manuscript; available in PMC: 2008 Apr 30.
Abstract
Construction of the brain is one of the most complex developmental challenges. Wnt signals shape all tissues, including the brain, and the tumor suppressor Adenomatous Polyposis Coli (APC) is a key negative regulator of Wnt/Wingless (Wg) signaling. We carried out the first assessment of the role of APC proteins in brain development, simultaneously inactivating both APC1 and APC2 in clones of cells in the Drosophila larval optic lobe. We focused on the medulla, where epithelial neural progenitors shift from symmetric to asymmetric divisions across the lateral-medial axis. Loss of both APCs triggers dramatic defects in optic lobe development. Double mutant cells segregate from wild-type neighbors, while double mutant neurons form tangled axonal knots, suggesting changes in cell adhesion. Strikingly, phenotypes are graded along the anterior-posterior axis. Activation of Wg signaling downstream of APC mimics these phenotypes, a dominant-negative TCF blocks them, and a known Wg target, decapentaplegic, is activated in double mutant clones, strongly suggesting that the phenotypes result from activated Wg signaling. We also explored the roles of classic cadherins in differential adhesion. Finally, we propose a model suggesting that Wg signaling regulates fine scale cell fates along the anterior-posterior axis, in part by creating an adhesion gradient, and consider possible alternate explanations for our observations.
Keywords: Mutation cluster region, familial adenomatous polyposis, adherens junctions, beta-catenin
INTRODUCTION
The developmental processes required to make an animal are often the same processes that go awry in cancer. The Wnt signaling pathway provides an excellent example. Wnt signaling is required for many essential events of embryonic development, including axis specification, neural patterning, and brain development (reviewed in Logan and Nusse, 2004). However, Wnt signaling is also inappropriately activated in several tumor types, most notably colorectal cancer (reviewed in Nathke, 2004).
Powerful developmental regulatory pathways like the Wnt pathway are kept off by stringent negative regulation. The tumor suppressor Adenomatous polyposis coli (APC), mutated in both familial adenomatous polyposis (FAP), a heritable form of colon cancer, and in many sporadic colorectal tumors, is a key part of the negative regulatory machinery for Wnt signaling. This machinery destabilizes the key Wnt effector ß-catenin (ßcat; Drosophila Armadillo; Arm; reviewed in Nelson and Nusse, 2004). In the absence of Wnt signals, ßcat is held in a complex with APC, a scaffolding protein Axin, and the kinases GSK-3ß and casein kinase I. While in this destruction complex, ßcat is phosphorylated by Casein kinase I and GSK-3ß and thus targeted for ubiquitination by an E3-ubiquitin ligase and proteasomal destruction. However, Wnt signals inactivate the destruction complex, allowing ßcat to accumulate in the cytoplasm and enter the nucleus. There it interacts with TCF/LEF family proteins to form bipartite transcription factors and activate downstream targets. In colon tumors, inactivating mutations of APC cause aberrant accumulation of cytoplasmic and nuclear ßcat, leading to the improper activation of downstream target genes, some of which regulate the cell cycle and promote proliferation. This blocks differentiation of colon cells that normally migrate from the crypts to the villi, and effectively locks them into a self-renewing stem cell-like fate (reviewed in Reya and Clevers, 2005).
We are interested in the normal roles of Wnt signaling during development, and how it is regulated. Wnt signaling plays key roles in virtually every tissue (reviewed in Logan and Nusse, 2004), including brain development (reviewed in Ciani and Salinas, 2005). Making an adult brain requires exquisitely precise temporal and spatial controls (reviewed in Tissir and Goffinet, 2003). Stem/progenitor cells, like those in the ventricular zone in the mammalian cortex, must proliferate extensively to give rise to large numbers of neurons. Next, neuronal daughters exit the cell cycle and migrate to appropriate locations; e.g., neurons must move out of the ventricular and subventricular zones along radial glial cell fibers and halt migration in the proper layer of the cortex. Finally, neurons differentiate into specific subtypes and extend axons and neurites, establishing the network of connectivity required for integrated control of the brain and the entire animal. Numerous signal transduction pathways act combinatorially to specify the diverse set of cell types found in the brain.
The developing mammalian brain has a complex pattern of expression of Wnt ligands that help specify cell fate and proliferation (Ciani and Salinas, 2005). For example, mouse Wnt1 regulates fates in the midbrain, cerebellum, and spinal cord (McMahon and Bradley, 1990) while Wnt3a helps specify the hippocampus (Lee et al., 2000). When Wnt1 and Wnt3a are ectopically expressed, overgrowth results, without altering cell fates along the dorsoventral axis of the neural tube, consistent with a role in progenitor cell proliferation (Megason and McMahon, 2002). Expression of constitutively-active ßcat in neuronal progenitor cells leads to an enlarged cerebral cortex with more neuroepithelial progenitors. Despite this, progenitors differentiated, giving rise to neurons in relatively normal spatial patterns (Chenn and Walsh, 2002).
As key regulators of Wnt signaling, it is not surprising that both mammalian APC family members are expressed in the brain. APC is broadly expressed with high levels in the brain during embryogenesis and adulthood (Bhat et al., 1994; Groden et al., 1991). Mice homozygous mutant for APC die with patterning defects during early gastrulation (Chazaud and Rossant, 2006; Moser et al., 1995). Mammalian APC2 is also highly expressed in the CNS (Yamanaka et al., 2002), but APC2 mutant mice have not been reported. Further, no one has explored the potential normal roles of mammalian APCs in brain development.
In addition to regulating normal brain development, activated Wnt signaling is also associated with a subset of primitive neuroectodermal tumors such as medulloblastoma, which are thought to be derived from multipotent, cerebellar progenitor cells (Fogarty et al., 2005). There is an increased frequency of medulloblastoma in FAP patients, and mutations in APC, ßcat, and Axin1 also occur in sporadic medulloblastoma, with a cumulative frequency of ~15% (Fogarty et al., 2005). Understanding the normal role of Wnt signaling in the brain may help us better understand these tumors.
Drosophila is excellent model system to examine the roles of Wnt signaling in brain development. During embryogenesis, the fly Wnt Wingless (Wg) patterns neuroblasts along the anterior-posterior (A/P) axis (reviewed in Logan and Nusse, 2004). During larval development it helps direct the dramatic remodeling of the brain necessary to meet the new sensory and motor needs of the adult (Kaphingst and Kunes, 1994). For example, the larval optic lobe produces the adult optic processing center. It invaginates from the procephalic ectoderm during embryogenesis (Green et al., 1993). The 30–40 proliferative progenitor cells of the 1st instar optic lobe form an epithelial sphere (reviewed in Meinertzhagen and Hanson, 1993). By the end of the 2nd instar they develop into two distinct populations: the outer proliferative center (OPC; ~700 neuroblasts) and the inner proliferative center (IPC; ~400 neuroblasts), and production of postmitotic neurons begins. A medial proliferation zone at the edge of the OPC gives rise to ~40,000 cells that make up the medulla, while a second proliferative zone, separated from the medulla by the laminar furrow, gives rise to the lamina (Hofbauer and Campos-Ortega, 1990). The OPC provides an excellent place to identify molecular mechanisms governing the behavior of progenitor cells and their progeny, coordinating proliferation, migration, and cell-cell interactions.
The secreted signals Hedgehog, Wg, and Decapentaplegic (Dpp) help confer identity to cells in the larval brain, as they do in other tissues. Hedgehog made by photoreceptor neurons regulates proliferation and development of laminar cells (Huang and Kunes, 1998). Wg is expressed by cells at the posterior dorsal and ventral tips of the horseshoe-shaped OPC, and helps organize the A/P axis, promoting proliferation and mediating nested zones of gene expression (Kaphingst and Kunes, 1994; Song et al., 2000; the upward bending of the anterior CNS in situ makes the definition of anterior-posterior versus dorsal-ventral complex, and Kunes and colleagues refer to this axis as the dorsal/ventral axis. Both descriptions are reasonable--below we use the conventions of Meinertzhagen and Hanson (1993), referring to this as the anterior-posterior axis). Wg promotes the expression of dpp in cells adjacent to those expressing Wg. dpp mutants also disrupt the nested zones of gene expression, decrease proliferation, and reduce the medullar neuropil from its posterior ends. Thus Wg and Dpp help set up fates and regulate proliferation along the A/P axis (Kaphingst and Kunes, 1994).
Drosophila has two APC family members that play largely redundant roles in Wg signaling and also have Wnt-independent roles (Ahmed et al., 1998; Ahmed et al., 2002; Akong et al., 2002a; McCartney et al., 1999; McCartney et al., 2001; McCartney et al., 2006). Both APC1 and APC2 are broadly expressed in the developing larval brain, with APC1 accumulation highest in axons, and APC2 accumulating in axons and neural progenitor cells, and the two proteins have an early, redundant role in regulating re-entry of neuroblasts into the cell cycle at the beginning of larval development (Akong et al., 2002b).
Many progenitor/stem cell populations utilize Wnt signaling. Depending upon intrinsic characteristics of the stem cell population, stem cells interpret Wnt signals in different ways. They can drive proliferation and promote self-renewal, or can promote differentiation along a particular lineage. In the colon, Wnt signaling maintains cells in a stem cell fate (Reya and Clevers, 2005). Embryonic stem cells also rely on Wnt signaling to maintain their pluripotent, self-renewing state in vitro (Sato et al., 2004). During hematopoiesis, Wnt signaling promotes multi-lineage differentiation potential in lymphoid and myeloid progenitors (Baba et al., 2005). In the skin, Wnt signaling’s role is more complex (reviewed in Alonso and Fuchs, 2003). It has been proposed that different levels of Wnt activity direct different outcomes, i.e. maintaining stem cell populations in the hair follicle versus regulating hair follicle differentiation (Blanpain et al., 2004).
Here we explored the role of APC family members and Wnt signaling in the larval brain, addressing APC function in the neural progenitor cells (neuroblasts) within the optic lobe.
MATERIALS AND METHODS
Fly strains/genetics
Alleles and stocks are described at Flybase [www.flybase.org]. All experiments were performed at 25°C. Clones were generated by MARCM (Lee and Luo, 2001), using hsFlp and a 3 hour heat shock at 37°C at ~48 AEL. Briefly, clones double mutant for APC2 and APC were generated by crossing Elav-Gal4 hsFlp mCD8:GFP/Y; ArmGal4/+; FRT 82B Gal80/+ males to FRT82B APC2 APCQ8/TM6 Tb females. Non-Tb, female larvae with Gal80 (assessed by lack of global GFP expression) were dissected. Two possible genotypes were present: they could inherit both Elav-Gal4 and ArmGal-4, or only Elav-Gal4. For MARCM clones over-expressing ArmS10, y w; UAS-ArmS10/+; FRT 82B w+ /+ females were crossed to Elav-Gal4 hsFlp mCD8:GFP/Y; ArmGal4/+; FRT 82B Gal80/+ males, and female larvae with GAL80 were dissected. To generate MARCM clones over-expressing TCF-DN and mutant for APC2g10 APCQ8, Elav-Gal4 hsFlp mCD8:GFP/Y; UAS-TCF-DN/+; FRT 82B Gal80/+ males were crossed to FRT82B APC2g10 APCQ8/TM6 Tb females. Non-Tb, female larvae with Gal80 were dissected. 50% of these females should carry APC2g10 APCQ8 mutant clones expressing UAS-TCF-DN, while the other 50% should have APC2g10 APCQ8 mutant clones that did not have UAS-TCF-DN. To generate MARCM clones with dpp-LacZ that were mutant for APC2g10 APCQ8, Elav-Gal4 hsFlp mCD8:GFP/Y; dpp-LacZ/+; FRT 82B Gal80/+ males were crossed to FRT82B APC2g10 APCQ8/TM6 Tb females. To generate MARCM clones with shg-LacZ that were mutant for APC2g10 APCQ8, Elav-Gal4 hsFlp mCD8:GFP/Y; shg-LacZ/+; FRT 82B Gal80/+ males were crossed to FRT82B APC2g10 APCQ8/ TM6 Tb females. To generate MARCM clones mutant for shgR69, FRT42D shgR69/Cyo females were crossed to Elav-Gal4 hsFlp mCD8:GFP/Y; FRT 42D Gal80/ FRT 42D Gal80 males. To over-express DE-cadherin in MARCM clones UAS-DE-cad/+; FRT82B w+ /+ females were crossed to Elav-Gal4 hsFlp mCD8:GFP/Y; ArmGal4/+; FRT 82B Gal80/+ males.
Immunolocalization and Microscopy
Larval tissues were dissected in Schneider’s Drosophila Medium (GIBCO)+10% fetal bovine serum. Brains were fixed 20 minutes in 3.7% formaldehyde in PBS and blocked 2h in PBS/1% normal goat serum/0.3% TritonX-100. Primary antibodies were: rat polyclonal anti-APC2 (1:1000; McCartney et al., 1999), rat monoclonals anti-DE cadherin DCAD2 (1:200) and anti-N-cadherin (1:500), mouse monoclonals anti-Arm N271A (1:200), anti-myc 9E10 (1:100), BP102 (1:5), anti-fasciclin III (1:500; all from DSHB), anti-Miranda (Matsuzaki, 1:2000), anti-phosphohistone III (Upstate Biotechnology, 1:500), anti-cyclin E (H. Richardson 1:1000), and rabbit anti-ßgalactosidase (Promega, 1:1000). Alexa-phalloidin (Molecular Probes) was used to image F-actin. Secondary antibodies were from Molecular Probes. Following PBS washes, brains were mounted on slides in AquaPolyMount (Polysciences, Inc.), and imaged using a 510 confocal microscope (Carl Zeiss MicroImaging, Inc.), a 40X objective (Plan-NeoFluor; NA 1.3) and LSM 510 AIM software. Adobe Photoshop7.0 was used to adjust input levels so the main range of signals spanned the entire output grayscale, and was used to adjust brightness and contrast.
RESULTS
Wild-type medullar development—epithelial neuroblasts, symmetric and asymmetric divisions and neuronal differentiation
We focused on the OPC, which forms the lamina and medulla. Before analyzing the role of APC proteins in the OPC, we needed to understand the anatomy and development of this structure. In the 3rd instar optic lobe, OPC neuroblasts form an epithelial sheet in the shape of a horseshoe, which wraps around the lateral part of each brain lobe, encircling the entering optic nerve (Fig. 1A; Meinertzhagen and Hanson, 1993; Nassif et al., 2003). This sheet is continuous on the anterior side (Fig. 1A,B,D) but has a cleft on the posterior side (Fig. 1A,E). The epithelial sheet is divided into two regions by the laminar furrow, which runs circumferentially (Fig. 1B,D). The region lateral to the furrow forms the lamina, while the region medial to the furrow forms the medulla (Fig. 1D’). The IPC is also epithelial at this stage, but has a more complex shape. Its posterior horn reaches the brain surface on the posterior side of the brain near the more ventral arm of the OPC (Fig. 1A,E).
Fig. 1.
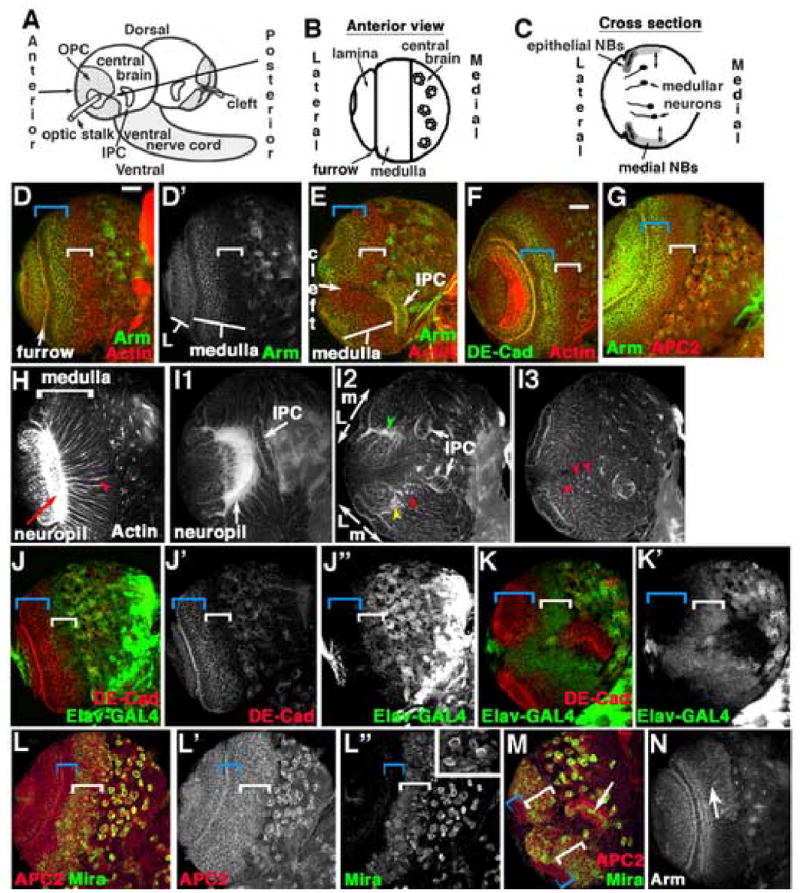
Development of the medulla. A–C. Diagrams , 3rd instar larval brain. A. Entire brain. B. Anterior surface view of single optic lobe (as in D). C. Cross section of optic lobe in B (as in H). D–N, Wild-type late 3rd instar larval brain lobes, dorsal to top, antigens indicated. D–G, J–M. Anterior (D,F,G,J,L) or posterior (E,K,M) surface views. Blue brackets, epithelial neuroblasts; white brackets, medial neuroblasts. H. Cross-section through medulla (as in B). Arrowhead, fasciculated bundles of medullar axons projecting to medullar neuropil (arrow). I1–I3. Section series, from below anterior surface to just below posterior surface. D’,I2, L=lamina, m=Medulla. Green and yellow arrowheads, dorsal and ventral horns of neuropil, respectively. I2,I3. Red arrowheads=fasciculated medullar neurons. M, arrow=Mira-positive cells in IPC. N. Anterior, just below surface. Arm levels are higher in dorsal neuronal cell bodies (arrow). Scale bar=30μm.
Previous work used histological approaches combined with BrdU and 3H-thymidine labeling to establish proliferation patterns (Hofbauer and Campos-Ortega, 1990; Ito and Hotta, 1992; Truman and Bate, 1988; White and Kankel, 1978). We used genetic and cell biological approaches now available to extend this classic work. Together these data reveal that epithelial medullar neuroblasts are divided into two classes with striking differences in both cell biology and developmental potential; lateral neuroblasts are more epithelial in character and divide symmetrically to increase the neuroblast pool, and more medial neuroblasts that primarily divide asymmetrically to generate neurons. All cells accumulate cortical actin (Fig. 1D,F) and APC2 (Fig. 1G). However, lateral cells (adjacent to the laminar furrow) are highly epithelial in architecture, and express high levels of the adherens junction proteins DE-cadherin (DE-cad; Fig. 1F, blue bracket) and Arm (Fig. 1D,G, blue brackets). Previous 3H-thymidine labeling suggested that these lateral neuroblasts near the laminar furrow undergo symmetric divisions in the plane of the epithelium, producing two neuroblast daughters. More medial neuroblasts have substantially reduced DE-cad and Arm levels (Fig. 1D,F,G, white brackets). Instead, they express proteins indicating neuronal character, like Elav-GAL4 driving mCD8-GFP (Fig. 1J.K, white brackets; Elav-GAL4 is expressed by medial neuroblasts while Elav protein itself appears to be restricted to the neuronal daughters (data not shown)). Medial neuroblasts also express proteins indicative of asymmetric divisions, like the asymmetrically localized anchor Miranda (Mira; Fig. 1L,M, white brackets). This is also consistent with earlier 3H-thymidine labeling, which suggested that a band of medial neuroblasts produce ganglion cell daughters by asymmetric division. Mira allows us to visualize these; the division plane is not rigidly perpendicular to the epithelium, as Mira crescents are seen in many orientations (Fig. 1L” inset). This pattern of lateral epithelial character coupled with symmetric divisions, and medial “neuronal” character coupled with asymmetric divisions is seen in both the anterior (Fig. 1D.F.G,J,L) and posterior (Fig. 1E,K,M) medulla.
Deeper in the optic lobe, one finds the cell bodies of medullar neurons, progeny of the asymmetric divisions (Fig. 1I1–I3 are successively deeper sections anterior to posterior). In the anterior medulla, these neurons send out axons in small fasciculated bundles (seen in longitudinal section in Fig. 1H, arrowhead) that project parallel to the overlying epithelium and target the large medullar neuropil (Fig. 1H,arrow) that is just medial to the laminar furrow. Like the overlying OPC, this neuropil is horseshoe-shaped when viewed from the vantage point of the entering optic nerve (Fig. 1I1); the horns of the neuropil lie beneath the horns of the OPC on the posterior side of the brain. Due to this architecture, posterior medullar neurons send axons in fasciculated bundles that are roughly perpendicular to the overlying epithelium (seen in cross-section in Fig. 1I2,I3, red arrowheads), but also converge on the medullar neuropil (Fig. 1I2, green and yellow arrowheads). We also noted that in the anterior medulla, more dorsal neuronal cell bodies accumulated elevated Arm levels (Fig. 1N).
We also examined OPC development during earlier larval instars, using cell biological markers to supplement earlier work (Meinertzhagen and Hanson, 1993; Nassif et al., 2003). 1st instar optic lobe precursors form epithelial spheres within each brain lobe (Fig. 2A), and begin proliferating in the late 1st instar (Hofbauer and Campos-Ortega, 1990). The optic lobe then subdivides in two, forming the IPC and OPC progenitors. These can be distinguished by expression of the adhesion molecule Fasciclin III (FasIII) specifically in the IPC (Fig. 2B1–B3 are sections from posterior to anterior). In 2nd instars, they begin to assume their distinctive morphologies: the OPC is horseshoe-shaped with a posterior cleft (Fig. 2B2), and the IPC has a posterior arm reaching the brain surface (Fig. 2B1). The morphology seen in the late 3rd instar becomes recognizable by the early 3rd instar (Fig. 2C). Two differences from the late 3rd instar are notable. First, the entire epithelial OPC expresses high levels of adherens junction proteins (Fig. 2C’, blue bracket), similar to the most lateral cells of late 3rd instars (Fig. 1F,J’). 3H-thymidine labeling previously revealed that the first asymmetric divisions occur along the medial edge of the OPC at the end of the 2nd instar, and this zone then expands (Hofbauer and Campos-Ortega, 1990), ultimately producing the broad region expressing Mira that we observed in late 3rd instars (Fig. 1L). Second, the laminar furrow only forms during the mid 3rd instar, at which point a second zone of asymmetric divisions appears that will produce the lamina (Hofbauer and Campos-Ortega, 1990).
Fig. 2.
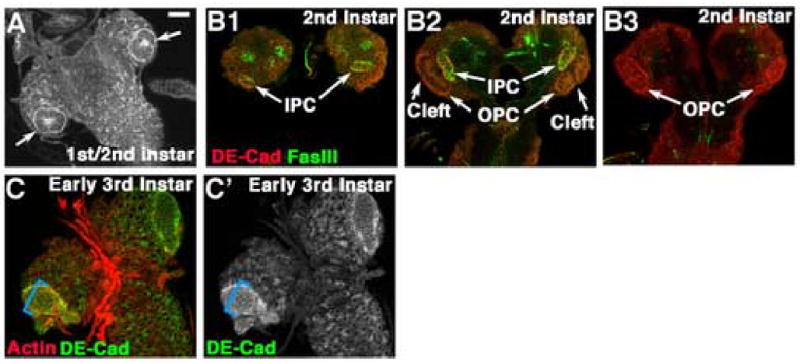
Larval development of the optic lobe. A. Late 1st/early 2nd instar. Arrows=epithelial optic lobe progenitors. B1–B3. 2nd instar. Section series, posterior surface (B1) to anterior surface (B3). One horn of the IPC reaches the posterior surface (B1), while the OPC is prominent on the anterior surface (B3). C. Early 3rd instar. Blue bracket, all neuroblasts are epithelial and express high levels of DE-cad. Scale bar=30μm.
To complement earlier analyses of proliferation patterns in the brain by BrdU and 3H-thymidine labeling (Hofbauer and Campos-Ortega, 1990; Ito and Hotta, 1992; Truman and Bate, 1988; White and Kankel, 1978), and to provide a base-line for our studies of APC mutants, we analyzed proliferation of wild-type medullar neuroblasts using MARCM (Lee and Luo, 2001). This allows us to mark single cells and their descendents with GFP (using the ubiquitously expressed Arm_-_GAL4 driver combined with Elav-GAL4). When clones of marked wild-type cells arose on the anterior side of the medulla, most were roughly wedge-shaped, extending along the lateral to medial axis (Fig. 3A1–A2; numbered panels are successive sections through the same brain lobe, from the anterior surface moving deeper into the brain). We suspect that these arise from a marked neuroblast in the lateral, epithelial region, which divides symmetrically, with daughters displaced medially. Based on the earlier analysis described above, it is likely that some descendents of the initial marked cell initiate asymmetric divisions in the late 2nd instar; their daughters internal to the brain surface differentiate as medullar neurons. These are visualized by focusing deeper into the brain; GFP-marked progeny form a wedge-shaped clone of medullar neurons that send small bundles of fasciculated axons (Fig. 3A3, arrow) into the medullar neuropil (Fig. 3A3, arrowhead). At the brain surface, clones had irregular shapes, suggesting that clonal cells are relatively free to disperse among non-clonal cells. Occasional anterior clones arose in medial medullar neuroblasts (Fig. 3B1, arrow); their GFP-marked progeny also formed wedge-shaped clones of medullar neurons (Fig. 3B2, arrow). Clones at the anterior-posterior boundary (referred to as the intermediate region below) have similar morphologies (data not shown).
Fig. 3.
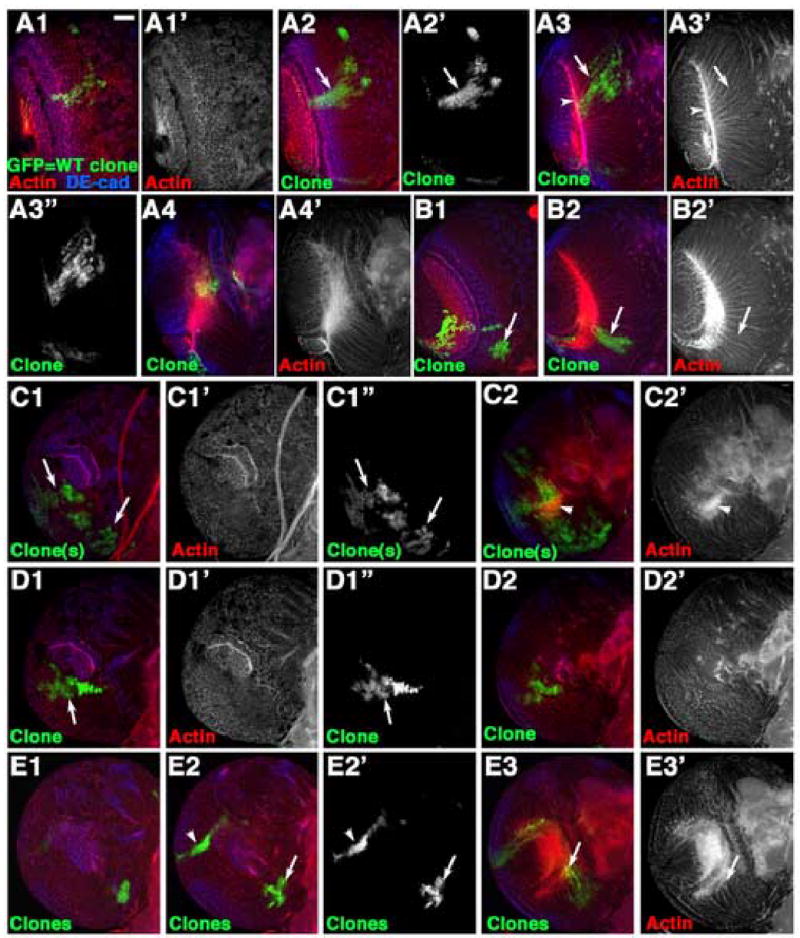
Proliferation pattern and cell sorting of wild-type medullar cells. GFP-marked clones of wild-type cells. 3rd instar brain lobes, dorsal to top. A1–A4. Serial sections, clone on the anterior side of the medulla. A2, arrow=roughly wedge-shaped clone. A3, Fasciculated medullar neurons (arrow) projecting to the medullar neuropil (arrowhead). B1–B2. Clone arising on the medial edge of the medullar neuroblasts (B1, arrow), which forms a wedge-shaped clone of neurons (B2, arrow). C1–C2,D1–D2. Surface and deeper sections of clones on the ventral horn of the posterior medulla. Note complex shapes (arrows) due to free sorting with wild-type cells, and normal neuronal projections. E1–E3. Serial sections, intermediate region clone (bottom right, E2 arrow) and an “edge clone” on the dorsal horn of the posterior medulla (E2,arrowhead). E3,arrow=normal neurons from intermediate region clone. Scale bar=30μm.
In the posterior horns of the horseshoe-shaped medulla, two types of clones with distinct morphologies arose. One resembled clones on the anterior side, and thus likely arose in lateral epithelial neuroblasts. These clones had very complex shapes (Fig. 3C1,D1,arrows), suggesting that marked and unmarked cells mix freely in this region. The other clone type extended in a tight line along the edge of one of the horns of the medulla (Fig. 3E2, arrowhead). Both clone types have medullar neuronal descendents, extending axons to the medullar neuropil (Fig. 3C2,arrowhead,E3,arrow). Taken together, our cell biological and clonal analyses confirm and extends classic observations: lateral medullar neuroblasts in the laminar furrow are epithelial in character, express high levels of adherens junctions proteins, and primarily divide symmetrically, with their neuroblast progeny positioned medially. Neuroblasts in the more medial medulla downregulate epithelial markers, upregulate neuronal markers and divide asymmetrically to give rise to the medullar neurons.
APC proteins play important roles in medullar development
Animals zygotically singly mutant for either APC2 or APC1 are adult viable (Ahmed et al., 1998; McCartney et al., 1999) and have normal brains (Akong et al., 2002b). In contrast, zygotic double mutants die at the beginning of the 2nd instar, with defects in neuroblast proliferation (Akong et al., 2002b), precluding examination of APC roles in later optic lobe development. We thus used MARCM to create GFP-marked clones of cells double mutant for both APC2 and APC1 throughout larvae, including in the larval brain. We induced clones in early 2nd instars, and initially analyzed them in late 3rd instars. We carefully analyzed animals double mutant for null alleles of APC2 and APC1 (APC2g10 and APC1Q8; Suppl. Fig. 1A, Ahmed et al., 1998; McCartney et al., 2006), or double mutant for the APC1Q8 and a second APC2 allele, APC2d40, encoding a truncated protein similar to those in human colon tumors (Suppl. Fig. 1A; McCartney et al., 2001).
Loss of both APC2 and APC1 resulted in several striking defects in medullar development. The phenotypes of different double mutant combinations were similar in nature but differed significantly in their strength. Only certain regions of the medulla along the A/P axis are prone to these phenotypic effects—here we discuss phenotypes in those regions, and we examine the regional differences in sensitivity in more detail below. In regions prone to phenotypic effects, phenotypes are highly penetrant (e.g., 27/27 APC2d40 APC1Q8 double mutant clones in the region most susceptible to effects had phenotypes; Suppl. Table 1).
In APC2d40 APC1Q8 double mutants two predominant phenotypes were seen. When APC2d40 APC1Q8 double mutant clones arose in lateral epithelial neuroblasts, double mutant cells exhibited a striking segregation from wild-type neighbors, consistent with differential adhesion between mutant and wild-type cells. Mutant cells formed epithelial loops emerging from the laminar furrow (Fig. 4A,B,C left,E; contrast with wild-type clone in Fig. 3A) or in some cases epithelial balls entirely separated from the wild-type epithelium (Fig. 4G). We confirmed that clones had lost wild-type APC2 by their reduced staining with APC2 antibodies (Fig. 4B, inset).
Fig. 4.
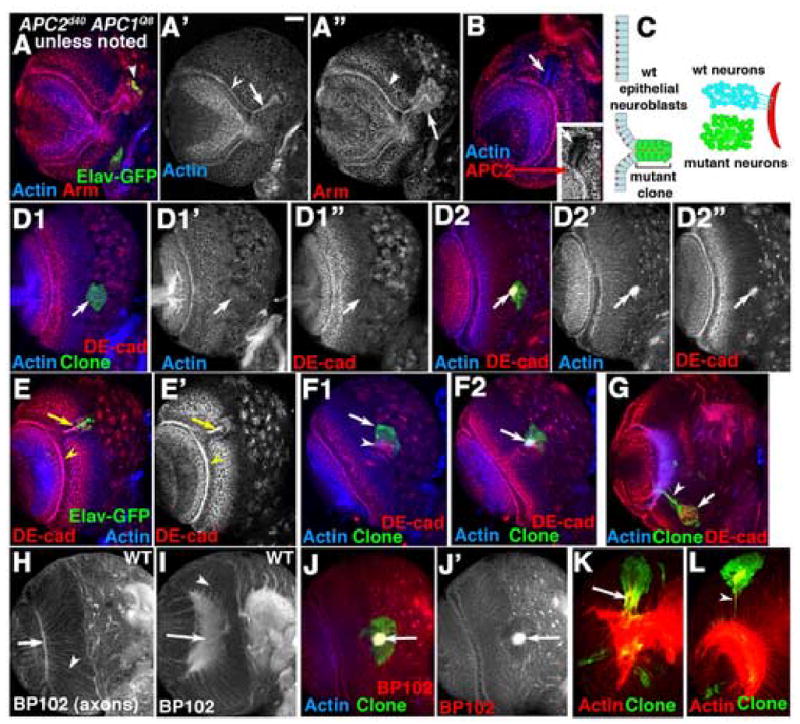
Reduction in APC function leads to epithelial segregation and defects in axon outgrowth. GFP-marked APC2d40 APC1Q8 double mutant clones in 3rd instar brain lobes, dorsal up (H,I=wild-type). Antigens indicated. A,B,D–F. Anterior views of medulla. Numbered panels are confocal sections from anterior surface successively deeper. A,B,E. Epithelial loops. C, left. Diagram of epithelial loops. D2,F2. Axon knots. C, right. Diagram of axon knot. G. Epithelial ball (arrow) beneath surface and escaper axons (arrowhead). H–J. BP102 accumulates in wild-type (H,I) axons (arrowheads) and medullar neuropil (arrows), and in mutant axon knots (J, arrow). K. Hyperfasciculated axons (arrow). L. Escaper axons (arrowhead). Scale bar=30μm.
When APC2d40 APC1Q8 double mutant clones arose in more medial neuroblasts, double mutant cells also behaved in a way consistent with differential adhesion: clones were usually round rather than irregular in shape (Fig. 4D1,F1), consistent with inhibition of mixing of wild-type and mutant cells. These neuroblasts could still give rise to neuronal progeny, producing clones of marked neurons that extended axons. However, rather than sending out axons in small fasciculated bundles to the medullar neuropil, mutant axons associate with one another, forming large axon knots in the clone center or at its periphery (Fig. 4C right, D2,F2; compare to wild-type clone in Fig. 3B2). We confirmed that knots were made up of axons by using the axon marker BP102, which normally accumulates in medullar axons (Fig. 4H,I arrowheads) and the medullar neuropil (Fig. 4H,I arrows). BP102 specifically labels axon knots (Fig. 4J,J’). Like wild-type medullar axons, axon knots also accumulate actin (Fig. 4D2’), DE-cad (Fig. 4D2”), and tubulin (data not shown). Interestingly, double mutant cells may not have totally lost axon guidance information. In some clones, rather than forming axon knots, mutant cells sent hyperfasciculated axons to the medullar neuropil (Fig. 4K, arrow). In addition, occasional axons escaped from knots and targeted the medullar neuropil appropriately (Fig. 4G,L arrowheads). Both knots and loops were highly penetrant, and roughly equal in frequency—occasional clones formed both a large loop and a knot (Suppl. Table 1).
_APC2g10 APC1Q8_double null mutant clones had similar but more severe phenotypes. Many double null mutant clones extended from the laminar furrow across the medulla to the medial border (Fig. 5B1,C1), and produced both large epithelial loops (Fig. 5B1,C1) and axon knots (Fig. 5B2,C2 arrows). Loss of APC function in many tissues triggers the failure to destroy Arm. We observed elevated levels of cytoplasmic Arm in both APC2d40 APC1Q8 (Fig. 4A”, arrow vs. arrowhead), and _APC2g10 APC1Q8_double null mutant clones (Fig. 5C1’, arrow vs. arrowhead) with levels of Arm similar in both genotypes. It is worth noting that Arm levels were only modestly increased over wild-type, unlike the dramatic increase in Arm levels in the epidermis of APC2d40 APC1Q8 double mutant embryos (Ahmed et al., 2002; Akong et al., 2002a).
Fig. 5.
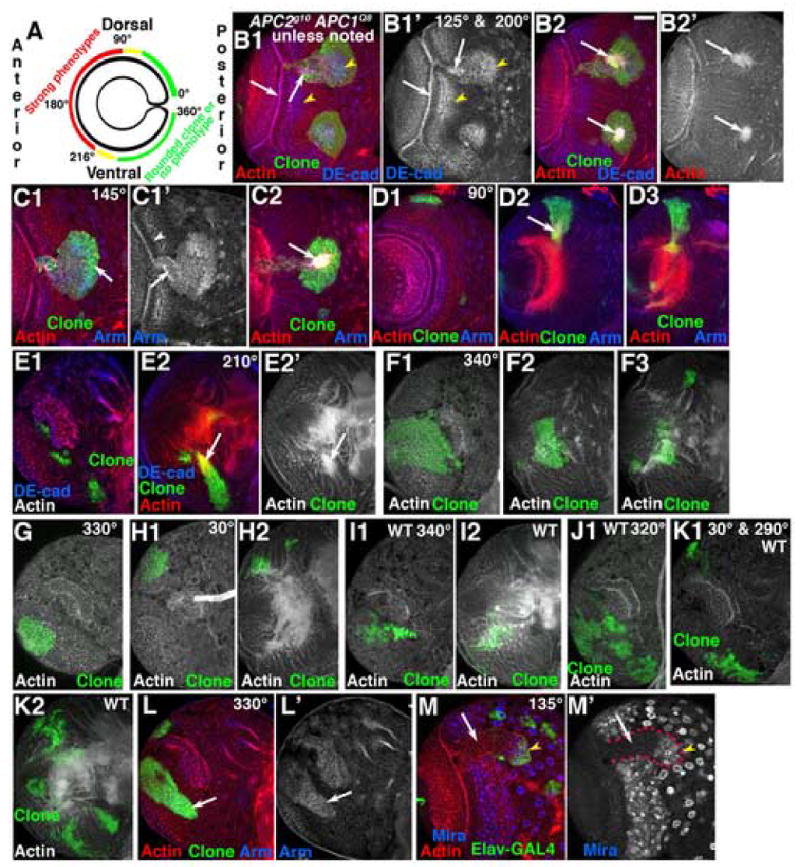
Loss of APC function has differential effects along the anterior-posterior axis. A. Diagram of medulla showing regions with strong phenotypes (red), milder phenotypes (yellow) or only mild effects on cell sorting (green). B–M. GFP-marked APC2g10 APC1Q8 double mutant clones in 3rd instar brain lobes, dorsal up (I–K are wild-type). Antigens and clone position in degrees indicated. Numbered panels are confocal sections from anterior surface successively deeper. B,C. Epithelial loops and knots. D,E. Clones with hyperfasciculated axons (arrows). F–H,L. Posterior clones exhibiting round shape but normal in morphology. Note increased Arm accumulation in L (arrow). I–K. Comparable wild-type clones. M. Epithelial loop. Mira is absent in lateral epithelial region (arrow) and present in medial cells of clone (arrowhead). Scale bar=30μm.
We also analyzed several other APC2 mutants in less detail—these have effects on Wg signaling ranging from strong to weak (McCartney et al, 2006). Their brain phenotypes were qualitatively similar to those of APC2d40 APC1Q8 and APC2g10 APC1Q8, but varied in severity. We examined two additional truncated alleles. Like APC2d40, APC2g41 resembles truncations found in colon tumors, while APC2f90 is a more severe truncation at the end of the Arm repeat domain (Suppl. Fig. 1A). Both APC2g41 APC1Q8 double mutants (Suppl. Fig. 1B–D) and APC2f90 APC1Q8 double mutants (Suppl. Fig. 1E) were roughly similar to APC2d40 APC1Q8, with epithelial loops or axon knots. Both were less severe than the protein null APC2g10. We analyzed two weaker alleles with point mutations in APC2’s Arm repeats (Suppl. Fig. 1A); APC2N175K APC1Q8 and APC2 S APC1Q8 were less severe than APC2d40 APC1Q8 double mutants. In both we occasionally saw clones in the center of the anterior medulla with no phenotype (e.g., Suppl. Fig. 1G)— this was never seen in APC2d40 APC1Q8 double mutants. APC2 S APC1Q8 double mutant clones produced epithelial balls, loops, and axon knots (Suppl. Fig. 1F), while APC2N175K APC1Q8 had only milder phenotypes like hyperfasciculated axons (Suppl. Fig. 1H). The phenotypic severity of these alleles largely parallel the strength of their effect on Wg signaling, as assessed in the embryonic epidermis (McCartney et al., 2006). This is consistent with the idea that the APC brain phenotype is due to effects on Wg signaling. We address this further below.
There is differential sensitivity to APC loss along the anterior-posterior axis
The dramatic phenotypes described above do not occur in all double mutant clones. Instead, the phenotypic consequences of loss of both APC family members exhibited a strikingly graded difference in severity along the A/P axis of the medulla. We mapped clones onto the medulla (Fig. 5A), defining the tip of the dorsal horn of the posterior medulla as 0°, the middle of the anterior side of the medulla as 180°, and the tip of the ventral horn of the medulla as 360°. Double null mutant clones on the anterior side of the medulla exhibited the phenotypes described above (e.g., Fig. 5B,C; 30/30 clones in which at least part of the clone was between 90–216° had loops or knots; compare to wild-type clones in Fig. 3A,B). Within the anterior medulla there was a gradient of phenotypic severity; clones located on the ventral (next to the ventral nerve cord; Fig. 5E) or dorsal sides (Fig. 5D) of the medulla often exhibited less severe phenotypes, including hyperfasciculated axons (Fig. 5D,E arrows) rather than axon knots. In contrast, clones of double mutant cells in the posterior horns of the medulla were much more normal (Fig. 5F–H; 18/18 clones entirely within the region of 0–72° on the dorsal horn of the medulla were normal (compare to top wild-type clone in Fig. 5K), and 61/62 clones entirely within the region of 225–360° were normal (compare to wild-type clones in Fig. 5J,K)). Posterior double mutant cells did not form epithelial loops, and even very large clones sent out normal axons that projected to the medullar neuropil (Fig. 5F) in a fashion indistinguishable from wild type. However, we did note one phenotype consistent with a more modest degree of differential adhesion between wild-type and posterior double mutant cells. Posterior clones of wild-type cells are usually quite irregular in shape (Fig. 5I–K), presumably due to cell mixing. In contrast, posterior double mutant clones were often rounded rather than irregular in shape (Fig. 5F–H,L). Interestingly, posterior double mutant clones did accumulate elevated Arm levels (Fig. 5L, arrow), though the difference may not be as striking as in the anterior medulla. APC2d40 APC1Q8 double mutant clones showed a similar graded severity (Suppl. Table 1); while most posterior APC2d40 APC1Q8 clones were normal in phenotype, occasional clones in this region (<5%) segregated, forming balls. APC2d40 may have “dominant-negative” effects, as previously observed in APC2d40 mutant embryos (McCartney et al., 2006)). Overall, this analysis reveals a strikingly graded response to loss of APC function, with anterior cells much more sensitive.
Wg is normally expressed in the posterior tips of the medulla (Kaphingst and Kunes, 1994), the regions we find least sensitive to APC loss. In contrast, the cells most sensitive to APC loss are in the center of the anterior side of the medulla, farthest from cells that express Wg. Wg helps pattern the A/P axis of the OPC (Kaphingst and Kunes, 1994). The differential sensitivity is consistent with the idea that inappropriate activation of Wg signaling underlies the effects of APC loss-of-function. Double mutant cells should activate Wg signaling regardless of their position. If double mutant cells are adjacent to the cells expressing Wg, they should assume fates roughly in concert with their position and be relatively normal in phenotype. However, double mutant cells on the anterior side of the medulla, far from Wg-expressing cells, may assume fates inconsistent with their position and the fates of the wild-type neighbors, causing defects. We test this further below.
Loss of APC function does not lock cells in a stem cell fate
Wnt signaling and APC play diverse roles in stem/progenitor cells. Loss of APC in the human colon locks cells into a stem cell fate (van de Wetering et al., 2002). To assess whether APCs play similar roles in neural progenitor cells in the medulla, we examined whether loss of APC2 and APC1 affects the ability of progenitor cells to self-renew or produce differentiated daughters. In the wild-type medulla, there is a graded program of cell fates from lateral to medial. Lateral epithelial neuroblasts in the laminar furrow undergo symmetric divisions, increasing the neuroblast pool. In contrast, more medial neuroblasts express proteins like Mira and undergo asymmetric divisions, producing neuronal daughters as well as additional neuroblasts.
APC2 APC1 double mutant neuroblasts appear to undergo an essentially normal program of self-renewal, and produce seemingly normal numbers of differentiated daughters that send out axons. When APC2d40 APC1Q8 double mutant clones arise in the laminar furrow, the cells predominantly divide in the plane of the epithelium, like their wild-type neighbors; these cells form the epithelial loops (e.g., Fig. 4A). They retain epithelial architecture, like wild-type lateral neuroblasts, as indicated by polarized DE-cad (Fig. 4E, arrow vs. arrowhead) and actin (Fig. 4A’, arrow vs. arrowhead) accumulation. They also can undergo asymmetric divisions, yielding neuronal daughters. We observed this in two ways. While most of our MARCM experiments included the ubiquitously-expressed Arm-GAL4 driver, allowing us to visualize all cells in the clone, we also generated clones expressing only Elav-GAL4, which in the medulla is only expressed in cells as they enter the region of asymmetric divisions (Fig. 1J’, white bracket)—thus only cells with neuronal character activate GFP. In clones in which GFP was driven by Elav-GAL4, APC2d40 APC1Q8 double mutant epithelial loops were surrounded by halos of cells adopting the neuronal fate (Fig. 4A, arrowhead). APC2d40 APC1Q8 double mutant clones in more medial positions sometimes had a central epithelial ball (Fig. 4F1, arrowhead; marked by elevated actin and DE-cad) surrounded by a similar halo of Elav-GAL4 expressing cells (Fig. 4F1 arrow). The larger loops in double null clones had a similar gradient of differentiation, with a central epithelial region (e.g., Fig. 5B1, M arrows), a surrounding region expressing moderate levels of DE-cad (thus resembling the region just medial to the laminar furrow; Fig. 5B1, arrowheads), and a surrounding halo of cells adopting neural fates, expressing both Elav-GAL4 and Mira (Fig 5M, arrowhead). Thus APC loss does not disrupt the normal lateral to medial gradient from epithelial to neuronal character, but it now is observed from the center of the loop to its periphery.
Loss of APC function increases clone growth rate
Wnt signaling and APC help regulate proliferation in many tissues of flies and mammals. Wnt signaling often promotes proliferation, but it can also inhibit it. We thus examined whether _APC2g10 APC1Q8_double null mutant clones have differences in growth rate relative to wild-type. We measured clone volume of wild-type and double mutant clones induced in the same experiments, measuring clone area in each confocal section, and taking into account section thickness. We examined clones in the anterior third of the medulla, where phenotypes were always observed, and clones on the posterior side of the medulla, where phenotypes were confined to subtle effects on cell sorting. Anterior _APC2g10 APC1Q8_double mutant clones were significantly larger in volume than controls—mean volume was about twice that of wild-type (Fig. 6A; p<0.002). In contrast, posterior double mutant clones were not statistically different from wild-type (Fig. 6A; p>0.8).
Fig. 6.
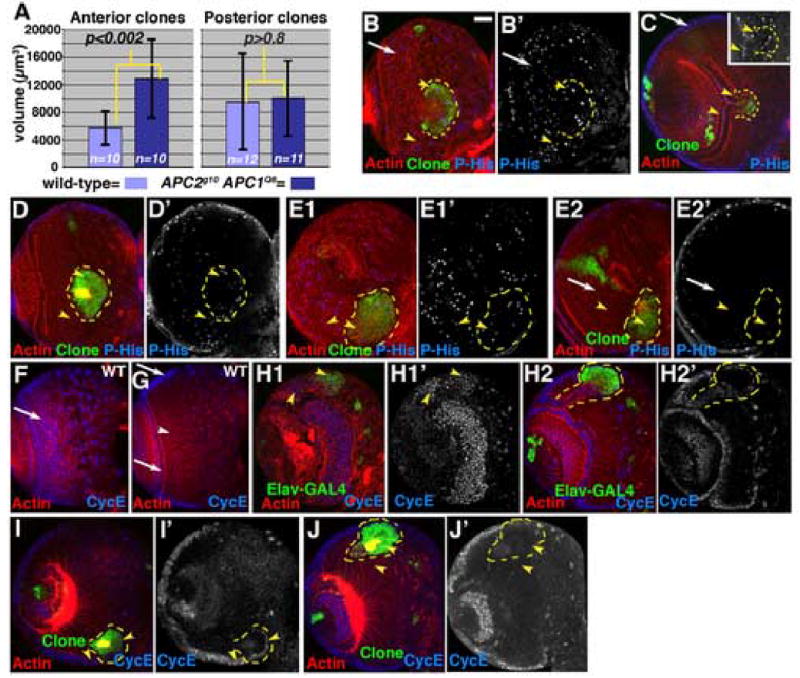
Clones lacking APC function are larger than wild-type clones. A. Volumes of position-matched wild-type and APC2g10 APC1Q8 double mutant clones, with means and SD. B–J. 3rd instar brain lobes, dorsal up. Antigens indicated. B–E,H–J. GFP-marked APC2g10 APC1Q8 double mutant clones, outlined in yellow. F,G are wild-type. B–E. Phospho-histoneH3, showing mitosis. B–D. Anterior clones. E. Posterior clone. In wild-type, at any given time a fraction of the neuroblasts in the superficial layers of the medulla are mitotic, as assessed by P-His (B,C arrows), with slightly lower levels in epithelial neuroblasts adjacent to the laminar furrow. In deeper sections through medullar neurons, few cells are mitotic (E2, arrow), as expected. Since double null mutant cells form loops and knots, cells are often displaced from their normal positions; at times this leads to apparent reductions or increases in P-His, but double mutant cells generally matched comparable wild-type cells (compare arrowheads in B–E). F–J, CycE expression in wild-type brain (F,G) and anterior double mutant clones (H–J). Scale bar=30μm.
Clone volume measures growth rate over most of the 2nd and 3rd instars, in cells with a cell cycle time of ~8–9 hours. Relatively small differences in growth rate might significantly increase clone volume. To look directly at proliferation, we used phospho-histoneH3 (P-His), a mitotic marker. In _APC2g10 APC1Q8_double null mutant clones (Fig. 6B–E2), there were no striking differences in P-His staining relative to wild-type. Cyclin E (CycE) is a key regulator of proliferation, including in the developing brain (Bello et al., 2006; Betschinger et al., 2006). We thus examined CycE expression in wild-type and _APC2g10 APC1Q8_double null mutant clones. In wild-type CycE accumulates at high levels in nuclei of both epithelial and medial medullar neuroblasts (Fig. 6F,G arrows), but is not expressed at high levels in medullar neurons (Fig. 6G, arrowhead). _APC2g10 APC1Q8_double null mutant clones did not have increased CycE relative to wild-type (Fig. 6H–J, compare arrowheads). This is in contrast to what is seen in brat mutant clones, which have increased proliferation and consistent CycE accumulation in all cells of the clone (Bello et al., 2006; Betschinger et al., 2006). The morphological changes caused by loss of APC function displaced CycE-expressing cells to unusual places—for example, in clones making axon knots, peripheral, more epithelial cells expressed CycE even when displaced deeper within the brain (Fig. 6I, right arrowhead), but neuronal cells in the clone center did not (Fig. 6J, right arrowhead). Thus loss of APC function leads to a statistically significant increase in growth rate in anterior clones, without a dramatic increase in mitotic index or CycE expression. However, we cannot rule out small differences. Small changes in growth and proliferation could affect clone volume. For example, a 10% increase in growth rate in mutant clones per cell cycle would roughly double clone volume in this time frame.
Activating Wg signaling is necessary and sufficient for the phenotypes seen
APC family proteins are multifunctional—they negatively regulate Wnt signaling but also have Wnt-independent cytoskeletal effects (Nathke, 2004). Each is a plausible cause of changes in cell adhesion and axon outgrowth. Based on the correlation between sensitivity to loss of APC and endogenous expression of Wg described above, we first tested the hypothesis that the phenotypes we observe result from changes in Wg signaling in double mutant cells. We ectopically activated Wg signaling downstream of APC, using ArmS10, a form of Arm lacking GSK-3 phosphorylation sites, preventing its destruction (Pai et al., 1997). We expressed this in clonal patches using MARCM and examined the resulting clones (ArmS10 is myc-tagged, allowing us to directly examine ArmS10 expression levels). ArmS10 could mimic the effects of loss of APC; clones in anterior or intermediate regions exhibited both epithelial segregation (Fig. 7A1) and axon knots (Fig. 7A2, B2). Further, there was an A/P gradation of phenotypes, with loops and knots seen in anterior and intermediate clones (Fig. 7A,B), and posterior clones having only the “rounded clone” phenotype (Fig. 7D), without defects in axons or more severe cell sorting. Levels of ArmS10 varied from clone to clone (as assessed by levels of myc-staining). Clones with moderate to high-level myc-expression (Fig. 7A,B,D) had phenotypes (including the posterior rounded-clone phenotype), while clones with low-level myc-expression did not (Fig. 7C, E). The frequency and average severity of ArmS10 phenotypes were less than those of APC2 APC1 double null clones, but the phenotypes were qualitatively similar. Thus activation of Wg signaling is sufficient for at least the basic phenotypic response.
Fig. 7.

Activation of Wg signaling is necessary and sufficient for formation of epithelial knots and loops. 3rd instar brain lobes, dorsal up. Antigens indicated. A–E. GFP-marked MARCM clones expressing myc-tagged ArmS10. A. Anterior clone expressing high levels of ArmS10. B. Intermediate-region clone expressing high levels of ArmS10. C. Anterior clone expressing low levels of ArmS10. D. Posterior clone expressing high levels of ArmS10. E. Posterior clone expressing moderate levels of ArmS10. F, G. GFP-marked APC2g10 APC1Q8 double mutant clones—50% should also express TCF-DN. F. Anterior clone with very mild axon knot phenotype. G. Anterior clone with a wild-type morphology. Scale bar=30μm.
To test whether transcriptional output of the canonical Wnt pathway is necessary for the effects of loss of APC function, we generated APC2 APC1 double null mutant clones that simultaneously expressed a dominant-negative form of TCF (TCF-DN=TCF N). This form of TCF cannot bind Arm and thus acts as a constitutive repressor (van de Wetering et al., 1997). In these crosses only half of the larvae express TCF-DN, and thus at best we could expect suppression in half of the clones. We focused on clones in the anterior third of the medulla, as in the absence of TCF-DN, 100% of double mutant clones in this region (21/21 entirely within 108–252°) had a strong phenotype (an epithelial loop or axon knot, and sometimes both), and thus any suppression in this region should be apparent. We analyzed 18 clones in this region of the medulla, in larvae of which half should express TCF-DN. Four clones had essentially normal morphology (Fig. 7G), not forming an epithelial loop or axon knot—this was never observed in double null mutant clones without TCF-DN expression. Three additional clones had weaker phenotypes than the vast majority of the double mutant clones in this region that did not express TCF-DN, forming only a very small knot (Fig. 7F2) or hyperfasciculated axons. Eleven resulted in either a loop or knot. Suppression was not complete (i.e., it did not reach 50%), perhaps because of delay in build-up of the TCF-DN protein after clone induction. However, TCF-DN could block or ameliorate effects of APC loss, consistent with activation of Wg signaling playing an important role in the phenotype.
Loss of APC leads to activation of the Wg target gene dpp
To further test the hypothesis that phenotypes induced by loss of APC function result from activated Wg signaling, we examined whether a known Wg target gene is up-regulated in APC2 APC1 double mutant clones. The best-characterized Wg target in 3rd instar brains is the fly BMP homolog dpp (Kaphingst and Kunes, 1994; Song et al., 2000). We utilized a _dpp_-LacZ reporter to address whether dpp expression is altered in _APC2g10 APC1Q8_double mutant clones. _dpp_-lacZ is normally expressed in the posterior ventral and dorsal horns of the OPC, in cells adjacent to the Wg-expressing cells (Kaphingst and Kunes, 1994; Song et al., 2000; Fig. 8A,B arrows) but is absent from medullar cells on the anterior side of the brain.
Fig. 8.
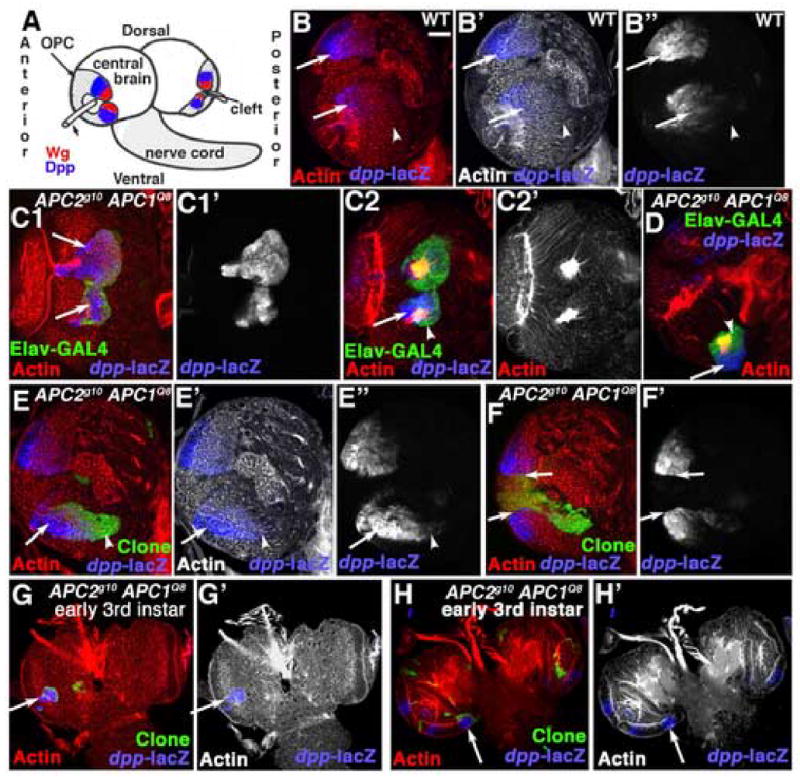
The Wg target gene dpp is activated in clones lacking APC function. Antigens indicated. A. Diagram showing wild-type Wg and Dpp expression domains. B–F. 3rd instar brain lobes, dorsal up. B. Wild-type, _dpp-_lacZ expression pattern. C–H. GFP-marked APC2g10 APC1Q8 double mutant clones. Arrows indicate mutant clones with ectopic _dpp-_lacZ expression. C. Anterior clones. D. Intermediate-region clone. E. Posterior clone (arrows and arrowheads are for comparison with wild-type pattern in B). F. Posterior clone in the tip of the medullar horns (the putative Wg-expression domain). G,H. Early 3rd instars. Scale bar=30μm.
We observed strong activation of _dpp_-LacZ in _APC2g10 APC1Q8_double mutant clones, with an excellent correlation with phenotype. Double mutant cells in the anterior medulla (which have a mutant phenotype) show ectopic expression of _dpp-_LacZ (Fig. 8C1,C2). Levels of _dpp_-LacZ expression in the more epithelial cells (Fig. 8C1) were as high or higher than those in the normal _dpp_-LacZ expression domain (Fig. 8B), but _dpp_-LacZ expression was lower in cells taking on neuronal character (as indicated by expression of Elav-GAL4; Fig. C2,D, arrow vs. arrowhead). Clones in the intermediate region, where morphological phenotypes were observed, also had ectopic _dpp_-LacZ expression (Fig. 8D). Small clones originating deep in the medulla, which did not have morphological phenotypes, often lacked _dpp_-lacZ expression (data not shown). Double mutant clones in the posterior medulla sometimes overlapped the normal _dpp_-LacZ expression domain. In clones with a rounded phenotype, we sometimes saw slightly augmented expression levels in the normal expression domain (Fig. 8B vs. E, arrows), and expression expanded to regions of the clone that might not normally express _dpp_-LacZ (Fig. 8B vs. E, arrowheads). We observed one additional effect. Clones at the very ends of the posterior horns of the medulla (overlapping the region that expresses Wg and does not express _dpp_-LacZ) did not express _dpp_-LacZ, and, more surprising, exhibited a very sharp boundary with wild-type _dpp-_LacZ -expressing cells (Fig. 8F, arrows). _dpp-_LacZ was activated in 2nd and early 3rd instar larvae, as early as we saw morphological phenotypes in anterior (Fig. 8G, arrow) and intermediate (Fig. 8H, arrow) clones. Since _dpp-_LacZ is also expressed in the IPC, we examined expression of the IPC marker fasciclin III in _APC2g10 APC1Q8_double mutant clones. It is not expressed in these clones (data not shown), suggesting that _APC2g10 APC1Q8_double mutant cells are not transformed to IPC identity. These data are consistent with transformation of medullar cells from anterior to posterior fates, and support the idea that loss of APC function activates Wg signaling.
Loss of APC does not dramatically alter levels of classic cadherins
Many phenotypes observed in _APC2g10 APC1Q8_double mutant clones—rounded clone shapes, epithelial loops and axon knots—are consistent with changes in adhesion between mutant cells and wild-type neighbors. One obvious set of candidates that could explain the apparent differential adhesion of mutant and wild-type cells are the classic cadherins, DE-cad and DN-cadherin (DN-cad). In the medulla, DN-cad is normally only expressed by medullar neurons (Suppl. Fig. 2A1,A2), and its expression levels are not consistently altered within _APC2g10 APC1Q8_double mutant clones (Suppl. Fig 2B,C; see Figure legend for details). Thus DN-cad is unlikely it is a major cause of the cell sorting seen.
We next examined DE-cad as a candidate cause of cell segregation. In the wild-type medulla, DE-cad is expressed in high levels in lateral epithelial neuroblasts, at low levels in medial neuroblasts, and also accumulates in medullar axons (Fig. 1). If DE-cad mediated cell sorting during wild-type development, one might expect to see graded expression along the A/P axis, as is seen along the dorsal-ventral axis of wing discs (Jaiswal et al., 2006). We saw no obvious difference in DE-cad expression along the A/P axis of the medulla (Fig. 1F,J,K), but subtle, continuous changes might not be apparent. We thus closely examined DE-cad accumulation in _APC2g10 APC1Q8_double mutant clones from the late 2nd instar (Suppl. Fig. 3A,B), when morphological phenotypes just become apparent, through the early 3rd instar (Suppl. Fig. 3C,D), to the late 3rd instar, where phenotypes are most obvious (Suppl. Fig. 3E–H; see Fig. legend for details). In late 3rd instars, DE-cad levels differ more dramatically across the wild-type medulla. Like wild-type cells, _APC2g10 APC1Q8_double mutant cells downregulate DE-cad accumulation as they differentiate (compare Suppl. Fig. 3E,F, arrowheads to Suppl. Fig. 3G1,G2, arrowheads). When we compared wild-type and mutant cells of similar fate, however, there was no strong increase or decrease in DE-cad levels. Occasionally levels appeared slightly reduced (Suppl. Fig. 3C, arrowheads, F, arrowheads), but it was difficult to rule out that this resulted from altered morphology of double mutant cells. Thus, DE-cad protein levels are either unchanged, or at most slightly reduced. We also examined a transcriptional reporter for DE-cad, cad-lacZ (=shg-lacZ), which can report subtle differences in transcription of the gene encoding DE-cad (e.g., Jaiswal et al., 2006). Double mutant cells had similar levels of cadherin-reporter expression on both the anterior (Suppl. Fig. 3I–L) and posterior (Suppl. Fig. 3M) sides of the medulla, and, like wild-type medullar cells, down-regulated the cadherin-reporter in the transition from epithelial (Suppl. Fig. 3I’–K’, arrows) to neuronal (Suppl. Fig. 3K’, arrowhead, L2; in these experiments, the Arm-GAL4 driver could not be used, so not all double mutant cells express GFP). Thus there are not dramatic changes in DE-cad transcription in response to loss of APC function.
Reduction in DE-cad levels can partially mimic the phenotype
These data rule out large-scale changes in classic cadherin expression, but do not rule out the idea that subtle changes in expression lead to subtle changes in adhesion. We thus tested the hypothesis that changes in adhesion could produce phenotypes like those of APC2 APC1 double mutant clones. We first reduced cadherin-based adhesion by generating MARCM clones of cells mutant for a null allele of the gene encoding DE-cad (shotgun; shgR69; Uemura et al., 1996). We recovered shg null clones in both the medulla and the central brain. However, within the medulla, we did not recover any clones in more epithelial regions near the laminar furrow (0/23 clones were in this region), suggesting that loss of DE-cad in regions of the medulla where it is expressed at high levels may compromise clone viability. In contrast, we did recover clones in more medial regions of the medulla. These clones were small, and were restricted to very medial positions at the brain surface (Fig. 9A–C). Deeper in the brain mutant cells could differentiate into neurons and send axons into the neuropil (Fig. 9B1, arrowhead, C2, arrow). However, shgR69 mutant clones shared some phenotypes with _APC2 APC1_double mutant clones—most striking, these phenotypes also were graded in severity along the A/P axis of the medulla. Clones in anterior and intermediate positions in the medulla sometimes differentiated normally (3/8 clones; data not shown), sometimes produced mildly hyperfasciculated axons (2/8 clones; data not shown), and sometimes gave rise to axon knots (3/8 clones; Fig. 9A2,B2). In contrast, shg mutant clones on the posterior side of the medulla were normal in morphology, but clones were rounded rather than irregular in shape (Fig. 9C1 vs. D), consistent with some degree of differential adhesion. Thus reducing cadherin-based adhesion can partially mimic loss of APC function, suggesting that it may be one contributing cause of the phenotypes observed.
Fig. 9.
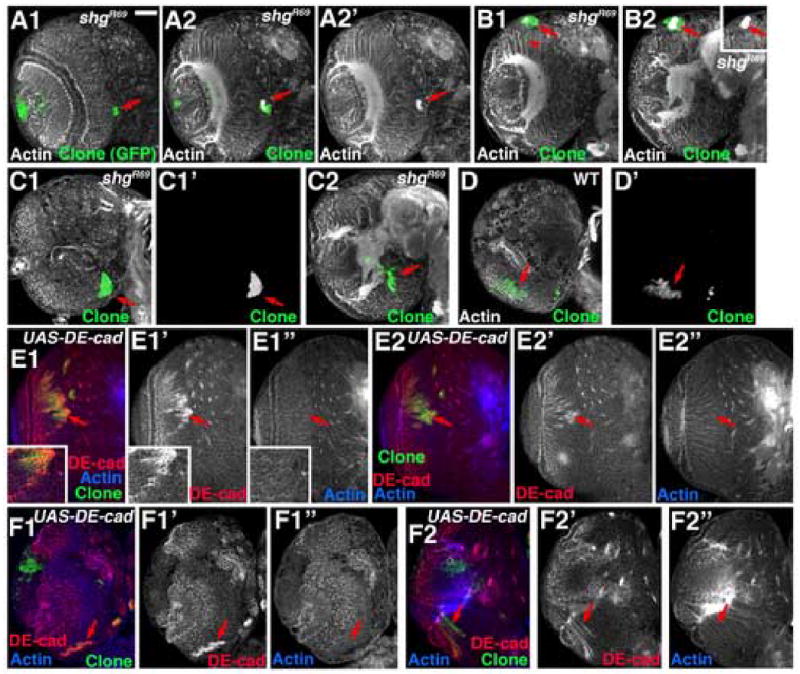
Loss of DE-cad function can cause axon knots, but DE-cad overexpression does not. 3rd instar brain lobes, dorsal up. Antigens indicated. A–C. GFP-marked shgR69 mutant clones (arrows). A. Anterior clone forming axon knot. B. Intermediate region clone forming axon knot (inset, actin alone). C. Posterior clone with rounded margin but no axon defects. D. Wild-type posterior control clone. E–F. GFP-marked MARCM clones overexpressing DE-cad (arrows). In each case several sections from surface inward are shown. E inset=close-up or region marked with arrow). Scale bar=30μm.
In parallel, we explored whether increasing DE-cad expression might mimic loss of APC function. We over-expressed DE-cad in MARCM clones, using UAS-DE-cad (Oda and Tsukita, 2001). Staining with DEcad antibodies confirmed over-expression (Fig. 9E,F arrows). In contrast to loss of DE-cad, increased DE-cad expression had no phenotypic effects. Clones over-expressing DE-cad were seen in anterior, intermediate and posterior positions (Fig. 9E,F, data not shown), and they sent out correctly targeted axons and did not form knots (Fig. 9E2,F2 arrows).
Discussion
The role of Wnt signaling in medullar development
Earlier work by the Kunes lab revealed important roles for Wg signaling in medullar development (Kaphingst and Kunes, 1994; Song et al., 2000). Wg has a restricted expression pattern from the 1st instar onward. Cells expressing Wg reside at the tips of the medullar horseshoe, on the posterior side of the brain. These cells serve as a signaling center, creating nested zones of gene expression that expand anteriorly. By loss-of-function analysis Kunes and colleagues found that the nested zones of gene expression depend on Wg signaling. Wg is important for proliferation of OPC progenitors—when it is disrupted early, the medullar neuropil is much smaller. In many ways this resembles the roles Wg plays in imaginal discs, where it acts early to promote proliferation, and has a later role in setting up nested domains of gene expression. Our data extend this earlier analysis in two ways. First, by eliminating APC function we activated rather than inactivated Wg signaling. Second, by carrying out clonal analysis, we could analyze later roles of Wg signaling in medullar development, and also could analyze the effects of Wg signaling in different regions of the medulla. This revealed that Wg signaling regulates fine scale patterning, perhaps by regulating differential adhesion and axon outgrowth.
Our ability to conduct clonal analysis in different medullar regions revealed striking regional differences in the effects of loss of APC function (Fig. 4; Suppl. Table 1). APC2 APC1 double mutant clones in the anterior medulla have dramatic defects in epithelial segregation and axon outgrowth. Posterior double mutant clones, in contrast, have only subtle differences in cell mixing, while clones in intermediate regions have intermediate phenotypes. These data are consistent with a role for Wg signaling in directing fine scale cell fate choices in a graded fashion all along the A/P axis, reminiscent of the role Wg plays in the developing wing imaginal disc (Cadigan, 2002). Double mutant clones should experience high levels of Wg signaling even when distant from the normal Wg source. If these cells are found in the posterior horns, where cells normally experience high levels of Wg (Kaphingst and Kunes, 1994), their fates match those of their neighbors and thus strong defects in epithelial organization or axon outgrowth are not seen. Double mutant cells further and further from the normal source of Wg will be more and more “out of place” and will differ more in fate from their wild-type neighbors. Apparently, the greater the mismatch in fate, the more association with neighbors is perturbed. The subtle cell segregation of double mutant clones in the vicinity where normal Wg signal is maximal suggests that double mutant cells may have higher levels of Wg activation than are ever experienced by wild-type cells, even those exposed to the highest levels of endogenous Wg. This is consistent with what we and others observed in embryos, where APC2 APC1 double mutants accumulate higher levels of Arm than are accumulated by wild-type cells seeing maximal levels of normal Wg signaling (Ahmed et al., 2002; Akong et al., 2002a).
Our data also suggest that Wg signaling affects not only gene expression patterns and proliferation of OPC progenitors (Kaphingst and Kunes, 1994), but also affects the final differentiated fate of their neuronal progeny, once again acting in a graded fashion along the A/P axis. Double mutant clones (and ArmS10-expressing clones in the same region) exhibit defects in axon outgrowth, forming axon knots. These phenotypes are strongly graded along the A/P axis, with anterior axon knots, hyperfasciculated axons in intermediate regions, and wild-type axon outgrowth in posterior clones. This suggests that neurons may have fairly finely graded fates along the A/P axis, with proper axon outgrowth ensured by these graded fates.
Some aspects of medullar development are reminiscent of roles of Wg and Dpp in imaginal discs, where they act to regulate both pattern and growth/proliferation (Cadigan, 2002). Clones with activated Wg or Dpp signaling can exhibit cell segregation and overgrowth (Haerry et al., 1998; Heslip et al., 1997; Martin-Castellanos and Edgar, 2002; Nellen et al., 1996). Further, cells expressing an activated Dpp receptor proliferate faster than wild-type cells, but levels of P-His and CycE are not dramatically altered in expression (Martin-Castellanos and Edgar, 2002). Thus the roles of Wnt signaling in growth and patterning may be parallel in the medulla and imaginal discs.
Is differential adhesion a cause of the phenotypes seen and a feature of the wild-type brain?
Double mutant epithelial neuroblasts segregate from wild-type neighbors, consistent with differential adhesion between wild-type and mutant cells. These phenotypic effects are graded along the A/P axis, with loops on the anterior side and subtle but distinguishable effects on cell mixing on the posterior. One possible model to explain this is that a gradient of differential cell adhesion along the wild-type A/P axis helps shape proper medullar architecture. This could be particularly important as cells move medially from the laminar furrow. Marked clones of wild-type cells on the anterior side are wedge-shaped, suggesting that progeny of epithelial neuroblasts may move orthogonally to the laminar furrow. This could be facilitated by graded adhesion along the A/P axis, inhibiting cells from moving up or down this axis to positions inappropriate for their fate. Of course this putative differential adhesion could be directly regulated by Wg signaling, or it could be well downstream of this signaling pathway—future research is needed to address this.
The medulla is the target field for a subset of photoreceptor axons, and correct axon targeting is critical for proper visual processing (Mast et al., 2006). The broad zones of gene expression created by local Wg expression (Kaphingst and Kunes, 1994; Song et al., 2000) likely help shape this field. However, it was unclear whether this phenotypic specification is fine-grained. Double mutant neurons send out axons that form axon knots. Once again, this phenotype is graded along the A/P axis, with axon knots on the anterior side, hyperfasciculated axons correctly targeting the medullar neuropil in intermediate positions, and normal axon outgrowth in posterior clones. One speculative possibility is that axons also have graded differences in adhesive properties along the wild-type A/P axis. Wild-type medullar neurons send axons in small fasciculated bundles directly to the medullar neuropil, consistent with graded adhesive behavior helping prevent axons from targeting regions inappropriate for their fates. In this model, the guidance information allowing axons to find the medullar neuropil would be largely unaffected by loss of APC, explaining the occasional “escaper axons” that target the medullar neuropil. An alternate possibility is that Wg hyperactivation interferes with the ability of cells to appropriately respond to existing guidance information.
If such differential adhesion exists, what molecules might mediate it? In the simplest model, a single molecule might do so, with its expression/activity graded along the A/P axis. Classic cadherins were obvious candidates. In the medulla, DN-cad is accumulating only on medullar axons and incoming photoreceptor axons (Lee et al., 2001). This restricted expression pattern, and the lack of consistent changes in DN-cad expression in double mutant clones suggest that it is not likely to be a critical mediator of the effects we observed.
DE-cad is expressed by all cells affected by loss of APC function, and thus it was a more plausible target. However, there are not dramatic differences in DE-cad expression along the A/P axis, though it is difficult to rule out subtle, graded quantitative changes. Changes in cadherin levels are sufficient to mediate cell sorting both in vitro (Steinberg and Takeichi, 1994) and in vivo (Godt and Tepass, 1998; González-Reyes and St Johnston, 1998). Reducing DE-cad levels, by making clones of cells mutant for a null shg allele, was incompatible with cell survival or maintenance in epithelial neuroblasts, and thus we could not test this hypothesis there. However, loss of DE-cad in more medial regions and in neurons partially mimicked loss of APC function, leading to rounded clones and small axon knots. This is consistent with the possibility that differential adhesion underlies both axon knots and loops, but testing this hypothesis will require further experimentation. Loss of APC function did not result in large changes in DE-cad expression or accumulation. Subtle differences are more difficult to rule out, due to the changes in expression of DE-cad across the medulla and the alterations in brain architecture caused by loss of APC function. In fact subtle reduction in DE-cad expression levels sometimes was seen, though not in all clones. This leaves open the possibility that subtle reduction in DE-cad levels is a contributing cause. DE-cad may play similar roles in cell segregation along the dorsal-ventral axis of the developing Drosophila wing (Jaiswal et al., 2006; Wodarz et al., 2006).
APC proteins could also affect cadherin function by two other mechanisms. APC loss elevates Arm levels; if Arm levels are limiting this might increase cadherin-based adhesion. Second, being homozygous for certain APC2 alleles during oogenesis reduces cadherin-based adhesion (Hamada and Bienz, 2002). However, complete loss of APC function does not have detectable effects on cadherin-based adhesion during oogenesis or embryogenesis (McCartney et al., 2006), making it less likely that this mechanism is critical.
Of course changes in DE-cad function are only one possible explanation for the cell segregation and axon abnormalities we observe. Many other cell adhesion molecules exist, and one or more of those may be regulated directly or indirectly by Wg signaling. For example, ephrins/Eph signaling, which is modulated by Wnt signaling in the colon (Batlle et al., 2002), and which can alter axon pathfinding in the larval brain (Dearborn et al., 2002; Boyle et al. 2006), is a possible candidate. It will be important to explore these and other possible players in the future.
APC function, Wnt signaling and stem cell behavior
Wnt signals play key roles in many tissues arising from tissue stem cells, and also can regulate ES cell pluripotency. This led to widespread interest in the possibility that Wnt signals might act as a master regulator of stem cell self renewal. In certain tissues, like the colon and hematopoietic system Wnt signaling plays a key role in stem cell self-renewal in vivo or can do so in vitro (Reya and Clevers, 2005). In other tissues, however, Wnt signaling plays more complex roles. In the skin, Wnt signaling plays several roles at different stages in the process, regulating stem cell maintenance in the hair follicle, but also regulating terminal differentiation of hair and maintaining the balance between hair follicle and sebaceous gland fates (Blanpain and Fuchs, 2006). There are also tissues where Wnt signaling plays no apparent role in stem cell maintenance—e.g., Drosophila female germline stem cells (Song et al., 2002). APC family proteins also play Wnt-independent roles in stem cell maintenance, through effects on spindle orientation in asymmetric cell divisions (Yamashita et al., 2003).
What role does Wnt signaling play in neural stem cells during brain development? In the mammalian cortex, Wnt signaling regulates proliferation, but activated Wnt signaling is not incompatible with neural differentiation and patterning (Chenn and Walsh, 2002). Our data further illuminate the role Wnt signaling and APC’s have in neural stem cells in the Drosophila brain. As in the mammalian brain, Wnt signaling promotes growth and/or proliferation (Kaphingst and Kunes, 1994; our data), but Wnt signaling does not lock cells into a stem cell fate. Our data clearly show that cells with activated Wnt signaling can undergo essentially normal pathways of self-renewing divisions balanced with asymmetric divisions, and can differentiate as neurons and send out axons. Our data suggest that during medullar development, Wnt signaling helps establish finely graded cell fates and translate them into the intricate architecture of the medulla. Interestingly, Wnt regulation of differential cell adhesion and thus fine-scale tissue architecture is seen in the colon, where regulation of ephrin signaling sets up graded cell fates along the crypt-villus axis (Batlle et al., 2002). Further work will allow us to define in molecular terms the mechanisms governing differential fates and differential cell adhesion, providing a molecular map of this aspect of brain architecture.
Supplementary Material
Suppl. Fig. 1.
Different alleles of APC2 have phenotypic consequences consistent with their effects on Wg signaling. 3rd instar brain lobes, dorsal up. Antigens indicated. A. Diagram of APC proteins and alleles used. B–H. GFP-marked clones double mutant for APC1Q8 and the indicated APC2 allele. Scale bars=30μm.
Suppl. Fig. 2.
DN-cad accumulation is not substantially altered by loss of APC function. 3rd instar brain lobes, dorsal up. Antigens indicated. A1,A2. Surface and deeper sections. DN-cad is normally absent from lateral epithelial neuroblasts near the laminar furrow, and is also absent from most medial medullar neuroblasts (A1,A2 white arrows) but accumulates in medullar neurons (A2, arrowhead) and the medullar neuropil (red arrow), as well as in progeny of the large central brain neuroblasts (A1, arrowhead) and in axons entering from the photoreceptors (data not shown), as described by others (Lee et al., 2001). B,C. GFP-marked APC2g10 APC1Q8 double mutant clones. DN-cad does not accumulate in most double mutant epithelial cells (B,C arrows), and thus they resembled wild-type epithelial neuroblasts. Double mutant cells resembling more medial neuroblasts also did not accumulate DN-cad (C, arrow), while double mutant cells adopting neuronal identities expressed DN-cad, and it accumulated in axon knots (C, arrowhead), as it did in the wild-type medullar neuropil. Occasional cells adjacent to epithelial portions of clones near or in the laminar furrow did express DN-cad (B,arrowhead), but similar isolated cells also expressed other neuronal markers (e.g., Elav-GAL4), suggesting these cells were differentiating as medullar neurons. Scale bar=30μm.
Suppl. Fig. 3.
There are not dramatic changes in DE-cad expression in cells lacking APC function. GFP-marked APC2g10 APC1Q8 double mutant clones. Antigens indicated. Arrows and arrowheads discussed in text. A–H. Accumulation of DE-cad protein. A,B. 2nd instars. Insets, DE-cad with clones circled. C,D. Early 3rd instars, clone circled (C) or bracketed (D). At these stages all medullar cells are epithelial. DE-cad levels in _APC2g10 APC1Q8_double mutant clones are similar to wild-type (A,B,D; compare regions indicated by arrowheads). Occasionally levels in clones appeared slightly reduced compared to wild type (C, arrowheads), but it was difficult to rule out that this resulted from altered morphology of double mutant cells. E–H. Late 3rd instar brain lobes, dorsal up. E–G, anterior clones (circled in red). E,G insets, DE-cad. H. Posterior clone, outlined in red. In late 3rd instars, DE-cad levels differ more dramatically across the medulla. Like wild-type cells, _APC2g10 APC1Q8_double mutant cells downregulate DE-cad accumulation as they differentiate—levels were highest in cells equivalent to lateral epithelial neuroblasts (E,F, arrowheads), remained high in cells equivalent to more medial neuroblasts (F’, arrows), and dropped substantially in the most medial neuroblasts (G1, arrowheads) and neurons (G2, arrowheads). DE-cad levels in double mutant cells did not differ dramatically from those in wild-type, either on the anterior (E–G) or posterior (H) sides of the medulla, although in occasional clones levels appeared slightly reduced relative to wild-type (F, arrowheads). I–M. Expression of _cad_-lacZ. Late 3rd instar brain lobes, dorsal up. Clones outlined in red. In these experiments, the Arm-GAL4 driver could not be used, so not all double mutant cells express GFP (we used the Elav-GAL4 driver). I–L. Anterior clones. L1, L2. Surface and deeper sections, insets= _cad_-lacZ. M. Posterior clone. Levels of cad-lacZ were high in epithelial neuroblasts in the laminar furrow (I’, bottom arrow), and dropped in medial neuroblasts (I’, bottom arrowhead) and medullar neurons (K’, bottom arrowhead). Double mutant cells had similar levels of cadherin-reporter expression on both the anterior (I–L) and posterior (M) sides of the medulla, and, like wild-type medullar cells, down-regulated the cadherin-reporter in the transition from epithelial (I’–K’, arrows) to neuronal (K’, arrowhead, L2). Occasionally reporter gene expression seemed slightly diminished in double mutant clones (I’,K’, compare arrows), but we also observed (though less frequently) examples where reporter gene expression appeared higher in double mutant cells (J’, arrows). Scale bar=30μm.
Suppl. Table 1.
Phenotypes of APC2d40 APC1Q8 double mutant clones.
Acknowledgments
We thank F. Matsuzaki and H. Richardson for reagents, I. Salecker for suggesting the use of FasIII, and F. Conlon, D. Fox, B. Duronio, D. Roberts, and the two reviewers for insightful comments. This work was supported by NIH RO1GM67236 to MP. MH was supported by NIH 5T32GM07092.
Footnotes
Publisher's Disclaimer: This is a PDF file of an unedited manuscript that has been accepted for publication. As a service to our customers we are providing this early version of the manuscript. The manuscript will undergo copyediting, typesetting, and review of the resulting proof before it is published in its final citable form. Please note that during the production process errors may be discovered which could affect the content, and all legal disclaimers that apply to the journal pertain.
References
- Ahmed Y, Hayashi S, Levine A, Wieschaus E. Regulation of Armadillo by a Drosophila APC Inhibits Neuronal Apoptosis during Retinal Development. Cell. 1998;93:1171–1182. doi: 10.1016/s0092-8674(00)81461-0. [DOI] [PubMed] [Google Scholar]
- Ahmed Y, Nouri A, Wieschaus E. Drosophila Apc1 and Apc2 regulate Wingless transduction throughout development. Development. 2002;129:1751–62. doi: 10.1242/dev.129.7.1751. [DOI] [PubMed] [Google Scholar]
- Akong K, Grevengoed E, Price M, McCartney B, Hayden M, DeNofrio J, Peifer M. Drosophila APC2 and APC1 Play Overlapping Roles in Wingless Signaling in the Embryo and Imaginal Discs. Dev, Biol. 2002a;250:91–100. doi: 10.1006/dbio.2002.0776. [DOI] [PubMed] [Google Scholar]
- Akong K, McCartney B, Peifer M. Drosophila APC2 and APC1 Have Overlapping Roles in the Larval Brain Despite Their Distinct Intracellular Localizations. Dev Biol. 2002b;250:71–90. doi: 10.1006/dbio.2002.0777. [DOI] [PubMed] [Google Scholar]
- Alonso L, Fuchs E. Stem cells in the skin: waste not, Wnt not. Genes Dev. 2003;17:1189–200. doi: 10.1101/gad.1086903. [DOI] [PubMed] [Google Scholar]
- Baba Y, Garrett KP, Kincade PW. Constitutively active beta-catenin confers multilineage differentiation potential on lymphoid and myeloid progenitors. Immunity. 2005;23:599–609. doi: 10.1016/j.immuni.2005.10.009. [DOI] [PMC free article] [PubMed] [Google Scholar]
- Batlle E, Henderson JT, Beghtel H, van den Born MM, Sancho E, Huls G, Meeldijk J, Robertson J, van de Wetering M, Pawson T, Clevers H. Beta-catenin and TCF mediate cell positioning in the intestinal epithelium by controlling the expression of EphB/ephrinB. Cell. 2002;111:251–63. doi: 10.1016/s0092-8674(02)01015-2. [DOI] [PubMed] [Google Scholar]
- Bello B, Reichert H, Hirth F. The brain tumor gene negatively regulates neural progenitor cell proliferation in the larval central brain of Drosophila. Development. 2006;133:2639–48. doi: 10.1242/dev.02429. [DOI] [PubMed] [Google Scholar]
- Betschinger J, Mechtler K, Knoblich JA. Asymmetric segregation of the tumor suppressor brat regulates self-renewal in Drosophila neural stem cells. Cell. 2006;124:1241–53. doi: 10.1016/j.cell.2006.01.038. [DOI] [PubMed] [Google Scholar]
- Bhat RV, Baraban JM, Johnson RC, Eipper BA, Mains RE. High levels of expression of the tumor suppressor gene APC during development of the rat central nervous system. J Neurosci. 1994;14:3059–71. doi: 10.1523/JNEUROSCI.14-05-03059.1994. [DOI] [PMC free article] [PubMed] [Google Scholar]
- Blanpain C, Fuchs E. Epidermal stem cells of the skin. Annu Rev Cell Dev Biol. 2006;22:339–73. doi: 10.1146/annurev.cellbio.22.010305.104357. [DOI] [PMC free article] [PubMed] [Google Scholar]
- Blanpain C, Lowry WE, Geoghegan A, Polak L, Fuchs E. Self-renewal, multipotency, and the existence of two cell populations within an epithelial stem cell niche. Cell. 2004;118:635–48. doi: 10.1016/j.cell.2004.08.012. [DOI] [PubMed] [Google Scholar]
- Boyle M, Nighorn A, Thomas JB. Drosophila Eph receptor guides specific axon branches of mushroom body neurons. Development. 2006;133:1845–54. doi: 10.1242/dev.02353. [DOI] [PMC free article] [PubMed] [Google Scholar]
- Cadigan KM. Regulating morphogen gradients in the Drosophila wing. Semin Cell Dev Biol. 2002;13:83–90. doi: 10.1016/s1084-9521(02)00014-9. [DOI] [PubMed] [Google Scholar]
- Chazaud C, Rossant J. Disruption of early proximodistal patterning and AVE formation in Apc mutants. Development. 2006;133:3379–87. doi: 10.1242/dev.02523. [DOI] [PubMed] [Google Scholar]
- Chenn A, Walsh CA. Regulation of cerebral cortical size by control of cell cycle exit in neural precursors. Science. 2002;297:365–9. doi: 10.1126/science.1074192. [DOI] [PubMed] [Google Scholar]
- Ciani L, Salinas PC. WNTs in the vertebrate nervous system: from patterning to neuronal connectivity. Nat Rev Neurosci. 2005;6:351–62. doi: 10.1038/nrn1665. [DOI] [PubMed] [Google Scholar]
- Dearborn R, Jr, He Q, Kunes S, Dai Y. Eph receptor tyrosine kinase-mediated formation of a topographic map in the Drosophila visual system. J Neurosci. 2002;22:1338–49. doi: 10.1523/JNEUROSCI.22-04-01338.2002. [DOI] [PMC free article] [PubMed] [Google Scholar]
- Fogarty MP, Kessler JD, Wechsler-Reya RJ. Morphing into cancer: the role of developmental signaling pathways in brain tumor formation. J Neurobiol. 2005;64:458–75. doi: 10.1002/neu.20166. [DOI] [PubMed] [Google Scholar]
- Godt D, Tepass U. Drosophila oocyte localization is mediated by differential cadherin based adhesion. Nature. 1998;395:387–391. doi: 10.1038/26493. [DOI] [PubMed] [Google Scholar]
- González-Reyes A, St Johnston D. The Drosophila AP axis is polarised by the cadherin-mediated positioning of the oocyte. Development. 1998;125:3635–3644. doi: 10.1242/dev.125.18.3635. [DOI] [PubMed] [Google Scholar]
- Green P, Hartenstein AY, Hartenstein V. The embryonic development of the Drosophila visual system. Cell Tissue Res. 1993;273:583–98. doi: 10.1007/BF00333712. [DOI] [PubMed] [Google Scholar]
- Groden J, Thliveris A, Samowitz W, Carlson M, Gelbart L, Albertson H, Josyln G, Stevens J, Spirio L, Robertson M, Sargeant L, Krapcho K, Wolff E, Burt R, Hughes JP, Warrington J, McPherson J, Wasmuth J, Paslier DL, Abderrahim H, Cohen D, Leppert M, White R. Identification and characterization of the familial adenomatous polyposis coli gene. Cell. 1991;66:589–600. doi: 10.1016/0092-8674(81)90021-0. [DOI] [PubMed] [Google Scholar]
- Haerry TE, Khalsa O, O'Connor MB, Wharton KA. Synergistic signaling by two BMP ligands through the SAX and TKV receptors controls wing growth and patterning in Drosophila. Development. 1998;125:3977–87. doi: 10.1242/dev.125.20.3977. [DOI] [PubMed] [Google Scholar]
- Hamada F, Bienz M. A Drosophila APC tumour suppressor homologue functions in cellular adhesion. Nat Cell Biol. 2002;4:208–13. doi: 10.1038/ncb755. [DOI] [PubMed] [Google Scholar]
- Heslip TR, Theisen H, Walker H, Marsh JL. Shaggy and dishevelled exert opposite effects on Wingless and Decapentaplegic expression and on positional identity in imaginal discs. Development. 1997;124:1069–78. doi: 10.1242/dev.124.5.1069. [DOI] [PubMed] [Google Scholar]
- Hofbauer A, Campos-Ortega JA. Proliferation pattern and early differentiation of the optic lobes in Drosophila melanogaster. Roux's Arch Dev Biol. 1990;198:264–274. doi: 10.1007/BF00377393. [DOI] [PubMed] [Google Scholar]
- Huang Z, Kunes S. Signals transmitted along retinal axons in Drosophila: Hedgehog signal reception and the cell circuitry of lamina cartridge assembly. Development. 1998;125:3753–64. doi: 10.1242/dev.125.19.3753. [DOI] [PubMed] [Google Scholar]
- Ito K, Hotta Y. Proliferation pattern of postembryonic neuroblasts in the brain of Drosophila melanogaster. Dev Biol. 1992;149:134–48. doi: 10.1016/0012-1606(92)90270-q. [DOI] [PubMed] [Google Scholar]
- Jaiswal M, Agrawal N, Sinha P. Fat and Wingless signaling oppositely regulate epithelial cell-cell adhesion and distal wing development in Drosophila. Development. 2006;133:925–35. doi: 10.1242/dev.02243. [DOI] [PubMed] [Google Scholar]
- Kaphingst K, Kunes S. Pattern formation in the visual centers of the Drosophila brain: wingless acts via decapentaplegic to specify the dorsoventral axis. Cell. 1994;78:437–448. doi: 10.1016/0092-8674(94)90422-7. [DOI] [PubMed] [Google Scholar]
- Lee CH, Herman T, Clandinin TR, Lee R, Zipursky SL. N-cadherin regulates target specificity in the Drosophila visual system. Neuron. 2001;30:437–50. doi: 10.1016/s0896-6273(01)00291-4. [DOI] [PubMed] [Google Scholar]
- Lee SM, Tole S, Grove E, McMahon AP. A local Wnt-3a signal is required for development of the mammalian hippocampus. Development. 2000;127:457–67. doi: 10.1242/dev.127.3.457. [DOI] [PubMed] [Google Scholar]
- Lee T, Luo L. Mosaic analysis with a repressible cell marker (MARCM) for Drosophila neural development. Trends Neurosci. 2001;24:251–4. doi: 10.1016/s0166-2236(00)01791-4. [DOI] [PubMed] [Google Scholar]
- Logan CY, Nusse R. The wnt signaling pathway in development and disease. Annu Rev Cell Dev Biol. 2004;20:781–810. doi: 10.1146/annurev.cellbio.20.010403.113126. [DOI] [PubMed] [Google Scholar]
- Martin-Castellanos C, Edgar BA. A characterization of the effects of Dpp signaling on cell growth and proliferation in the Drosophila wing. Development. 2002;129:1003–13. doi: 10.1242/dev.129.4.1003. [DOI] [PubMed] [Google Scholar]
- Mast JD, Prakash S, Chen PL, Clandinin TR. The mechanisms and molecules that connect photoreceptor axons to their targets in Drosophila. Semin Cell Dev Biol. 2006;17:42–9. doi: 10.1016/j.semcdb.2005.11.004. [DOI] [PubMed] [Google Scholar]
- McCartney BM, Dierick HA, Kirkpatrick C, Moline MM, Baas A, Peifer M, Bejsovec A. Drosophila APC2 is a cytoskeletally-associated protein that regulates Wingless signaling in the embryonic epidermis. J Cell Biol. 1999;146:1303–1318. doi: 10.1083/jcb.146.6.1303. [DOI] [PMC free article] [PubMed] [Google Scholar]
- McCartney BM, McEwen DG, Grevengoed E, Maddox P, Bejsovec A, Peifer M. Drosophila APC2 and Armadillo participate in tethering mitotic spindles to cortical actin. Nat Cell Biol. 2001;3:933–938. doi: 10.1038/ncb1001-933. [DOI] [PubMed] [Google Scholar]
- McCartney BM, Price MH, Webb RL, Hayden MA, Holot LM, Zhou M, Bejsovec A, Peifer M. Testing hypotheses for the functions of APC family proteins using null and truncation alleles in Drosophila. Development. 2006;133:2407–18. doi: 10.1242/dev.02398. [DOI] [PubMed] [Google Scholar]
- McMahon AP, Bradley A. The Wnt-1 (int-1) proto-oncogene is required for development of a large region of the mouse brain. Cell. 1990;62:1073–1085. doi: 10.1016/0092-8674(90)90385-r. [DOI] [PubMed] [Google Scholar]
- Megason SG, McMahon AP. A mitogen gradient of dorsal midline Wnts organizes growth in the CNS. Development. 2002;129:2087–98. doi: 10.1242/dev.129.9.2087. [DOI] [PubMed] [Google Scholar]
- Meinertzhagen IA, Hanson TE. The Development of the Optic Lobe. In: Bate M, Martinez-Arias A, editors. The development of Drosophila melanogaster. Vol. 2. Cold Spring Harbor Laboratory Press; Cold Spring Harbor: 1993. pp. 1363–1492. [Google Scholar]
- Moser AR, Shoemaker AR, Connelly CS, Clipson L, Gould KA, Luongo C, Dove W, Siggers PH, Gardner RL. Homozygosity for the Min allele of Apc results in disruption of mouse development prior to gastrulation. Dev Dyn. 1995;203:422–433. doi: 10.1002/aja.1002030405. [DOI] [PubMed] [Google Scholar]
- Nassif C, Noveen A, Hartenstein V. Early development of the Drosophila brain: III. The pattern of neuropile founder tracts during the larval period. J Comp Neurol. 2003;455:417–34. doi: 10.1002/cne.10482. [DOI] [PubMed] [Google Scholar]
- Nathke IS. The adenomatous polyposis coli protein: the Achilles heel of the gut epithelium. Annu Rev Cell Dev Biol. 2004;20:337–66. doi: 10.1146/annurev.cellbio.20.012103.094541. [DOI] [PubMed] [Google Scholar]
- Nellen D, Burke R, Struhl G, Basler K. Direct and long-range action of a DPP morphogen gradient. Cell. 1996;85:357–68. doi: 10.1016/s0092-8674(00)81114-9. [DOI] [PubMed] [Google Scholar]
- Nelson WJ, Nusse R. Convergence of Wnt, beta-catenin, and cadherin pathways. Science. 2004;303:1483–7. doi: 10.1126/science.1094291. [DOI] [PMC free article] [PubMed] [Google Scholar]
- Oda H, Tsukita S. Real-time imaging of cell-cell adherens junctions reveals that Drosophila mesoderm invagination begins with two phases of apical constriction of cells. J Cell Sci. 2001;114:493–501. doi: 10.1242/jcs.114.3.493. [DOI] [PubMed] [Google Scholar]
- Pai LM, Orsulic S, Bejsovec A, Peifer M. Negative regulation of Armadillo, a Wingless effector in Drosophila. Development. 1997;124:2255–2266. doi: 10.1242/dev.124.11.2255. [DOI] [PubMed] [Google Scholar]
- Reya T, Clevers H. Wnt signalling in stem cells and cancer. Nature. 2005;434:843–50. doi: 10.1038/nature03319. [DOI] [PubMed] [Google Scholar]
- Sato N, Meijer L, Skaltsounis L, Greengard P, Brivanlou AH. Maintenance of pluripotency in human and mouse embryonic stem cells through activation of Wnt signaling by a pharmacological GSK-3-specific inhibitor. Nat Med. 2004;10:55–63. doi: 10.1038/nm979. [DOI] [PubMed] [Google Scholar]
- Song X, Zhu CH, Doan C, Xie T. Germline stem cells anchored by adherens junctions in the Drosophila ovary niches. Science. 2002;296:1855–7. doi: 10.1126/science.1069871. [DOI] [PubMed] [Google Scholar]
- Song Y, Chung S, Kunes S. Combgap relays wingless signal reception to the determination of cortical cell fate in the Drosophila visual system. Mol Cell. 2000;6:1143–54. doi: 10.1016/s1097-2765(00)00112-x. [DOI] [PubMed] [Google Scholar]
- Steinberg MS, Takeichi M. Experimental specification of cell sorting, tissue spreading, and specific spatial patterning by quantitative differences in cadherin expression. Proc Natl Acad Sci USA. 1994;91:206–9. doi: 10.1073/pnas.91.1.206. [DOI] [PMC free article] [PubMed] [Google Scholar]
- Tissir F, Goffinet AM. Reelin and brain development. Nat Rev Neurosci. 2003;4:496–505. doi: 10.1038/nrn1113. [DOI] [PubMed] [Google Scholar]
- Truman JW, Bate M. Spatial and temporal patterns of neurogenesis in the central nervous system of Drosophila melanogaster. Dev Biol. 1988;125:145–57. doi: 10.1016/0012-1606(88)90067-x. [DOI] [PubMed] [Google Scholar]
- Uemura T, Oda H, Kraut R, Hayashi S, Kotaoka Y, Takeichi M. Zygotic Drosophila E-cadherin expression is required for processes of dynamic epithelial cell rearrangement in the Drosophila embryo. Genes Dev. 1996;10:659–71. doi: 10.1101/gad.10.6.659. [DOI] [PubMed] [Google Scholar]
- van de Wetering M, Cavallo R, Dooijes D, van Beest M, van Es J, Loureiro J, Ypma A, Hursh D, Jones T, Bejsovec A, Peifer M, Mortin M, Clevers H. Armadillo co-activates transcription driven by the product of the Drosophila segment polarity gene dTCF. Cell. 1997;88:789–799. doi: 10.1016/s0092-8674(00)81925-x. [DOI] [PubMed] [Google Scholar]
- van de Wetering M, Sancho E, Verweij C, de Lau W, Oving I, Hurlstone A, van der Horn K, Batlle E, Coudreuse D, Haramis AP, Tjon-Pon-Fong M, Moerer P, van den Born M, Soete G, Pals S, Eilers M, Medema R, Clevers H. The beta-catenin/TCF-4 complex imposes a crypt progenitor phenotype on colorectal cancer cells. Cell. 2002;111:241–50. doi: 10.1016/s0092-8674(02)01014-0. [DOI] [PubMed] [Google Scholar]
- White K, Kankel DR. Patterns of cell division and cell movement in the formation of the imaginal nervous system in Drosophila melanogaster. Dev Biol. 1978;65:296–321. doi: 10.1016/0012-1606(78)90029-5. [DOI] [PubMed] [Google Scholar]
- Wodarz A, Stewart DB, Nelson WJ, Nusse R. Wingless signaling modulates cadherin-mediated cell adhesion in Drosophila imaginal disc cells. J Cell Sci. 2006;119:2425–34. doi: 10.1242/jcs.02973. [DOI] [PMC free article] [PubMed] [Google Scholar]
- Yamanaka H, Hashimoto N, Koyama K, Nakagawa H, Nakamura Y, Noguchi K. Expression of Apc2 during mouse development. Brain Res Gene Expr Patterns. 2002;1:107–14. doi: 10.1016/s1567-133x(01)00021-7. [DOI] [PubMed] [Google Scholar]
- Yamashita YM, Jones DL, Fuller MT. Orientation of Asymmetric Stem Cell Division by the APC Tumor Suppressor and Centrosome. Science. 2003;301:1547–1550. doi: 10.1126/science.1087795. [DOI] [PubMed] [Google Scholar]
Associated Data
This section collects any data citations, data availability statements, or supplementary materials included in this article.
Supplementary Materials
Suppl. Fig. 1.
Different alleles of APC2 have phenotypic consequences consistent with their effects on Wg signaling. 3rd instar brain lobes, dorsal up. Antigens indicated. A. Diagram of APC proteins and alleles used. B–H. GFP-marked clones double mutant for APC1Q8 and the indicated APC2 allele. Scale bars=30μm.
Suppl. Fig. 2.
DN-cad accumulation is not substantially altered by loss of APC function. 3rd instar brain lobes, dorsal up. Antigens indicated. A1,A2. Surface and deeper sections. DN-cad is normally absent from lateral epithelial neuroblasts near the laminar furrow, and is also absent from most medial medullar neuroblasts (A1,A2 white arrows) but accumulates in medullar neurons (A2, arrowhead) and the medullar neuropil (red arrow), as well as in progeny of the large central brain neuroblasts (A1, arrowhead) and in axons entering from the photoreceptors (data not shown), as described by others (Lee et al., 2001). B,C. GFP-marked APC2g10 APC1Q8 double mutant clones. DN-cad does not accumulate in most double mutant epithelial cells (B,C arrows), and thus they resembled wild-type epithelial neuroblasts. Double mutant cells resembling more medial neuroblasts also did not accumulate DN-cad (C, arrow), while double mutant cells adopting neuronal identities expressed DN-cad, and it accumulated in axon knots (C, arrowhead), as it did in the wild-type medullar neuropil. Occasional cells adjacent to epithelial portions of clones near or in the laminar furrow did express DN-cad (B,arrowhead), but similar isolated cells also expressed other neuronal markers (e.g., Elav-GAL4), suggesting these cells were differentiating as medullar neurons. Scale bar=30μm.
Suppl. Fig. 3.
There are not dramatic changes in DE-cad expression in cells lacking APC function. GFP-marked APC2g10 APC1Q8 double mutant clones. Antigens indicated. Arrows and arrowheads discussed in text. A–H. Accumulation of DE-cad protein. A,B. 2nd instars. Insets, DE-cad with clones circled. C,D. Early 3rd instars, clone circled (C) or bracketed (D). At these stages all medullar cells are epithelial. DE-cad levels in _APC2g10 APC1Q8_double mutant clones are similar to wild-type (A,B,D; compare regions indicated by arrowheads). Occasionally levels in clones appeared slightly reduced compared to wild type (C, arrowheads), but it was difficult to rule out that this resulted from altered morphology of double mutant cells. E–H. Late 3rd instar brain lobes, dorsal up. E–G, anterior clones (circled in red). E,G insets, DE-cad. H. Posterior clone, outlined in red. In late 3rd instars, DE-cad levels differ more dramatically across the medulla. Like wild-type cells, _APC2g10 APC1Q8_double mutant cells downregulate DE-cad accumulation as they differentiate—levels were highest in cells equivalent to lateral epithelial neuroblasts (E,F, arrowheads), remained high in cells equivalent to more medial neuroblasts (F’, arrows), and dropped substantially in the most medial neuroblasts (G1, arrowheads) and neurons (G2, arrowheads). DE-cad levels in double mutant cells did not differ dramatically from those in wild-type, either on the anterior (E–G) or posterior (H) sides of the medulla, although in occasional clones levels appeared slightly reduced relative to wild-type (F, arrowheads). I–M. Expression of _cad_-lacZ. Late 3rd instar brain lobes, dorsal up. Clones outlined in red. In these experiments, the Arm-GAL4 driver could not be used, so not all double mutant cells express GFP (we used the Elav-GAL4 driver). I–L. Anterior clones. L1, L2. Surface and deeper sections, insets= _cad_-lacZ. M. Posterior clone. Levels of cad-lacZ were high in epithelial neuroblasts in the laminar furrow (I’, bottom arrow), and dropped in medial neuroblasts (I’, bottom arrowhead) and medullar neurons (K’, bottom arrowhead). Double mutant cells had similar levels of cadherin-reporter expression on both the anterior (I–L) and posterior (M) sides of the medulla, and, like wild-type medullar cells, down-regulated the cadherin-reporter in the transition from epithelial (I’–K’, arrows) to neuronal (K’, arrowhead, L2). Occasionally reporter gene expression seemed slightly diminished in double mutant clones (I’,K’, compare arrows), but we also observed (though less frequently) examples where reporter gene expression appeared higher in double mutant cells (J’, arrows). Scale bar=30μm.
Suppl. Table 1.
Phenotypes of APC2d40 APC1Q8 double mutant clones.