Nuclear translocation of ADAM‐10 contributes to the pathogenesis and progression of human prostate cancer (original) (raw)
Abstract
A disintegrin and metalloproteases (ADAM) are cell membrane‐anchored proteins with potential implications for the metastasis of human cancer cells via cell adhesion and protease activities. In prostate cancer (PC), the ADAM‐10 protein showed a nuclear localization whereas in benign prostate hypertrophy (BPH) it was predominantly bound to the cell membrane. We hypothesized that the pathogenesis and progression of PC are attributable to the nuclear translocation of ADAM‐10. Immunoblotting revealed that after 5α‐dihydrotestosterone treatment, a 60‐kDa active form of ADAM‐10 was increased in the nuclear fraction but decreased in the cell membrane and cytoplasmic fractions of human androgen‐dependent PC cells. Immunocytochemistry revealed that after 5α‐dihydrotestosterone treatment, the ADAM‐10 protein was translocated from the cell membrane to the nucleus. Coimmunoprecipitation of androgen receptor and ADAM‐10 was detected in the nuclear fraction but not in the cell membrane and cytoplasmic fractions. Immunohistochemical study of 64 PC and 20 BPH samples showed that the intensity of ADAM‐10 staining was significantly higher in the nuclei of PC cells than in the nuclei of BPH cells (P < 0.0001). It was also significantly lower in the cell membrane of PC cells than in the cell membrane of BPH cells (P = 0.0017). Nuclear staining intensity was significantly correlated with the clinical T‐factor (P = 0.004), the Gleason score (P < 0.0001) and preoperative prostate‐specific antigen levels (P = 0.0061). ADAM‐10 small interfering RNA transfectants showed a significant decrease in cell growth compared to the controls. Our results suggest that in human PC, the nuclear translocation of ADAM‐10 coupled with the androgen receptor is involved in tumor growth and progression. (Cancer Sci 2007; 98: 1720–1726)
A disintegrin and metalloproteases (ADAM) are members of the metzincin (zinc‐dependent metalloprotease) superfamily. They are cell membrane‐anchored cell surface proteins involved in the proteolytic processing of other transmembrane proteins, in cell adhesion and in cell signaling events.( 1 , 2 , 3 ) Among the more than 30 characterized ADAM proteins, ADAM‐9, ‐10 and ‐17 act as cell surface ‘sheddases’, cleaving the extracellular (ecto) domains of cell membrane‐bound proteins, including amyloid precursor proteins that have been investigated in Alzheimer's disease.( 4 ) These ADAM are highly expressed in human breast, lung, stomach, colon, pancreas, uterine, ovarian and prostate cancer.( 5 , 6 , 7 , 8 , 9 , 10 , 11 ) They activate growth factors such as epidermal growth factor and transforming growth factor‐α, cytokines such as tumor necrosis factor‐α, and degrade cell adhesion molecules such as CD44, L1 and collagens, all of which are synthesized as precursors and are responsible for cancer development.( 12 , 13 )
Prostate cancer (PC) is one of the most common malignancies among men. Global cancer statistics indicated that in 2002, 5.8% of cancer deaths in men and 3.3% of all cancer deaths were attributable to PC.( 14 ) In the development of PC, 5α‐dihydrotestosterone (DHT), a biologically active metabolite of testosterone, plays an important role. The activated receptor complex of DHT and androgen receptor (AR) enters the nucleus where it directly regulates gene transcription or interacts with other proteins such as insulin‐like growth factor I (IGF‐1), resulting in the proliferation of PC cells.( 15 , 16 ) Several ADAM are upregulated in human PC.( 11 , 17 , 18 , 19 , 20 , 21 ) McCulloch et al. demonstrated that although the ADAM‐10 protein was predominantly cell membrane bound in benign prostate hypertrophy (BPH), it showed marked nuclear localization in PC.( 18 ) They also showed that mRNA expression of ADAM‐10 was induced by DHT in the androgen‐dependent PC cell line LNCaP.( 18 , 19 ) Other investigators demonstrated that DHT doesn't affect ADAM expression in androgen‐independent PC cells.( 11 , 17 )
We hypothesized that ADAM‐10 translocates to the nucleus where it behaves like a transcription factor, such as IGF‐1, via an interaction with AR, and that it is responsible for the pathogenesis and progression of androgen‐dependent PC. We subjected 64 PC samples to immunohistochemical staining and analyzed the relationship between clinicopathological parameters and the expression levels of ADAM‐10 in the cell membrane and nucleus. We also evaluated the localization of ADAM‐10 and its interaction with AR in DHT‐treated LNCaP cells.
Materials and Methods
Tissue samples. We used prostate needle biopsy samples from 64 PC and 20 BPH patients who were treated at Kagoshima University Hospital and three affiliated hospitals between 2001 and 2005. The pathological diagnosis of PC, including the clinical T‐factor and Gleason score (GS), was based on published criteria.( 22 ) The median age of the PC and BPH patients was 69 years; they ranged from 52 to 82 and from 48 to 85 years, respectively. The PC samples were from 43 organ‐confined (T1–T2) and 21 locally advanced (T3–T4) cancers; 32 were low‐grade PC (GS < 7) and the other 32 were high‐grade PC (GS > 7). In 26 PC patients the preoperative prostate‐specific antigen (PSA) level was less than 20 ng/mL and in 38 it was 20 ng/mL or higher. Prior written informed consent for use of their samples and clinical and pathological data was obtained from all patients.
Immunohistochemistry. For immunohistochemical staining of ADAM‐10 we used 5 µm‐thick consecutive paraffin‐embedded tissue sections. The slides were microwaved for antigen retrieval in citrate buffer (10 mM, pH 6.0) before incubation with the primary antibody. We used the avidin–biotin–peroxidase method with rabbit polyclonal antibody diluted 1:1000 for ADAM‐10 (AB19026; Chemicon, Temecula, CA, USA). The negative controls were ADAM‐10‐positive slide sections; they were treated with 10% non‐immune rabbit serum instead of the primary antibody. Diaminobenzidine‐hydrogen peroxide (DAB; Sigma‐Aldrich, St Louis, MO, USA) was the chromogen, and counterstaining was with 0.5% hematoxylin. All experiments were carried out in duplicate. To determine the degree of ADAM‐10 localization in the cell membrane, we examined 1000 carcinoma cells in at least three high‐power fields. Staining intensity was scored as negative (0), weak (1), moderate (2) or strong (3).( 23 ) For semiquantitative analysis of nuclear staining for ADAM‐10 we used the H‐score.( 24 ) Briefly, more than 300 tumor cell nuclei were counted in each case. The H‐score was obtained by adding the percentage of strongly, moderately and weakly stained nuclei; the possible score ranged from 0 to 300. Using a dual‐head microscope (field diameter 490 µm), two observers (T. A. and H. E.) evaluated the slides simultaneously, and both were blinded to clinical data. We recorded the mean of the values determined by the two observers. Interobserver differences were less than 5%.
Cell culture. The human PC cell line LNCaP was obtained from the American Type Culture Collection (Manassas, VA, USA) and was usually maintained in RPMI‐1640 supplemented with 10% fetal bovine serum (FBS), 50 µg/mL streptomycin and 50 units/mL penicillin in a humidified atmosphere of 95% air/5% CO2 at 37°C. Routine tests for mycoplasma infection were negative.
ADAM‐10 regulation by DHT treatment. Under the conditions described above, the LNCaP cell line was cultured to 70% confluence in 10‐cm dishes and then exposed for 24 h to various concentrations of DHT (0, 0.1, 1, 10 or 100 nM) in phenol red‐free RPMI‐1640 (Invitrogen Japan, Tokyo, Japan) with 10% charcoal‐stripped FBS (ThermoTrace, Melbourne, Australia), 50 µg/mL streptomycin and 50 units/mL penicillin. The medium was then replaced with fresh medium, and the cells were cultured for an additional 24 h, harvested with ice‐cold phosphate‐buffered saline (PBS), pelleted by centrifugation for 3 min at 175_g_, and stored at –80°C until further manipulation.
Whole‐cell protein extraction. Whole‐cell extracts from LNCaP cell pellets were obtained with triple‐detergent lysis buffer (50 mM Tris [pH 8.0], 150 mM NaCl, 0.02% NaN3, 0.1% sodium dodecyl sulfate [SDS], 1% Nonidet P‐40 and 0.5% sodium deoxycholate) containing 7× protease‐inhibitor cocktail (Roche, Basel, Switzerland) and 1 mM phenylmethylsulfonyl fluoride (PMSF). The protein concentration was determined with a protein assay kit (Bio‐Rad Japan, Tokyo, Japan).
Preparation of nuclear and cytoplasmic protein fractions. Cellular compartmentalization of LNCaP cells was achieved by differential lysis and centrifugation using the NePer nuclear/cytoplasmic fractionation kit (Pierce, Rockford, IL, USA) according to the manufacturer's instructions. Each buffer was adapted to contain a final concentration of 0.1 mM PMSF and 10 mM ethylenediaminetetraacetic acid (EDTA) (pH 8.0). As recommended by the manufacturer, a 1× complete EDTA‐free protease‐inhibitor mixture (Roche) was added to inhibit protease activity.
Immunoprecipitation. Polyclonal ADAM‐10 antibody was bound to protein G dynabeads (Invitrogen) at a ratio of 0.8 µg antibody to 1 µL beads. The antibody was crosslinked to the beads with 20 mM dimethyl pimelimidate containing 0.2 M triethanolamine (30 min, room temperature) and then the beads were washed with 1× PBS containing 0.1% Tween‐20. For immunoprecipitation of ADAM‐10, 50 µL of the ADAM‐10‐linked dynabeads were added to the protein extracts, incubated for 60 min at room temperature, and washed three times with PBS. Bound proteins were eluted in 0.1 M citrate (pH 2–3) for 10 min at room temperature and the eluted proteins were analyzed by SDS–polyacrylamide gel electrophoresis and immunoblotting.
Immunoblotting. Protein extracts (20 µg/lane) were separated on NuPAGE 4–12% Bis‐Tris gels (Invitrogen) and transferred to a polyvinylidene fluoride (PVDF) membrane. Immunoblotting was with 1:1000 diluted polyclonal anti‐ADAM‐10 antibody or monoclonal anti‐AR antibody (sc‐7305; Santa Cruz Biotechnology, Santa Cruz, CA, USA). After washing, the membranes were incubated with goat antirabbit or antimouse IgG‐horseradish peroxidase (HRP) conjugate (Bio‐Rad). The specific complexes were visualized using the ECL detection system (GE Healthcare, Buckinghamshire, UK). Monoclonal antiglyceraldehyde‐3‐phosphate dehydrogenase antibody (MAB374; Chemicon) and anti‐octamer‐binding transcription factor‐1 antibody (sc‐232; Santa Cruz) were used as markers for the cytoplasmic and nuclear fractions, respectively. All immunoblotting was with protein samples collected from three separate, treated‐cell preparations. For densitometric analysis, the expression level of each protein was evaluated using ImageJ software (http://rsb.info.nih.gov/ij). The area under the curve was calculated, used to determine the level of ADAM‐10 normalized to an internal control gene, and expressed as arbitrary units.
Immunocytochemistry. For ADAM‐10 immunostaining we used cell monolayers (grown for 48 h at 37°C, 5% CO2) on poly‐l‐lysine‐coated chamber glass (Asahi Techno Glass, Tokyo, Japan), rinsed them once with PBS, and treated them sequentially for 3 min each with 70, 90 and 100% acetone at –20°C. After a 30‐min immersion in blocking buffer (0.01 M PBS [1.0 L] + goat serum [20 mL] + Triton‐X [2 mL] + bovine serum albumin [1.0 g]) we added polyclonal antibody for ADAM‐10 (1:500 dilution) overnight. Immunostaining was visualized with fluorescein isothiocyanate‐labeled secondary antibody (#111‐096‐003; Jackson Immuno‐Research, West Grove, PA, USA) and we took photographs with an all‐in‐one digital microscope (Keyence Japan, Osaka, Japan). For the control, all experiments were carried out without the primary antibody.
cDNA preparation and reverse transcription–polymerase chain reaction of ADAM‐10 in LNCaP cells. RNA (1 µg) was added to 0.5 µg oligodeoxythymidilic acid primer (Promega, Madison, WI, USA) and a final volume of 25 µL was prepared according to the manufacturer's protocol. Polymerase chain reaction was with forward (5′‐GCCCCGAGAGAGTTATCAAAT‐3′) and reverse (5′‐CAGCAACGAAGAACAGGGAACA‐3′) primers. The conditions were 94°C for 4 min, 32 cycles of 94°C for 30 s, 55°C for 30 s (annealing) and 72°C for 30 s.
Small interfering RNA treatment and MTT assay. LNCaP cells (1 × 10⁴) were plated overnight in 96‐well plates in phenol red‐free RPMI‐1640 with 10% charcoal‐stripped FBS without antibiotics. They were transfected transiently with either small interfering RNA (siRNA)‐ADAM‐10 (si‐ADAM‐10) (M‐004503‐01; Dharmacon, Lafayette, CO, USA) or non‐silencing siRNA (si‐control) (D‐001140‐01; Dharmacon) using DharmaFECT‐2 transfection reagent as described by the manufacturer. Samples subjected to mock transfection (using reagent only) were the controls. The cells were incubated for another 24, 48, 72 or 96 h, and then 50 µL of 1 mg/mL MTT in PBS was added to each well, followed by 4 h incubation. The resulting formazan was dissolved with 100 µL dimethylsulfoxide after aspiration of the culture medium. The plates were then placed on a shaker for 5 min and read immediately at 570 nm using an A4i microplate reader (Tosho, Tokyo, Japan). The expression level of ADAM‐10 was evaluated by immunoblotting as described above.
Statistical analysis. The Kruskal–Wallis test was used to evaluate differences in ADAM‐10 expression by cells exposed to different DHT concentrations. The relationship between the pathological findings and immunohistochemical scores was analyzed using the Mann–Whitney _U_‐test. To evaluate differences in the MTT assay results among the four groups of transfectants we applied the Bonferroni‐adjusted Mann–Whitney _U_‐test. The analysis software was Expert StatView (version 4; SAS Institute, Cary, NC, USA). Differences of P < 0.05 (Mann–Whitney _U_‐test) and P < 0.167 (Bonferroni‐adjusted Mann–Whitney _U_‐test) were considered statistically significant.
Results
Cellular localization of ADAM‐10 protein in DHT‐treated LNCaP cells. Immunoblotting demonstrated that the unprocessed (proform) ADAM‐10 (~100 kDa) and the mature (active) form of ADAM‐10 (~60 kDa) were clearly present in whole‐cell lysates from LNCaP cells. An intermediate band (~80 kDa) representing a partially processed form was also apparent in this study. There was no difference in either the proform or active form of ADAM‐10 expression between lysates from cells treated with the different DHT concentrations and the control (Fig. 1a). As shown in Fig. 1b, the cell membrane and cytoplasmic fractions showed a significant DHT dose‐dependent decrease in active ADAM‐10 expression, whereas the nuclear fractions showed a significant increase. At 100 nM DHT, the active ADAM‐10 expression in the cell membrane and cytoplasmic fractions was one‐fourth of the control. Active ADAM‐10 expression in the nucleus was increased dose dependently in DHT‐treated cells; at 100 nM DHT, the expression of active ADAM‐10 in the nuclear fractions was three times higher than in the control. However, the proform or the intermediate ADAM‐10 expression didn't differ at various DHT concentrations in this fractionation study.
Figure 1.
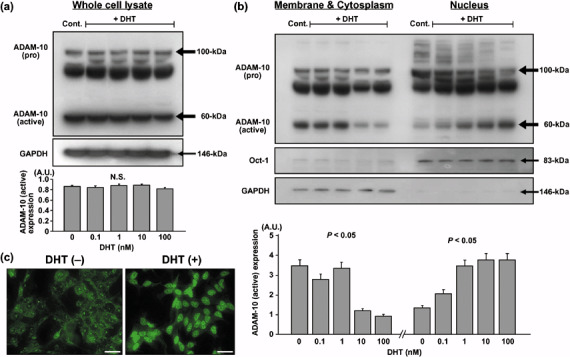
Cellular localization of a disintegrin and metalloprotease (ADAM)‐10 protein in LNCaP cells treated with different concentrations of 5α‐dihydrotestosterone (DHT). (a) ADAM‐10 expression: the pro‐form (~100 kDa), intermediate form (~80 kDa) and active form (~60 kDa), detected by immunoblotting in whole‐cell lysates. Densitometric analysis revealed that there was no difference in the level of active ADAM‐10 expression between whole‐cell lysates from cells exposed to different concentration of DHT. (b) ADAM‐10 expression detected by immunoblotting in the cell membrane and cytoplasm fractions and the nuclear factions. At higher DHT concentrations, the membrane and cytoplasmic fractions manifested a significant decrease, and the nuclear fractions showed a significant increase in active ADAM‐10 expression. Glyceraldehyde‐3‐phosphate dehydrogenase and octamer‐binding transcription factor‐1 were the markers for the cytoplasmic and nuclear fractions, respectively. (c) ADAM‐10 protein expression visualized by immunocytochemistry. In DHT‐treated cells, ADAM‐10 protein translocated from the cell membrane to the nucleus. AU, arbitrary units. Scale bar = 20 µm.
Immunocytochemical study confirmed that DHT‐untreated cells expressed ADAM‐10 protein mostly in the cell membrane and cytoplasm, and that 48 h DHT treatment resulted in the translocation of ADAM‐10 protein to the nucleus (Fig. 1c).
Effect of si‐ADAM‐10 on the growth of DHT‐treated and ‐untreated LNCaP cells. We used reverse transcription–polymerase chain reaction to determine whether si‐ADAM‐10 suppresses the mRNA expression of cultured LNCaP cells. The intensity of the ADAM‐10 band was completely suppressed in cells transfected with si‐ADAM‐10. No change in intensity was observed in si‐ADAM‐10‐untreated (parental) cells exposed to transfection reagent only (mock) or in cells treated with non‐silencing siRNA (si‐control) (Fig. 2a). To examine whether ADAM‐10 affects the growth of cultured LNCaP cells, we subjected DHT‐treated and ‐untreated cells to a cell proliferation assay. As shown in Fig. 2b, a significant decrease in cell growth was observed in si‐ADAM‐10‐transfected cells. In the absence of DHT treatment, on day 4 the proliferation rate of si‐ADAM‐10‐transfected cells was significantly lower than that of mock‐transfected cells, the si‐control and parental cells (P < 0.0001, P = 0.002 and P < 0.0001, respectively). In the presence of DHT treatment, the proliferation rate of si‐ADAM‐10 transfectants was also significantly lower than of mock‐transfected cells, the si‐control and parental cells (day 3: P = 0.0045, P = 0.0008 and P = 0.0015; day 4: P < 0.0001, P < 0.0001 and P < 0.0001, respectively). si‐ADAM‐10‐induced cell growth inhibition was greater in DHT‐treated cells than in DHT‐untreated cells.
Figure 2.
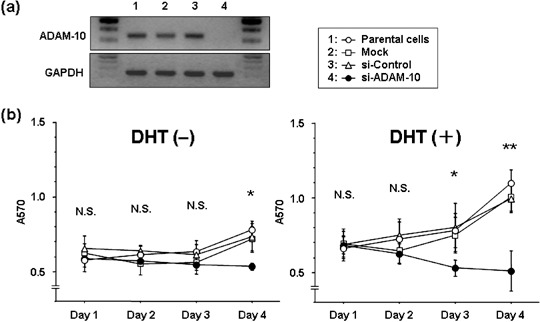
Effect of small interfering RNA (siRNA) a disintegrin and metalloprotease (ADAM)‐10 treatment on the growth of LNCaP cells. (a) ADAM‐10 mRNA expression determined by reverse transcription–polymerase chain reaction assay. Lane 1, untreated (parental) cells; lane 2, cells treated with transfection reagent only (mock); lane 3, cells treated with non‐silencing siRNA (si‐control); lane 4, cells treated with si‐ADAM‐10 (si‐ADAM‐10). (b) Cell growth determined by MTT assay. Compared to the controls, cell growth was significantly reduced by exposure to si‐ADAM‐10. In the absence of 5α‐dihydrotestosterone (DHT) treatment, the difference on day 4 was P < 0.01. In the presence of DHT treatment, it was P < 0.01 (day 3) and P < 0.0001 (day 4).
Coimmunoprecipitation of ADAM‐10 and AR in LNCaP cells. Because AR plays an important role in DHT‐treated PC cells, we used immunoprecipitation and immunoblotting to examine whether ADAM‐10 binds directly to AR in DHT‐treated cells. A rabbit polyclonal antibody was used to immunoprecipitate ADAM‐10 protein in both the cell membrane and cytoplasmic and the nuclear fractions of DHT‐treated and ‐untreated LNCaP cells. The presence of active ADAM‐10 expression in all lanes confirmed that the protein was immunoprecipitated successfully (Fig. 3). Because the amount of immunoprecipitated ADAM‐10 increased up to the maximum binding capacity of protein‐G beads, their expression levels were similar at the various DHT concentrations even though the original fraction contained a different amount of ADAM‐10. Interestingly, coimmunoprecipitated AR protein was expressed in the nuclear but not in the cell membrane and cytoplasmic fractions. In addition, co‐immunoprecipitated AR protein in the nuclear fractions tended to increase with the DHT dose (P = 0.09).
Figure 3.
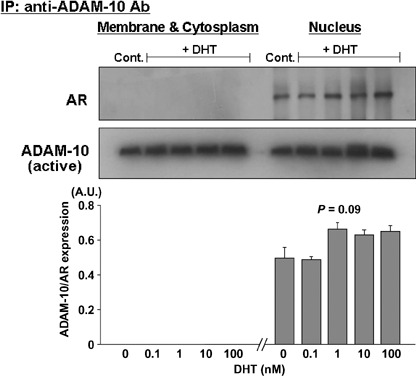
Androgen receptor (AR) interacts with ADAM‐10. Anti‐ADAM‐10 antibody was used to immunoprecipitate ADAM‐10 and associated proteins. Immunoblotting was with anti‐AR‐ and anti‐ADAM‐10 antibody. ADAM‐10 was associated with AR in the nuclear factions but not in the cell membrane and cytoplasmic fractions of LNCaP cells. By densitometric analysis, co‐immunoprecipitated AR protein in the nuclear fractions tended to increase with the dose of 5α‐dihydrotestosterone (P = 0.09). The presence of ADAM‐10 protein expression in all lanes confirmed successful immunoprecipitation. The results are representative of three independent experiments.
Immunohistochemical analysis of ADAM‐10 in clinical BPH and PC samples. We next examined the difference in ADAM‐10 expression in clinical BPH and PC samples to investigate its association with clinicopathological parameters. We found that BPH samples were strongly stained along the cell membrane but nuclear staining was weak. Conversely, PC samples exhibited weak cell membrane staining but strong nuclear staining (Fig. 4a). The cell membrane staining score was significantly higher for BPH than PC (2.85 ± 0.14 vs 1.53 ± 0.12, P = 0.0017). The H‐score for nuclear staining intensity was significantly lower in BPH than PC (56.4 ± 11.9 vs 168.5 ± 4.1, P < 0.0001) (Fig. 4b).
Figure 4.
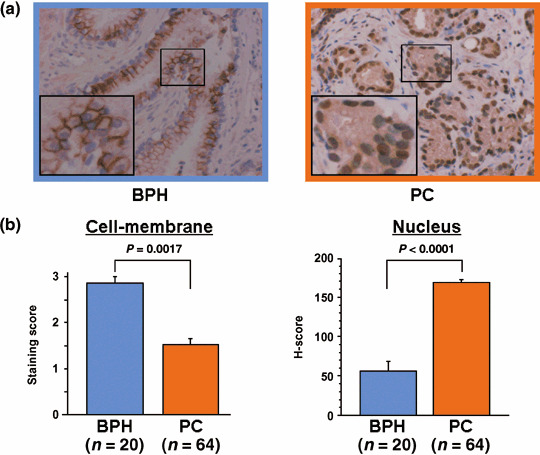
The expression of a disintegrin and metalloprotease (ADAM)‐10 in benign prostate hypertrophy (BPH) and prostate cancer (PC) cells. (a) Representative immunohistochemical staining results for ADAM‐10. The large insert in (a) is a magnification of the small boxed area (magnification ×200 and ×400). (b) ADAM‐10 expression scores in the cell membrane and nuclei of BPH and PC cells. The score for cell membrane staining was significantly higher in BPH than PC (P = 0.0017). Conversely, the H‐score for nuclear staining intensity was significantly lower in BPH than PC (P < 0.0001).
Representative results of ADAM‐10 staining in low‐ and high‐grade PC are shown in Fig. 5. Low‐grade PC samples were stained moderately along the cell membrane but nuclear staining was weak. In contrast, high‐grade PC samples showed weak staining in the cell membrane but nuclear staining was strong. Furthermore, the H‐score was higher in samples from patients with advanced clinicopathological features (GS < 7, 2.16 ± 3.9 vs GS ≥ 7, 191.7 ± 4.3, P < 0.001; preoperative PSA < 20 ng/mL, 128.1 ± 9.9 vs PSA ≥ 20 ng/mL, 176.6 ± 5.0, P = 0.0061; clinical T1–T2, 161.9 ± 4.7 vs clinical T3–T4, 186.5 ± 6.0, P = 0.004). Conversely, the score for cell membrane staining was significantly lower in samples from patients with a high GS (<7, 2.16 ± 0.14 vs 7, 0.91 ± 0.14, P < 0.0001) and high preoperative PSA levels (<20 ng/mL, 2.22 ± 0.19 vs PSA ≥ 20 ng/mL, 1.367 ± 0.15, P = 0.0012). The score for cell membrane staining tended to be lower in samples from patients with clinical T1–T2 (1.65 ± 0.15) than clinical T3–T4 (1.25 ± 0.22) although the difference was not statistically significant (P = 0.1359).
Figure 5.
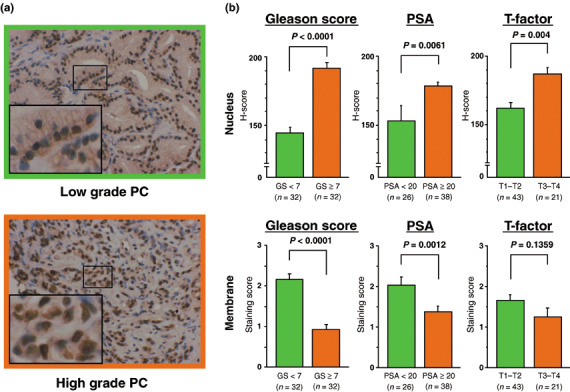
Correlation between a disintegrin and metalloprotease (ADAM)‐10 expression and clinicopathological features in human prostate cancer (PC). (a) Representative results of immunohistochemical staining for ADAM‐10 in low‐ and high‐grade PC. The large inserts in (a) are a magnification of the small boxed area (magnification ×200 and ×400). (b) Correlation between ADAM‐10 expression in the nucleus and cell membrane of PC cells and clinicopathological features. The H‐score for nuclear staining intensity increased with advanced clinicopathological features. In contrast, the cell membrane staining score was higher in the presence of a lower Gleason score and a lower preoperative prostate‐specific antigen level.
Discussion
This is the first report demonstrating that DHT treatment of LNCaP cells induces the translocation of ADAM‐10 from the cell membrane and cytosol to the nucleus. Several ADAM proteins, including ADAM‐9, ‐10 and ‐17, manifest a strong cell membrane association; they act as cell surface ‘sheddases’ to cleave the extracellular domains of cell membrane‐bound proteins from the cell surface.( 1 , 2 , 3 ) This process can lead to the activation of growth factors or the solubilization of extracellular cell adhesion molecules, and may enhance the development of various malignancies.( 12 , 13 )
5α‐Dihydrotestosterone reportedly upregulates the protein expression of ADAM‐9 in whole‐cell lysates of LNCaP cells.( 17 ) However, DHT treatment alone does not alter the protein levels of ADAM‐10 in whole‐cell lysates of LNCaP cells, although it significantly upregulates the mRNA expression levels.( 18 , 19 ) The cellular localization of ADAM remained to be elucidated. We found that although DHT treatment had no effect on the expression of ADAM‐10 in whole‐cell lysates from LNCaP cells, it induced the nuclear translocation of ADAM‐10. Based on this observation we postulate that the nuclear localization of ADAM‐10 may play a role in the pathogenesis of androgen‐dependent PC.
Our study is also the first to report that ADAM‐10 binds directly to AR in nuclear fractions from DHT‐treated LNCaP cells and that the degree of binding is DHT‐dose dependent. This suggests that in PC, ADAM‐10, like IGF‐1 (which interacts with AR),( 16 ) may play a role similar to that of transcription factors by coupling with AR. After AR binding of androgen on the cell membrane and in the cytosol, the activated receptor complex enters the nucleus and binds to DNA. However, a small amount of AR exists in the nucleus without forming complexes with DHT.( 25 , 26 ) Consistent with previous reports, our immunoprecipitation study demonstrated nuclear AR localization without DHT treatment. Because we detected ADAM‐10 on the cell membrane and in the cytosol, where AR is abundant, before the formation of the receptor complex with DHT, we initially thought that the cell membrane and cytosol was the site where ADAM‐10 bound to AR to assist its entry into the nucleus. However, AR was not coimmunoprecipitated with ADAM‐10 in the cell membrane and cytosolic fractions at any of the DHT concentrations used in our study. This suggests that another specific protein located in the nucleus is necessary for the formation of the ADAM‐10–AR complex. Moreover, our immunoblots showed that the size of the active form of ADAM‐10 (approximately 60 kDa) was not different between the cell membrane and cytosol fraction and the nuclear fraction, indicating that ADAM‐10 was not cleaved during the nuclear translocation process. This observation suggests that in DHT‐treated cells, ADAM‐10 might migrate into the nucleus and then combine with AR. Thus, the distribution of ADAM‐10 after transcription is dramatically altered after exposure to DHT. Studies are underway in our laboratory to elucidate this issue.
Immunohistochemical studies on human normal tissue and cancer specimens detected ADAM‐10 in the cell membrane and cytoplasm but not the nucleus of lung, gastric or breast cancer cells.( 27 , 28 , 29 , 30 ) We also detected ADAM‐10 protein in the cell membrane of cells derived from benign prostate glands. However, cells from patients with PC expressed higher levels of ADAM‐10 in the nucleus, a finding that coincides with that of McCulloch et al.( 18 ) We also found a positive correlation between nuclear ADAM‐10 staining intensity and PC progression. Similarly, previous immunohistochemical analysis showed a positive correlation between nuclear AR staining and advancing pathological features of PC.( 31 , 32 ) Our MTT assay showed a significant decrease in the growth of ADAM‐10 knockout LNCaP cells compared with the controls. Moreover, si‐ADAM‐10‐induced cell growth inhibition was greater in DHT‐treated cells than in untreated cells, suggesting that ADAM‐10 is involved in DHT‐mediated PC cell growth.
The findings presented here strongly suggest that the nuclear translocation of ADAM‐10 is necessary for cell proliferation in AR‐dependent PC. Ours is the first demonstration of the increased nuclear expression of ADAM‐10 in PC. Our results indicate that in human PC, the translocation of ADAM‐10 from the cell membrane to the nucleus is involved in tumor progression via an interaction with AR.
Acknowledgment
We thank Ms Mutsumi Miyazaki for excellent laboratory assistance.
References
- 1.Huovila AP, Turner AJ, Pelto‐Huikko M, Kärkkäinen I, Ortiz RM. Shedding light on ADAM metalloproteinases. Trends Biochem Sci 2005; 30: 413–22. [DOI] [PubMed] [Google Scholar]
- 2.Seals DF, Courtneidge SA. The ADAMs family of metalloproteases: multidomain proteins with multiple functions. Genes Dev 2003; 17: 7–30. [DOI] [PubMed] [Google Scholar]
- 3.Arribas J, Borroto A. Protein ectodomain shedding. Chem Rev 2002; 102: 4627–38. [DOI] [PubMed] [Google Scholar]
- 4.Nunan J, Small DH. Regulation of APP cleavage by alpha‐, beta‐ and gamma‐secretases. FEBS Lett 2000; 483: 6–10. [DOI] [PubMed] [Google Scholar]
- 5.McGowan PM, Ryan BM, Hill AD, McDermott E, O’Higgins N, Duffy MJ. ADAM‐17 expression in breast cancer correlates with variables of tumor progression. Clin Cancer Res 2007; 13: 2335–43. [DOI] [PubMed] [Google Scholar]
- 6.Hynes NE, Schlange T. Targeting ADAMs and ERBBs in lung cancer. Cancer Cell 2006; 10: 7–11. [DOI] [PubMed] [Google Scholar]
- 7.Yoshimura T, Tomita T, Dixon MF, Axon AT, Robinson PA, Crabtree JE. ADAMs (a disintegrin and metalloproteinase) messenger RNA expression in _Helicobacter pylori_‐infected, normal, and neoplastic gastric mucosa. J Infect Dis 2002; 185: 332–40. [DOI] [PubMed] [Google Scholar]
- 8.Gavert N, Conacci‐Sorrell M, Gast D_et al_. L1, a novel target of β‐catenin signaling, transforms cells and is expressed at the invasive front of colon cancers. J Cell Biol 2005; 168: 633–42. [DOI] [PMC free article] [PubMed] [Google Scholar]
- 9.Yamada D, Ohuchida K, Mizumoto K_et al_. Increased expression of ADAM 9 and ADAM 15 mRNA in pancreatic cancer. Anticancer Res 2007; 27: 793–9. [PubMed] [Google Scholar]
- 10.Fogel M, Gutwein P, Mechtersheimer S_et al_. L1 expression as a predictor of progression and survival in patients with uterine and ovarian carcinomas. Lancet 2003; 362: 869–75. [DOI] [PubMed] [Google Scholar]
- 11.Karan D, Lin FC, Bryan M_et al_. Expression of ADAMs (a disintegrin and metalloprotease) and TIMP‐3 (tissue inhibitor of metalloproteinase‐3) in human prostatic adenocarcinomas. Int J Oncol 2003; 23: 1365–71. [PubMed] [Google Scholar]
- 12.Mochizuki S, Okada Y. ADAMs in cancer cell proliferation and progression. Cancer Sci 2007; 98: 621–8. [DOI] [PMC free article] [PubMed] [Google Scholar]
- 13.Arribas J, Bech‐Serra JJ, Santiago‐Josefat B. ADAMs, cell migration and cancer. Cancer Metastasis Rev 2006; 25: 57–68. [DOI] [PubMed] [Google Scholar]
- 14.Parkin DM, Bray F, Ferlay J, Pisani P. Global cancer statistics, 2002. CA Cancer J Clin 2005; 55: 74–108. [DOI] [PubMed] [Google Scholar]
- 15.Wu JD, Haugk K, Woodke L, Nelson P, Coleman I, Plymate SR. Interaction of IGF signaling and the androgen receptor in prostate cancer progression. J Cell Biochem 2006; 99: 392–401. [DOI] [PubMed] [Google Scholar]
- 16.Heinlein CA, Chang C. Androgen receptor in prostate cancer. Endocr Rev 2004; 25: 276–308. [DOI] [PubMed] [Google Scholar]
- 17.Shigemura K, Sung SY, Kubo H_et al_. Reactive oxygen species mediate androgen receptor‐ and serum starvation‐elicited downstream signaling of ADAM9 expression in human prostate cancer cells. Prostate 2007; 67: 722–31. [DOI] [PubMed] [Google Scholar]
- 18.McCulloch DR, Akl P, Samaratunga H, Herington AC, Odorico DM. Expression of the disintegrin metalloprotease, ADAM‐10, in prostate cancer and its regulation by dihydrotestosterone, insulin‐like growth factor I, and epidermal growth factor in the prostate cancer cell model LNCaP. Clin Cancer Res 2004; 10: 314–23. [DOI] [PubMed] [Google Scholar]
- 19.McCulloch DR, Harvey M, Herington AC. The expression of the ADAMs proteases in prostate cancer cell lines and their regulation by dihydrotestosterone. Mol Cell Endocrinol 2000; 167: 11–21. [DOI] [PubMed] [Google Scholar]
- 20.Fritzsche FR, Jung M, Xu C_et al_. ADAM8 expression in prostate cancer is associated with parameters of unfavorable prognosis. Virchows Arch 2006; 449: 628–36. [DOI] [PubMed] [Google Scholar]
- 21.Sung SY, Kubo H, Shigemura K_et al_. Oxidative stress induces ADAM9 protein expression in human prostate cancer cells. Cancer Res 2006; 66: 9519–26. [DOI] [PubMed] [Google Scholar]
- 22.The Japanese Urological Association and the Japanese Society of Pathology . General Rules for Clinical and Pathological Studies on Prostate Cancer, 3rd edn. Tokyo, Japan: Kanehara Publishing, 2001. [Google Scholar]
- 23.Ropponen KM, Eskelinen MJ, Lipponen PK, Alhava EM, Kosma VM. Reduced expression of alpha catenin is associated with poor prognosis in colorectal carcinoma. J Clin Pathol 1999; 52: 10–16. [DOI] [PMC free article] [PubMed] [Google Scholar]
- 24.Goulding H, Pinder S, Cannon P_et al_. A new immunohistochemical antibody for the assessment of estrogen receptor status on routine formalin‐fixed tissue samples. Hum Pathol 1995; 26: 291–4. [DOI] [PubMed] [Google Scholar]
- 25.Blanchere M, Berthaut I, Portois MC, Mestayer C, Mowszowicz I. Hormonal regulation of the androgen receptor expression in human prostatic cells in culture. J Steroid Biochem Mol Bio 1998; 66: 319–26. [DOI] [PubMed] [Google Scholar]
- 26.Jenster G, Trapman J, Brinkmann AO. Nuclear import of the human androgen receptor. Biochem J 1993; 293: 761–8. [DOI] [PMC free article] [PubMed] [Google Scholar]
- 27.Rocks N, Paulissen G, Quesada Calvo F_et al_. Expression of a disintegrin and metalloprotease (ADAM and ADAMTS) enzymes in human non‐small‐cell lung carcinomas (NSCLC). Br J Cancer 2006; 94: 724–30. [DOI] [PMC free article] [PubMed] [Google Scholar]
- 28.Carl‐McGrath S, Lendeckel U, Ebert M, Roessner A, Rocken C. The disintegrin‐metalloproteinases ADAM9, ADAM12, and ADAM15 are upregulated in gastric cancer. Int J Oncol 2005; 26: 17–24. [PubMed] [Google Scholar]
- 29.Lendeckel U, Kohl J, Arndt M, Carl‐McGrath S, Donat H, Rocken C. Increased expression of ADAM family members in human breast cancer and breast cancer cell lines. J Cancer Res Clin Oncol 2005; 131: 41–8. [DOI] [PubMed] [Google Scholar]
- 30.Chubinskaya S, Mikhail R, Deutsch A, Tindal MH. ADAM‐10 protein is present in human articular cartilage primarily in the membrane‐bound form and is upregulated in osteoarthritis and in response to IL‐1α in bovine nasal cartilage. J Histochem Cytochem 2001; 49: 1165–76. [DOI] [PubMed] [Google Scholar]
- 31.Takeda H, Akakura K, Masai M, Akimoto S, Yatani R, Shimazaki J. Androgen receptor content of prostate carcinoma cells estimated by immunohistochemistry is related to prognosis of patients with stage D2 prostate carcinoma. Cancer 1996; 77: 934–40. [PubMed] [Google Scholar]
- 32.Li R, Wheeler T, Dai H, Frolov A, Thompson T, Ayala G. High level of androgen receptor is associated with aggressive clinicopathologic features and decreased biochemical recurrence‐free survival in prostate: cancer patients treated with radical prostatectomy. Am J Surg Pathol 2004; 28: 928–34. [DOI] [PubMed] [Google Scholar]