SmedGD: the Schmidtea mediterranea genome database (original) (raw)
Abstract
The planarian Schmidtea mediterranea is rapidly emerging as a model organism for the study of regeneration, tissue homeostasis and stem cell biology. The recent sequencing, assembly and annotation of its genome are expected to further buoy the biomedical importance of this organism. In order to make the extensive data associated with the genome sequence accessible to the biomedical and planarian communities, we have created the Schmidtea mediterranea Genome Database (SmedGD). SmedGD integrates in a single web-accessible portal all available data associated with the planarian genome, including predicted and annotated genes, ESTs, protein homologies, gene expression patterns and RNAi phenotypes. Moreover, SmedGD was designed using tools provided by the Generic Model Organism Database (GMOD) project, thus making its data structure compatible with other model organism databases. Because of the unique phylogenetic position of planarians, SmedGD (http://smedgd.neuro.utah.edu) will prove useful not only to the planarian research community, but also to those engaged in developmental and evolutionary biology, comparative genomics, stem cell research and regeneration.
INTRODUCTION
Schmidtea mediterranea is a freshwater planarian of the phylum Platyhelminthes that is rapidly becoming a model system for the investigation of regeneration, tissue homeostasis and stem cell biology (1). Interest is being spurred on by the remarkable biology of these animals and the expanding repertoire of tools available to interrogate their biology (2). Like other non-parasitic flatworms, S. mediterranea has the ability to regenerate complete animals from small, excised body fragments. If a planarian is decapitated, both head and trunk fragments regenerate the missing body parts, i.e. the body and the head, respectively. The process takes seven days and results in the full, functional integration of the newly regenerated tissues and organs to the pre-existing structures. This remarkable developmental plasticity is made possible by a population of somatic stem cells known as neoblasts found throughout the body of planarians. Because of their abundance and characteristic undifferentiated state, neoblasts are both easy to identify and amenable to experimental manipulation. In addition, planarians belong to the Lophotrochozoa, a large group of understudied animals that is sister to the Ecdysozoa (e.g. Drosophila and Caenorhabditis elegans) and the Deuterostomes (e.g. non-mammalian and mammalian vertebrates). Presently, the Lophotrochozoa are poorly represented among currently sequenced genomes, and much of their molecular and developmental biology remain unexplored. Hence, the study of S. mediterranea is likely to both complement ongoing studies in available model systems and to expand our knowledge in a large number of long-standing and fundamental problems relevant to human health and biology (e.g. tissue homeostasis and regeneration) not readily studied in well-established model systems such as Drosophila and C. elegans.
Recently, many methodologies have been introduced to analyze planarian biology in depth. Prominent among these are the availability of ∼78 000 ESTs, the study of gene function via robust and reproducible RNAi methodologies (3,4) and a sequenced, assembled and annotated genome. Because these growing resources were devoid of an integrative tool capable of coordinating the inflow of genomic and functional genomic data, we set out to create an easy to use, yet comprehensive database to house and mine this information. The result of this effort is the Schmidtea mediterranea Genome Database (SmedGD), which was constructed using tools from the Generic Model Organism Database (GMOD; http://www.gmod.org) project, and populated with GMOD-compliant annotation data from MAKER (5), as well as information collected from a wide variety of sources such as Gene Ontology (GO), PFAM, SwissProt, SMART and others. Deploying GMOD tools to construct SmedGD facilitates and ensures: (1) interoperability of SmedGD with other genome databases (e.g. WormBase and FlyBase) to allow comparative genomic studies; (2) short- and long-term curation of gene models using Apollo (6); and (3) future expansions to include microarray gene expression data, in situ expression patterns, and PubMed references, for example. In its present form, members of the biomedical and planarian research communities can use SmedGD to find genes of interest and their homologs in other species, download sequences, link to other databases, and find RNAi phenotypes. SmedGD should prove a key resource in furthering the development and integration of S. mediterranea as an important model system for current studies of metazoan biology and human disease.
SmedGD architecture
In order to achieve interoperability between SmedGD and other organism databases such as FlyBase and WormBase, we constructed SmedGD using tools and components from GMOD, a NIH-funded effort aimed at providing generic software to build new genome/organism databases. SmedGD consists of two major components: a GFF database and a GBrowse generic framework (7) capable of autogenerating a generic genome browser from the database.
Data in GFF3 format and compliant with Sequence Ontology (8), is uploaded to a database using a perl script distributed with Bioperl (bp_seqfeature_load.pl) (9). The script converts GFF3 formatted annotations to Bio::SeqFeatureI objects, and generates a database schema that is GMOD-compliant. We used this mySQL-based schema instead of the Chado schema provided by GMOD because of the length of time it took to both load the S. mediterranea data into Chado (days instead of hours) and to query the resulting PostgresSQL database (minutes instead of seconds). Attempts were made to increase the efficiency of loading and querying, but not enough improvement was noted. Although Chado is a very robust relational database that has been successfully implemented in the development of BeetleBase (10) and ParameciumDB (11), we ascribe the underperformance of this schema in our hands to the sheer size of the S. mediterranea data (∼900 Mb), i.e. 12.5× the size of ParameciumDB and 4.5× the size of BeetleBase.
We made sure that the mySQL database generated from the GFF3 files conformed to GMOD standards. Therefore, we parsed the database using GBrowse, which implemented a Bio::DB::SeqFeature::Store database adaptor to access and display rows of data or tracks that are mapped to specific locations in the genome (Figure 1). Customizations to the standard GMOD distribution were also made to accommodate additional database searching and sequence retrieval. CGI scripts that interface with SmedGD's mySQL database using DBI, a perl module, enable specialized queries of GO terms and RNAi phenotypes, and uniquely formatted protein homology search results. Changes made to the GBrowse configuration file allow for the linking to a CGI script that uses ‘fastacmd’, free software distributed by the NCBI (http://www.ncbi.nlm.nih.gov), to retrieve sequences from specially formatted fasta files and displays them when the ‘Name’ of an mRNA is selected in the mRNA ‘Details Page’ (see below). The web page displaying the retrieved sequence includes a link to the NCBI BLAST web server, which when selected will auto fill the NCBI BLAST forms with the retrieved planarian sequence.
Figure 1.

Screen capture of SmedGD displaying genomic contig v31.019651. This contig has only one predicted gene, which has 5 exons and a 3′UTR. The tracks displayed include the gene model, its corresponding predicted transcript, and the relevant biological evidence associated with this model (see text for detailed explanations of each track). From this data, users can see the details of the gene model and its evidence (all of the predicted exons are supported by EST and protein evidence), and that the gene is likely coding for a histone deacetylase. Double-stranded RNA has been used to silence this gene and the resulting phenotypes are listed. cDNA Microarray data is not yet available, but a sample of how this information will be viewed is presented. An arrow pointing down indicates down-regulation of the gene in the experimental group.
Physically, SmedGD is housed on an Apple Xserve G5 computer with 3 GB of RAM. The operating system used is the Mac OS X Server operating system—version 10.4 and the web server software used is Apache—version 1.3.
SmedGD contents
SmedGD is a storehouse of valuable data that is easily accessible and conveniently mapped to the planarian genome sequence. The layers of data mapped to the genome sequence are MAKER annotations, ESTs, 454 cDNA sequences, protein homology, protein domains, Gene Ontology terms, RNAi phenotypes, mRNA expression patterns, human curated genes and microRNAs (Table 1).
Table 1.
Types and number of entries that comprise SmedGD
| Data type | Count |
|---|---|
| Sequence type | |
| Genomic contigs | 43 294 |
| Predicted genes: | 31 955 |
| MAKER | 30 437 |
| SNAP | 1518 |
| Predicted mRNAs | 32 448 |
| Human curated genes | 1000 |
| ESTs | 78 101 |
| EST contigs | 15 043 |
| 454 contigs | 9071 |
| MicroRNAs | 71 |
| Protein homology | |
| Swissprot | 25 733 |
| C. elegans Proteome | 5319 |
| H. Sapiens Proteome | 10 746 |
| M. musculus Proteome | 14 713 |
| D. melanogaster | 4301 |
| BLASTX with reference proteomes | 88 293 |
| Protein Domains | |
| PFAM | 14 442 |
| SMART | 5711 |
| GO terms | |
| Molecular Function | 25 075 |
| Cellular Location | 12 294 |
| Biological Process | 23 842 |
| Experimental data | |
| RNAi phenotypes | 303 |
| mRNA expression patterns | 123 |
Assembly and annotation data
Sequencing and assembly data was provided by the Washington University Genome Sequencing Center in St. Louis, MO. The current assembly version 3.1 (v31), consists of ∼900 Mb of sequence distributed over 43 294 supercontigs. SmedGD also houses the annotation of v31, which was performed using a recently developed automated annotation pipeline named MAKER (5). MAKER implements an algorithm that uses protein homology and collectively assembled ESTs from various S. mediterranea EST projects (12,13) using CAP3 (14) to predict genes, many with 5′ and 3′ UTRs. The predicted genes (31 955) and the accompanying transcripts and splice variants are mapped to the genome sequence. The protein homology and the EST alignments that were used for gene prediction are also mapped to the genome to give the investigator the ability to judge the accuracy of the gene prediction.
cDNA data
Additional evidence is provided to encourage critical analysis of the predictions. The ∼78 000 ESTs that were assembled and used by MAKER were individually aligned to the genome sequence using BLAT (15). We also aligned ∼9000 mRNAs sequenced using 454 technology (16). These alignments enable the user to identify the genomic location of previously published ESTs and grade the positions of exons and splice sites.
Protein homology data
To assist in determining gene function, homologs of the MAKER-predicted protein sequences are included in SmedGD. This set of data was obtained by comparing the MAKER proteins to the PFAM (17) and SMART (18) portions of the CDD database (19), and to Swiss-Prot (20) using RPS-BLAST (21) and BLAST (22). To further validate the predicted genes and identify missing exons, the proteomes of C. elegans, Drosophila melanogaster, Homo sapiens, and Mus musculus were individually subjected to TBLASTN comparisons (22) against the planarian genome translated into six frames.
Gene ontology
Gene Ontology terms (23–25) associated with each of the homologous database entries were extracted and entered into SmedGD. The addition of GO terms makes searching the database for genes with a specific association to a biological process, molecular function or cellular location possible (see below).
RNAi and whole-mount in situ hybridization data
In 2005, the results of an extensive RNAi screen in S. mediterranea were published (3). This work has been incorporated into SmedGD. RNAi phenotypes can be searched and the results link to the genome browser. The ‘Details Page’ displays images and descriptions of phenotypes. In addition to RNAi experimental data, mRNA expression patterns are also included in the database. If an in situ hybridization of an mRNA exists, images are correlated with the position of the corresponding gene in the genome and can be accessed for viewing directly from the genome browser (see below).
Additional data
Additional features mapped to the genome include human-curated gene annotations and mature microRNA sequences (26). Because of the modular nature of GMOD, it will not be difficult to add additional data as it is collected. Currently, we are testing implementations to incorporate microarray expression data into SmedGD.
Using SmedGD
Overview
SmedGD can be navigated from the top tool bar, where links to the ‘Genome Browser’, sequence search interfaces ‘Blast’, ‘Blat’ and the text search interface ‘Search’ can be found (Figure 1). In order to facilitate large-scale, high-throughput mining of the data in SmedGD, we established a standard naming nomenclature for all genes and associated data (Table 2). Each name consists of up to four fields separated by a period. The first field identifies the type of data being viewed (assembly version, annotation run, EST or 454 cDNA contigs). The second field indicates the number of the genomic or EST/454 contig in which the data can be found. The third and fourth fields indicate the identification number of the feature (e.g. gene, transcript) associated with the genomic contig. A description of the nomenclature with examples is presented in Table 2.
Table 2.
Standardized nomenclature strategy to denote individual entries in SmedGD
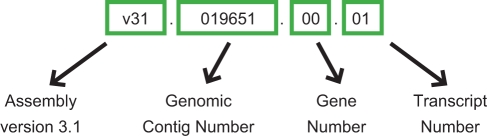
| Type | Example name | Description of field | |||
|---|---|---|---|---|---|
| Genomic contigs | v31.019651 | Assembly version 3.1 | Contig No* | ||
| Genes | mk4.019651.00 | Maker Run 4 | Contig No.* | Gene No.** | |
| Transcripts | mk4.019651.00.01 | Maker Run 4 | Contig No.* | Gene No.** | Transcript No.** |
| EST contigs | ec1.00159.004 | EST contig Version 1 | EST contig No.*** | No. of reads **** | |
| 454 contigs | fc1.08641.005 | 454 contig Version 1 | 454 contig No.*** | No. of reads **** |
Genome browser page
From within the genome browser the ‘Search Landmark or Region’ function can be used to query the database to find features mapped to specific regions of the genome. Examples of search terms are protein homology (piwi), contig names (v31.019651), and gene names (mk4.019651.00). The ‘Overview Panel’ provides a simplified view of the entire genomic contig (Figure 1). The red box indicates the area of the contig which is being viewed in the ‘Details’ panel. The red box can be recentered on a different area of the contig by clicking in the ‘Overview’ panel. The size of the box and therefore the number of base pairs viewed in the details panel can be altered by changing the parameters in the ‘Scroll/Zoom’ drop down menu or by adding the desired region to be viewed in the ‘Search Landmark or Region’ box of the contig. (e.g. v31.019651:1375..2445). The ‘Details’ panel contains the information that aligns to the genome, ranging from predicted genes to RNAi phenotypes. The information displayed in the ‘Details’ panel is controlled by the selection of tracks. Tracks are biologically and bioinformatically obtained data that have been aligned to the genomic contigs. The types of data are subdivided into the groups ‘Genes’, ‘Phenotype/Expression’, ‘Sequence Similarity’, ‘Species TBLASTN’ and ‘Non-Coding RNA’.
Genes
Within this group, genes/mRNAs predicted by MAKER that are supported by High Quality evidence (e.g. ESTs and protein homology), and ‘Human-Curated Genes/mRNAs’ (human-edited genes/mRNAs) are displayed. Presently, and using Apollo (6), only one investigator has manually curated gene models (Dr Alejandro Sánchez Alvarado). To identify the provenance of the curation, the edited gene models are identified by the three letter designation, e.g. ASA, followed by a gene number and transcript number (ASA.00084.01). It is expected that others will join efforts in the curation of genes. Such edits will be identified by a unique three letter designation corresponding to the name of the person or laboratory responsible for the editing.
Phenotype/expression
Display of RNAi Phenotypes and in situ data are controlled by this group of tracks. The RNAi Phenotypes appear as a bar that spans the length of the EST used to disrupt gene function by RNA interference. The description of the resulting phenotype is located under the bar (RNAi:AY967490). If an annotation has an mRNA in situ hybidization associated with it, a hyperlinked thumbnail is displayed that can be selected to obtain more detailed information (AY967481:in situ).
Sequence similarity
EST and 454 cDNA contigs, individual ESTs and protein sequences have been aligned to the genome and their display is controlled in this section of the ‘Tracks’. In the ‘454 contigs aligned with BLAT’, 454 contigs prepared from 454 sequencing reads were aligned to the genome using the Blat algorithm and standard psl output. BLAT is designed to quickly find sequences of 90% and greater similarity with a score of 30. In the ‘BLASTX Hits track’ nucleotide to protein comparisons, via WU-BLASTX six-frame translation (http://blast.wustl.edu) was used to find similarity hits of genomic sequence searched against a reference protein dataset comprising of the proteomes of E. coli, Saccharomyces cerevisiae, D. melanogaster, C. elegans, Platyhelminthes, Ciona intestinalis, mouse and human. Statistical cutoffs of 40% identity and expectation value of 1_e_−5 were used. The ‘EST BLASTN’ track is made up of contigs of S. mediterranea ESTs that were aligned to the S. mediterranea genome using cutoffs of 85% identity and expectation value of 1_e_−10. Similarly, ‘ESTs aligned with BLAT’ is made up of all the individual S. mediterranea ESTs aligned to the S. mediterranea genome using WU-BLAST formatted output from BLAT with expectation value cutoffs of 1_e_−95 and with at least 45% alignment of the EST.
There are three tracks that align whole proteins or protein domains to the MAKER predictions. The first of these, ‘BLASTP to Swissprot’ are alignments of predicted proteins from MAKER gene models against Swissprot. Next is the ‘MAKER predictions RPS-BLAST to PFAM’. These are alignments of predicted proteins from MAKER gene models against PFAM using NCBI RPS-Blast to identify known functional motifs. The last of the three tracks is the ‘MAKER predictions RPS-BLAST to SMART’. These are alignments of predicted proteins from MAKER gene models against SMART using NCBI RPS-Blast. An expectation value cutoff of 1_e_−3 and 40% alignment requirement with the protein hit was used in filtering the results of these three protein homology searches. The final option in the ‘Sequence Similarity’ grouping is ‘Repeat Regions’, which when selected displays areas of the genome containing interspersed repeats and low complexity DNA sequences as identified by RepeatMasker (http://www.repeatmasker.org/) using a _S. mediterranea_-specific repeat library (5).
Species TBLASTN
This track displays alignments of the proteomes of individual species to the planarian genome using TBLASTN. The proteomes of C. elegans, D. melanogaster, H. sapiens and M. musculus were aligned and results with expectation values equal to or less than 1_e_−5 and 30% alignment were selected for display in the browser. These pre-computed sets of data allow users to determine quickly if homologs to the gene of interest exist in the genomes of established genetic model systems.
Non-coding RNA
This track maps published mature miRNA sequences (26) to the genome (sme-miR-2b, for example). Efforts are underway to populate this track with miRNA gene predictions as well.
In all of the above cases, the images of the features in the ‘Details’ area of the genome browser that align to the genome can be selected to retrieve a ‘Details Page’. The information in the ‘Details Page’ of different feature types displays feature-specific information and links to tools and associated websites. For example, in the mRNA ‘Details Page’, the mRNA name is hyperlinked and selecting it will retrieve protein and nucleotide sequence, while in the miRNA ‘Details Page’, the name will link to the selected record in miRBase (http://microrna.sanger.ac.uk).
BLAST, BLAT and Search pages
The Search tools provide methods for users to directly query the databases of SmedGD. Sequences can be used to find homologs in S. mediterranea by using BLAST and BLAT. Both nucleotide and protein sequences can be used with BLAST, while BLAT will search the whole genome with nucleotide sequences only. The BLAT result page contains a button that will link the results to an auto-generated track in the browser, such that the queried sequence will be aligned visually to the genome and will be in correct alignment with the other data tracks. In the Search page a user can query the text data stored in SmedGD. Protein homology is queried in the Swissprot, SMART, PFAM and proteome hits to the genome (Figure 2A and B). Gene Ontology terms can be searched by cellular location, molecular function or biological process (Figure 3A). Finally RNAi phenotypes can also be queried with an assortment of checkboxes and drop down menus in an additive ‘AND’ fashion (Figure 3B).
Figure 2.

(A) The ‘Protein Homology’ Search interface. In this example, the search term ‘piwi-like’ is being submitted. Each of the hits from SwissProt, SMART, PFAM and the species-specific databases are searched for the user query term. (B) Results of the search are sorted by genomic contig and location. When more than one result is found on one contig, the matches are grouped and the background will be similarly colored. When there is more than one protein match for one genomic location, it is often due to this sequence matching more than one database. When there is only one result per contig the background is colored white. The contig and location are hyperlinked to the genome browser for further inspection.
Figure 3.

(A) ‘Gene Ontology’ Search interface. Users can search for terms, such as ‘stem cell’ in one of three Gene Ontology (GO) categories (e.g. Biological Process). Any protein homology hit to the genome that had GO terms associated with it will be searched and the corresponding genomic contig and location will be returned in a fashion similar to the ‘Protein Homology’ results page. (B) The ‘RNAi Phenotype’ search interface is used by selecting phenotypes from the five categories listed. More information about these categories and phenotypes can be found in (3). The selections are additive, therefore each of the records returned will contain all of the chosen phenotypes.
Curation and future expansions of SmedGD
Since SmedGD is based on GMOD tools, updates, expansion and gene model curation are significantly streamlined. This is a key feature of a GMOD-compliant organism/genome database as genome annotation and the generation of evidence to curate such models is a community-wide ongoing effort. As such, curation of individual genes and data associated with their function will need to be updated regularly. Apollo (http://fruitfly.org/annot/apollo/) will be used to edit gene annotations, since this software has been adopted by GMOD as its annotation workbench, and its outputs are GMOD compliant.
Currently under development is the incorporation of microarray data to SmedGD. Expression data associated with over 10 000 unique ESTs will be mapped to each corresponding alignment on the genome, allowing users of SmedGD to correlate genome location, expression pattern and functional data in a single window. In addition, we are exploring the implementation of Textpresso (www.textpresso.org) (27) for literature searching of both current and historical publications associated with planarians, regeneration, tissue homeostasis and stem cells. Finally, as the information accrued increases in complexity, we will also implement a BioMart-based data management system in order to facilitate data exports and simplify database management tasks.
ACKNOWLEDGEMENTS
Lincoln Stein, Scott Cain and other GMOD developers and users for assistance in the setting up and running of SmedGD; Mark Yandell and Brandi Cantarel for the annotation data that served to populate SmedGD; Marc Friedlaender and Nikolaus Rajewsky for the miRNA data; Juancarlo Añez and members of the Sánchez Alvarado laboratory and the planarian and biomedical community, in particular Voichita Marinescu, Kyle Gurley, Peter W. Reddien, Phillip A. Newmark and Tatjana Piotrowski for making suggestions to improve the content and user interface. This work was supported by NIH Genetics Training Grant 5 T32 GM007464 to S.M.C.R. A.S.A. is an Investigator of the Howard Hughes Medical Institute. Funding to pay the Open Access publication charges for the article was provided by the Howard Hughes Medical Institute.
Conflict of interest statement. None declared.
REFERENCES
- 1.Sánchez Alvarado A, Tsonis PA. Bridging the regeneration gap: genetic insights from diverse animal models. Nat. Rev. Genet. 2006;7:873–884. doi: 10.1038/nrg1923. [DOI] [PubMed] [Google Scholar]
- 2.Sánchez Alvarado A. Planarian regeneration: its end is its beginning. Cell. 2006;124:241–245. doi: 10.1016/j.cell.2006.01.012. [DOI] [PubMed] [Google Scholar]
- 3.Reddien PW, Bermange AL, Murfitt KJ, Jennings JR, Sánchez Alvarado A. Identification of genes needed for regeneration, stem cell function, and tissue homeostasis by systematic gene perturbation in planaria. Dev. Cell. 2005;8:635–649. doi: 10.1016/j.devcel.2005.02.014. [DOI] [PMC free article] [PubMed] [Google Scholar]
- 4.Newmark PA, Reddien PW, Cebria F, Sánchez Alvarado A. Ingestion of bacterially expressed double-stranded RNA inhibits gene expression in planarians. Proc. Natl Acad. Sci. USA. 2003;100(Suppl):11861–11865. doi: 10.1073/pnas.1834205100. [DOI] [PMC free article] [PubMed] [Google Scholar]
- 5.Cantarel B, Korf I, Robb SMC, Parra G, Ross E, Moore B, Holt C, Sánchez Alvarado A, Yandell M. 2007. MAKER: an easy-to-use annotation pipeline designed for emerging model organism genomes. In press. [DOI] [PMC free article] [PubMed] [Google Scholar]
- 6.Lewis SE, Searle SM, Harris N, Gibson M, Lyer V, Richter J, Wiel C, Bayraktaroglir L, Birney E, et al. Apollo: a sequence annotation editor. Genome Biol. 2002;3 doi: 10.1186/gb-2002-3-12-research0082. RESEARCH0082. [DOI] [PMC free article] [PubMed] [Google Scholar]
- 7.Stein LD, Mungall C, Shu S, Caudy M, Mangone M, Day A, Nickerson E, Stajich JE, Harris TW, et al. The generic genome browser: a building block for a model organism system database. Genome Res. 2002;12:1599–1610. doi: 10.1101/gr.403602. [DOI] [PMC free article] [PubMed] [Google Scholar]
- 8.Eilbeck K, Lewis SE, Mungall CJ, Yandell M, Stein L, Durbin R, Ashburner M. The sequence ontology: a tool for the unification of genome annotations. Genome Biol. 2005;6:R44. doi: 10.1186/gb-2005-6-5-r44. [DOI] [PMC free article] [PubMed] [Google Scholar]
- 9.Stajich JE, Block D, Boulez K, Brenner SE, Chervitz SA, Dagdigian C, Fuellen G, Gilbert JG, Korf I, et al. The Bioperl toolkit: Perl modules for the life sciences. Genome Res. 2002;12:1611–1618. doi: 10.1101/gr.361602. [DOI] [PMC free article] [PubMed] [Google Scholar]
- 10.Wang L, Wang S, Li Y, Paradesi MS, Brown SJ. BeetleBase: the model organism database for Tribolium castaneum. Nucleic Acids Res. 2007;35:D476–D479. doi: 10.1093/nar/gkl776. [DOI] [PMC free article] [PubMed] [Google Scholar]
- 11.Arnaiz O, Cain S, Cohen J, Sperling L. ParameciumDB: a community resource that integrates the Paramecium tetraurelia genome sequence with genetic data. Nucleic Acids Res. 2007;35:D439–D444. doi: 10.1093/nar/gkl777. [DOI] [PMC free article] [PubMed] [Google Scholar]
- 12.Zayas RM, Hernandez A, Habermann B, Wang Y, Stary JM, Newmark PA. The planarian Schmidtea mediterranea as a model for epigenetic germ cell specification: analysis of ESTs from the hermaphroditic strain. Proc. Natl Acad. Sci. USA. 2005;102:18491–18496. doi: 10.1073/pnas.0509507102. [DOI] [PMC free article] [PubMed] [Google Scholar]
- 13.Sánchez Alvarado A, Newmark PA, Robb SM, Juste R. The Schmidtea mediterranea database as a molecular resource for studying platyhelminthes, stem cells and regeneration. Development. 2002;129:5659–5665. doi: 10.1242/dev.00167. [DOI] [PubMed] [Google Scholar]
- 14.Huang X, Madan A. CAP3: a DNA sequence assembly program. Genome Res. 1999;9:868–877. doi: 10.1101/gr.9.9.868. [DOI] [PMC free article] [PubMed] [Google Scholar]
- 15.Kent WJ. BLAT–the BLAST-like alignment tool. Genome Res. 2002;12:656–664. doi: 10.1101/gr.229202. [DOI] [PMC free article] [PubMed] [Google Scholar]
- 16.Emrich SJ, Barbazuk WB, Li L, Schnable PS. Gene discovery and annotation using LCM-454 transcriptome sequencing. Genome Res. 2007;17:69–73. doi: 10.1101/gr.5145806. [DOI] [PMC free article] [PubMed] [Google Scholar]
- 17.Bateman A, Coin L, Durbin R, Finn RD, Hollich V, Griffiths-Jones S, Khanna A, Marshall M, Moxon S, et al. The Pfam protein families database. Nucleic Acids Res. 2004;32:D138–D141. doi: 10.1093/nar/gkh121. [DOI] [PMC free article] [PubMed] [Google Scholar]
- 18.Ponting CP, Schultz J, Milpetz F, Bork P. SMART: identification and annotation of domains from signalling and extracellular protein sequences. Nucleic Acids Res. 1999;27:229–232. doi: 10.1093/nar/27.1.229. [DOI] [PMC free article] [PubMed] [Google Scholar]
- 19.Marchler-Bauer A, Anderson JB, Derbyshire MK, DeWeese-Scott C, Gonzales NR, Gwadz M, Hao L, He S, Hurwitz DI, et al. CDD: a conserved domain database for interactive domain family analysis. Nucleic Acids Res. 2007;35:D237–D240. doi: 10.1093/nar/gkl951. [DOI] [PMC free article] [PubMed] [Google Scholar]
- 20.Boeckmann B, Bairoch A, Apweiler R, Blatter MC, Estreicher A, Gasteiger E, Martin MJ, Michoud K, O'Donovan C, et al. The SWISS-PROT protein knowledgebase and its supplement TrEMBL in 2003. Nucleic Acids Res. 2003;31:365–370. doi: 10.1093/nar/gkg095. [DOI] [PMC free article] [PubMed] [Google Scholar]
- 21.Gowri VS, Tina KG, Krishnadev O, Srinivasan N. Strategies for the effective identification of remotely related sequences in multiple PSSM search approach. Proteins. 2007;67:789–794. doi: 10.1002/prot.21356. [DOI] [PubMed] [Google Scholar]
- 22.McGinnis S, Madden TL. BLAST: at the core of a powerful and diverse set of sequence analysis tools. Nucleic Acids Res. 2004;32:W20–W25. doi: 10.1093/nar/gkh435. [DOI] [PMC free article] [PubMed] [Google Scholar]
- 23.Camon E, Magrane M, Barrell D, Binns D, Fleischmann W, Kersey P, Mulder N, Oinn T, Maslen J, et al. The Gene Ontology Annotation (GOA) project: implementation of GO in SWISS-PROT, TrEMBL, and InterPro. Genome Res. 2003;13:662–672. doi: 10.1101/gr.461403. [DOI] [PMC free article] [PubMed] [Google Scholar]
- 24.Camon E, Magrane M, Barrell D, Lee V, Dimmer E, Maslen J, Binns D, Harte N, Lopez R, et al. The Gene Ontology Annotation (GOA) Database: sharing knowledge in Uniprot with Gene Ontology. Nucleic Acids Res. 2004;32:D262–D266. doi: 10.1093/nar/gkh021. [DOI] [PMC free article] [PubMed] [Google Scholar]
- 25.Mulder NJ, Apweiler R, Attwood TK, Bairoch A, Bateman A, Binns D, Bradley P, Bork P, Bucher P, et al. InterPro, progress and status in 2005. Nucleic Acids Res. 2005;33:D201–D205. doi: 10.1093/nar/gki106. [DOI] [PMC free article] [PubMed] [Google Scholar]
- 26.Palakodeti D, Smielewska M, Graveley BR. MicroRNAs from the Planarian Schmidtea mediterranea: a model system for stem cell biology. Rna. 2006;12:1640–1649. doi: 10.1261/rna.117206. [DOI] [PMC free article] [PubMed] [Google Scholar]
- 27.Muller HM, Kenny EE, Sternberg PW. Textpresso: an ontology-based information retrieval and extraction system for biological literature. PLoS Biol. 2004;2:e309. doi: 10.1371/journal.pbio.0020309. [DOI] [PMC free article] [PubMed] [Google Scholar]