Sequence and Length Dependent Thermodynamic Differences in Heterocyclic Diamidine Interactions at AT Base Pairs in the DNA Minor Groove (original) (raw)
. Author manuscript; available in PMC: 2008 Dec 1.
Published in final edited form as: Biophys Chem. 2007 Sep 6;131(1-3):1–14. doi: 10.1016/j.bpc.2007.08.007
Abstract
With the goal of developing a better understanding of the antiparasitic biological action of DB75, we have evaluated its interaction with duplex alternating and nonalternating sequence AT polymers and oligomers. These DNAs provide an important pair of sequences in a detailed thermodynamic analysis of variations in interaction of DB75 with AT sites. The results for DB75 binding to the alternating and nonalternating AT sequences are quite different at the fundamental thermodynamic level. Although the Gibbs energies are similar, the enthalpies for DB75 binding with poly(dA)·poly(dT) and poly(dA-dT)·poly(dA-dT) are +3.1 and −4.5 kcal/mole, respectively, while the binding entropies are 41.7 and 15.2 cal/mol·K, respectively. The underlying thermodynamics of binding to AT sites in the minor groove plays a key role in the recognition process. It was also observed that DB75 binding with poly(dA)·poly(dT) can induce T·A·T triplet formation and the compound binds strongly to the dT·dA·dT triplex.
Keywords: DB75, alternating and nonalternating AT DNAs, thermodynamics, differential scanning calorimetry, isothermal titration microcalorimetry, biosensor-surface plasmon resonance
1. Introduction
Synthetic organic cations that bind to the DNA minor groove provide important examples of clinically useful therapeutic agents, biotechnology regents and compounds to probe the molecular basis of DNA recognition and control gene expression. Investigations on the molecular basis of DNA minor groove recognition by a variety of agents over the last several years have produced some interesting and thought–provoking results. As shown by DNA footprinting methods, well–characterized and structurally–diverse compounds, such as netropsin, Hoechst 33258 and berenil, which bind at AT sites in the DNA minor groove, can interact with a large variety of AT sequences [1, 2]. For compounds of this size, a site of at least four base pairs in length is required but the affinities of the compounds for different AT sites can vary by a surprisingly large amount [3–5]. Early studies of netropsin binding to synthetic polydeoxyribonucleotides by Zimmer and coworkers[6, 7] revealed sequence dependent differences in affinities and complex structures. The weak binding of the minor groove–targeted compounds listed above to GC containing sites has been explained by structural studies which show the compounds bound deep in the minor groove in AT sites and in close contact with the edges of AT base pairs at the floor of the groove [8–12]. This allows H-bonds to form with the TO2 and AN3 groups in AT base pairs but such close contact is sterically prevented by the 2-NH2 group of G. The diversity of affinities for minor groove compounds with AT sequences, however, has not been extensively investigated.
The importance of the G-NH2 group for binding specificity was verified by Bailly and Waring [13] who showed that replacement of G by inosine and substitution of 2,6-diaminopurine (DAP) for adenosine completely reversed the AT/GC binding specificity of minor groove binding agents [4]. Fox conducted a detailed footprinting study with netropsin, Hoechst 33258 and berenil with a designed DNA sequence that contained all possible sequences of four AT base pairs. The largest variations in affinity were found in comparison of sites such as AATT, which binds all three ligands quite strongly, and sites with a TA step such as TATA and TTAA, which bind the ligands significantly more weakly. With Hoechst 33258, for example, there is a fifty fold decrease in binding from the AATT to the TATA site [4]. Footprinting results with the AAAA and ATAT sequences, which are the same as in the synthetic polymers, poly(dA)·poly(dT) and poly(dA-dT)·poly(dA-dT), vary significantly among the compounds. Hoechst 33258 binds approximately ten fold better to the A4 sequence, netropsin binds approximately three times better to that sequence but berenil shows no significant difference in affinity between the alternating and nonalternating sites. Berenil does bind at least ten fold more weakly to TTAA than to AATT, however, and it is clear that all of the minor groove binding compounds have different abilities to distinguish among equivalent length AT binding sequences [4].
Breusegem et al.[14], by using fluorescence changes on binding, found a 200 fold better affinity for Hoechst 33258 binding to AATT versus TTAA in DNA oligomers while a 30 fold difference was observed for the heterocyclic diamidine, DAPI, with the same sequences. It has been suggested that the difference among these sites is at least partly due to differences in groove width [15–17]. Sites such as AATT, for example, have a more narrow groove than TTAA and are in a pre-binding conformation that is better suited to complex formation with unfused heterocyclic compounds such as those discussed above. There are, no doubt, other contributing factors that result in individual compound differences, such as groove hydration and local sequence dependent helix axis bending [18].
Heterocyclic diamidines that target AT sequences and that have significant biological activity against specific DNA target sites in parasitic microorganisms [19–21] are of particular interest for drug development. A prodrug of the lead compound, DB75 (Figure 1), is currently in phase III clinical trials against trypanosome induced sleeping sickness and other compounds of this type are being tested against trypanosomes and other diseases in humans [19, 22]. For detailed understanding of the biological mechanism of the diamidines as well as for drug design and development progress, it is important to develop a thorough understanding of the molecular recognition of different DNA sequences by these compounds. The underlying thermodynamics of binding to AT sites in the minor groove can be quite different and can play a key role in the recognition process. Leng and coworkers [23] have recently shown, for example, that the AT-hook transcription factor, HMGA, which targets AT sites in the DNA minor groove, has similar Gibbs energy for binding to alternating and nonalternating AT sites but quite different enthalpies of binding. Examples of enthalpy/entropy compensation have also been observed with minor groove binding drugs and different DNA AT sites. Binding of netropsin to poly(dA-dT)·poly(dA-dT), for example, is enthalpy driven but the binding to poly(dA)·poly(dT) is driven by entropy [24, 25].
Fig. 1.

Structure of the compound and the DNA sequences used in this study.
Diamidine compounds, such as DB75, have been shown to specifically target AT rich DNA sequences, such as those in the trypanosome mitochondrial kinetoplast DNA, and this can result in differential biological activities or cell type targeting. The kinetoplast DNA (kDNA) has been shown by fluorescence microscopy studies to be the favored binding site of the compounds [22]. The kDNA is one of the most unusual nucleic acid structures found in any organism [26–28]. In T. brucei, the cause of sleeping sickness, the structure consists of approximately 50 DNA maxicircles of 20000–40000 base pairs. These are the coding DNAs of the mitochondria and are similar to the mitochondrial genomes of other organisms. There are approximately 10,000 minicircles of 1000 base pairs that are interlinked with the maxicircles to form a disk-shaped kinetoplast. The minicircles are AT rich, typically 70–75% AT base pairs, and contain phased A–tracts that lead to significant bending of the DNA helix. The extensive AT sequences in the minicircle DNAs form an attractive target for AT specific DNA binding compound. Even a small amount of interference with transcription and replication of minicircles can cause specific destruction of the complex interlocked kinetoplast structure and death of the trypanosome cell. A–tract bent DNA was discovered in early studies of minicircle DNAs from both trypanosome and Leishmania cells. DNA sequences for 25 minicircles have been reported and compared recently [29]. The minicircles contain nearly 100 AT sites of four or more contiguous AT base pairs that are potential binding receptor sites for diamidine drugs such as DB75 (Figure 1). Clearly, to better understand the mechanism of action of the diamidines against kinetoplastid parasites and to design a broader range of improved drugs, it is essential to investigate the interaction of diamidines, such as DB75, with DNAs of different AT sequences.
With the goal of developing a better understanding of the antiparasitic biological action of DB75 as well as to better understand the molecular recognition of DNA by this biologically important compound, we have evaluated its interaction with the duplex alternating and nonalternating sequence AT polymers and oligomers. These DNAs provide an important pair of sequences of an initial detailed analysis of variations in interaction of DB75 with AT sites of different sequence. Although the primary method used in the studies is isothermal titration calorimetry (ITC), results for ultraviolet thermal melting (Tm), circular dichroism (CD), biosensor–surface plasmon resonance (SPR) and differential scanning calorimetry (DSC) are also presented. The results for DB75 binding to the alternating and nonalternating AT sequences are quite different at the fundamental thermodynamic level. Because kinetoplast DNAs are closed circles with extended A-tracts, the possibility of fold back triple helical structures is significant and we have, therefore conducted a limited study of DB75 binding to the triple–helical polymer composed of T·A·T triplets. We observed that DB75 can induce and bind strongly to the triplex complementary to those results reported by Chaires et al.[30] for several diamidines.
2. Materials and methods
2.1. Compound, DNAs, and buffers
DB75 was synthesized as previous described [31]. Its purity was verified by NMR and elemental analysis. The double stranded polymers poly(dA)·poly(dT), poly(dA-dT)·poly(dA-dT) were purchased from Pharmacia (U. S. A.), and used for spectroscopic and calorimetric experiments. The hairpin oligomers used in this study were A15 [d(CCAAAAAAAAAAAAAAAGCCCCCGCTTTTTTTTTTTTTTTGG)], (AT)7 [d(CCATATATATATATATAGCCCCCGCTATATATATATATATGG], A8 [d(CAAAAAAAACCCCTTTTTTTTG)] and (AT)4 [d(CATATATATCCCCATATATATG)], with the hairpin loop sequences underlined. In SPR experiments, three 5′-Biotin labeled hairpin DNA oligomers namely d(Biotin-CCA15GCCCCCGCT15GG) (A15 hairpin), d(Biotin-CATATATATATATATACCCCTATATATATATATATG) [(AT)7 hairpin], d(Biotin-CGCGCGCGTTTTCGCGCGCG) [(CG)4 hairpin] were used. The above hairpin oligomers are all from Integrated DNA technologies, Inc. with reverse phased HPLC purification and mass spectrometry characterization. The MES buffers used in these experiments contained 0.01 M [2-(N-morpholino) ethanesulfonic acid] (MES), 0.001 M EDTA, 0.1 M NaCl, pH 6.25.
2.2. UV melting studies
Ultraviolet melting curves were determined in 1 cm path length quartz cells using a Cary 300 UV–Visible spectrophotometer (Varian Inc., Palo Alto, CA), equipped with a thermoelectric temperature controller. Absorbance versus temperature profiles were measured at 260 nm with a heating rate of 0.5 °C/min. Experiments were generally conducted at a concentration of 4 × 10⁻⁵ M base pairs for polymeric DNA and 1.5 × 10⁻⁶ M oligomers for hairpin DNA. Thermal melting experiments for the DNA–compound complexes were conducted as a function of different ratios. Melting temperature (T_m) was taken as the temperature of half–dissociation of the DNA duplex or hairpin and was obtained from the maximum of the first derivative d_A/d_T_ plots (where A is absorbance and T is temperature).
2.3. CD titration and melting studies
CD spectra were recorded using a Jasco J–810 instrument with a 1cm cell and a scan speed of 50 nm/min with a response time of 1 s. The spectra from 500 to 220 nm were averaged over five scans. A buffer baseline scan was collected in the same cuvette and subtracted from the average scan for each sample. For isothermal titration studies, measurements were performed at 25 °C. The desired ratios of compound to DNA were obtained by adding DB75 to the cell containing a constant amount of DNA. For melting studies, CD spectra were collected at different temperatures from 10 °C to 95 °C. The compound to the polymeric DNA base pairs ratio was chosen as 0.25 and 0.5. Data processing and plotting were performed with Kaleidagraph software.
2.4. DSC melting studies
The DSC experiments were performed on a Microcal VP–DSC microcalorimeter (MicroCal Inc., Northampton, MA, USA). The polymeric DNA [poly(dA)·poly(dT) or poly(dA-dT)·poly(dA-dT)] solution at a concentration of 0.04 mM basepairs in MES10 buffer was used for all experiments. Prior to scanning, the buffer and the samples were vacuum–degassed. The experiments over the temperature range from 10 to 110 °C and a heating rate of 60 °C/h was used. Primary data were corrected by subtraction of a buffer–buffer baseline, normalized to the concentration of DNA (in base pairs) and further base line corrected. Data acquisition and analysis were performed with the Origin graphics software. The calorimetric enthalpy, Δ_H_cal, was determined by integration of the area enclosed by the transition curve and the pre/posttransition baseline, and the melting temperature, _T_m, was determined as the midpoint of the melting transition.
The binding constants for the DB75 complexes with the poly(dA)·poly(dT) or poly(dA-dT)·poly(dA-dT) duplex could be calculated using a _T_m shift method and the following equation:
| ΔHm(1/Tm0−1/Tm)=Rln(1+KTmL)1/n | (1) |
|---|
where _T_m0 is the melting temperature of the DNA alone, _T_m is the meting temperature in the presence of saturating amounts of ligand, Δ_H_m is the enthalpy of DNA melting (per mol bp) determined by DSC, R is the gas constant, _K_Tm is the ligand binding constant at _T_m, L is the free ligand concentration and n is the ligand site size [32–34].
The DNA binding constant of DB75 at lower temperatures was estimated by use of the van’t Hoff equation:
| Rln(K/KTm)=−ΔHb(1/T−1/Tm) | (2) |
|---|
Where K is the DNA binding constant of DB75 at temperature T, and Δ_H_b is the enthalpy of binding of DB75 to DNA determined by ITC at the corresponding temperature [35].
2.5. ITC thermodynamic studies
The ITC experiments were performed with a MicroCal VP–ITC (MicroCal Inc., Northampton, MA, USA) interfaced with a computer for instrument control and data collection with Origin 5.0 software. In a typical titration, 7 μl of a 0.08 mM DB75 solution in MES10 buffer was added every 300 s to a total of 40 injections to polymeric DNA [poly(dA)·poly(dT) or poly(dA-dT)·poly(dA-dT)] solution in the sample cell at 0.04 mM basepairs. The observed heat for each injection was determined by integration of the power peak area with respect to time. Blank titrations were conducted by injecting the compound into the sample cell containing only MES10 buffer under the same conditions. The corrected interaction heat was determined by subtracting the blank heat from that for the compound/DNA titration. The number of binding sites, equilibrium constants, binding enthalpy and entropy were obtained by fitting the corrected data to an appropriate binding model.
Binding enthalpies for different length of DNA hairpins [A15, A8, (AT)7, (AT)4] with DB75 were determined using the “model–free ITC” protocol to obtain multiple estimates of Δ_H_° and to avoid any possible fitting bias [35, 36]. This protocol, which uses a high DNA concentration, ensures that all titrated drug is effectively bound after each addition. Specifically, a 0.03 mM hairpin DNA solution was loaded into the sample cell and a 0.15 mM DB75 solution in MES10 buffer was titrated into DNA. Usually 20 injections of 7 μl were done with 300 s between injections to ensure equilibration. The heat of reaction (Δ_H_) was obtained by integration of the peaks after each injection. The dilution heats, determined by injecting drug solution into the same sample cell loaded with buffer alone, were subtracted from the Δ_H_ value determined for titration into hairpin DNA to render a corrected value for the binding–induced enthalpy change.
2.6. Biosensor–SPR studies
SPR measurements were performed with a four–channel BIAcore 2000 optical biosensor system (BIAcore Inc.). 5′-biotin labeled DNA samples [A15 hairpin, (AT)4 hairpin and (CG)4 hairpin] were immobilized onto streptavidin–coated sensor chips (BIAcore SA) as previously described [37]. Three flow cells were used to immobilize the DNA oligomer samples, while a fourth cell was left blank as a control. The SPR experiments were performed in filtered, degassed MES10 buffer with 5×10⁻³% v/v Surfactant P20. Steady state binding analysis was performed with multiple injections of different compound concentrations over the immobilized DNA surface at a flow rate of 25 μl/min and 25 °C. Solutions of known ligand concentration were injected through the flow cells until a constant steady–state response was obtained. Compound solution flow was then replaced by buffer flow resulting in dissociation of the complex. The reference response from the blank cell was subtracted from the response in each cell containing DNA to give a signal (RU, response units) that is directly proportional to the amount of bound compound. The predicted maximum response per bound compound in the steady-state region (_RU_max) was determined from the DNA molecular weight, the amount of DNA on the flow cell, the compound molecular weight, and the refractive index gradient ratio of the compound and DNA, as previously described [37, 38]. The number of binding sites and the equilibrium constant were obtained from fitting plots of RU versus _C_free. Binding results from the SPR experiments were fit with two– (_K_3, _K_4 = 0), three– (_K_4 = 0) or four–sites interaction models:
r=(K1∗Cfree+2∗K1∗K2∗Cfree2+3∗K1∗K2∗K3∗Cfree3+4∗K1∗K2∗K3∗K4∗Cfree4)/(1+K1∗Cfree+K1∗K2∗Cfree2+K1∗K2∗K3∗Cfree3+K1∗K2∗K3∗K4∗Cfree4)
where r represents the moles of bound compound per mole of DNA hairpin duplex, _K_1, _K_2, _K_3, _K_4 are macroscopic binding constants, and _C_free is the free compound concentration in equilibrium with the complex.
3. Results
3.1. UV melting studies
Relative stabilities of the compound–DNA complexes were evaluated by temperature–dependent UV absorbance measurements at 260 nm (Figure 2 and Figure S1 in supporting information). Figure 2A shows the profiles of thermally induced denaturation of the complexes formed with poly(dA)·poly(dT) and poly(dA-dT)·poly(dA-dT) in the absence and presence of DB75 at ratios of 0.25 and 0.5 compound per base pair. The similar observed large increases in melting temperature indicate that DB75 binds strongly to both polymeric DNA samples. As can be seen, the melting profiles for poly(dA)·poly(dT) and poly(dA-dT)·poly(dA-dT) in the absence and presence of DB75 were significantly different in the low temperature region. For the alternating copolymer duplex poly(dA-dT)·poly(dA-dT), the melting profiles in the absence and presence of DB75 were all monophasic, representing a single transition that corresponds to the well–known duplex to single strand denaturation of poly(dA-dT)·poly(dA-dT). In contrast, a biphasic melting profile was observed for poly(dA)·poly(dT) in the presence of DB75. The higher temperature transition corresponds to the melting of the expected Watson–Crick (WC) duplex, while the lower temperature transition is assigned to the dissociation of polydT from polydA·2polydT triplex [the Hoogsteen (HG) transiton] [30]. Without DB75 only the high temperature WC transition for poly(dA)·poly(dT) was evident. The triplex formation suggests that the polymer sample contains a slight excess of the polydT strand that can form a DB75 induced dT·dA·dT triplex under these conditions. The triplex formation is DNA sequence dependent as expected.
Fig. 2.

UV melting profiles at 260nm of the polymeric DNAs and DNA hairpins in the absence and presence of DB75. (A) Thermal melting curves of poly(dA)·poly(dT) and poly(dA-dT)·poly(dA-dT) at the indicated ratio. (B) Thermal melting curves of A15 and AT7 hairpins at the indicated ratio. (C) A phase diagram for _T_m versus molar ratio for the thermal transitions of PolydA·PolydT (left) and DNA hairpins (right). The regions of triplex–duplex–single strand stability are labelled for the polymer. The oligomers have only duplex and single strand phase.
To investigate the effects of DB75 on inducing the triplex formation, UV melting experiments with poly(dA)·poly(dT) in the presence of increasing molar ratios of added DB75 were carried out (Figure S1C, Supporting information). Upon addition of increasing molar ratios of DB75, two transitions were evident in melting profiles. These equilibrium positions are summarized with a triplex→duplex→single strand phase transition plot of thermal stability versus DB75 ratio in Figure 2C (left). We observed significant effects of the DB75 ratio on the _T_m corresponding to the triplex to duplex transition, which increases from 32 °C to 51 °C, while that of duplex to single strand transition increases from 64 °C to 90 °C [Figure 2C (left)] as the ratio is increased. These studies clearly show that triplex formation induced by DB75 binding is compound–DNA ratio and temperature dependent.
The profiles of thermally induced denaturation of the complexes formed with DNA hairpins [A15, (AT)7, A8 and (AT)4), Figure 1] in the absence and presence of DB75 at different ratios are shown in Figure 2B and Figure S1(A,B) (Supporting information). As expected, only one transition, corresponding to the unfolding of hairpin DNA, is observed in these melting profiles. The effect of DB75 ratio on the _T_m of DNA hairpins is shown in Figure 2C (right). As can be seen, saturation binding is observed at compound–DNA ratios of 4:1 for A15 and (AT)7 hairpins, and 3:1 for A8 and (AT)4 hairpins.
3.2. CD titration and melting Studies
CD titration experiments as a function of DB75 concentration were utilized to monitor the binding mode and saturation limit for DB75 complexes with poly(dA)·poly(dT) and poly(dA-dT)·poly(dA-dT) and DNA hairpins, A15, (AT)7, A8 and (AT)4 (Figure 1). Results for the polymers in Figure 3 show that the CD spectral titrations of DB75 had large positive induced CD signals above 300 nm for both AT sequences. In the 300–500 nm region, free DB75 and DNA do not exhibit CD signals. DNA does not absorb in this wavelength range and free DB75 is optically inactive. Positive CD signals arise from the interaction of the DB75 chromophore with the dissymmetric environment of the DNA minor groove [39, 40]. The large positive induced CD signal for the complex is a characteristic pattern for a minor grove binding mode in AT sequences. Similar CD patterns at 267 and 391 nm for poly(dA)·poly(dT) (Figure 3A) and A15 (Figure 3C) as well as for poly(dA-dT)·poly(dA-dT) (Figure 3B) and (AT)7 (Figure 3D) are also observed. The induced CD signals at 267 and 391 nm were also plotted against compound–DNA ratio (insert in Figure 3). For the polymeric DNAs, the break in the plot at the ratio of ~0.25 indicates a binding site size of 4~5 base pairs DNA per compound, which agrees with the ITC results shown below. The saturated compound–DNA ratio obtained as 4 DB75/hairpin is also consistent with the UV melting (Figure 2B) and SPR experiments (shown below).
Fig. 3.

CD titration spectra of the polymeric DNAs and DNA hairpins binding with DB75 at various mixing ratios. Insert: increase in CD magnitude at 391nm (○) and decrease in CD magnitude at 267nm (●).
To investigate the melting of the complexes formed by both polymeric DNAs in the absence and presence of DB75, the temperature–dependent CD spectra at various wavelengths were monitored (Figure 4, Figure S3, Supporting information). In the presence of DB75 the CD melting curves of poly(dA)·poly(dT) at either 267 nm (Figure 4A) or 391 nm (Figure 4C) are clearly biphasic. In accordance with UV melting experiments, the lower temperature transition reflects dissociation of the polydT third strand from the polydA·2polydT triplex (the HG transition), whereas the higher temperature transition corresponds to the expected WC dissociation reaction. These CD–detected transitions reaffirm that DB75 binding induced the formation of triple helices. As the DB75 ratio increases from 0.25 to 0.5, the _T_m for the HG and WC transition also increases, consistent with the UV melting experiments (Figure 2A). In contrast to the biphasic melting profiles for poly(dA)·poly(dT), the CD melting curves of poly(dA-dT)·poly(dA-dT) were monophasic in the presence of DB75 at 267 nm (Figure 4B) and 391 nm (Figure 4D), indicating only a single WC transition.
Fig. 4.

Temperature–dependent CD magnitude (relative to the CD at 10 °C, CDT/CD10°C) of the polymeric DNAs and their DB75 complexes at 267 and 391 nm.
3.3. DSC melting studies
DSC can be used to quantitatively evaluate thermally induced structural transitions in DNA. Binding of DB75 to poly(dA)·poly(dT) and poly(dA-dT)·poly(dA-dT) was evaluated from the DSC results by using a _T_m shift method (Figure 5, Equation 1). The DSC enthalpy of DNA melting (Δ_H_m) and _T_m are shown in Table 1. Values for the _T_m in the presence and absence of DB75 are consistent in both UV melting and DSC experiments. In the presence of saturating concentrations of DB75, the _T_m increases 26 °C for poly(dA)·poly(dT) and 23 °C for poly(dA-dT)·poly(dA-dT), which agrees with strong binding for both polymeric DNAs. By application of equations 1 and 2, described in Materials and Methods, the binding constant (K) at 25 °C was calculated as 5.6×10⁶ M−1 for poly(dA)·poly(dT) and 5.4×10⁶ M−1 for poly(dA-dT)·poly(dA-dT), respectively. These equations require the enthalpy of binding of DB75 to the polymeric DNAs (Δ_H_b) at 25 °C and the ligand site size (n) determined by ITC, described below (Table 2). These K values agree with the binding constants obtained from ITC experiments (Table 2). By using the above method, we could obtain K at any temperature without assuming that Δ_H_b is independent of temperature.
Fig. 5.

DSC excess heat capacity (Δ_C_p) versus temperature profiles for polymeric DNAs binding with DB75. Melting curves for poly(dA)·poly(dT) in the absence and presence of DB75 (A), and poly(dA-dT)·poly(dA-dT) in the absence and presence of DB75 (B).
Table 1.
DSC determined binding parameters for the interaction of DB75 with poly(dA)·poly(dT) and poly(dA-dT)·poly(dA-dT).a
| _T_m0 (°C) | _T_m (°C) | Δ_H_m (kcal/mole) | _K_Tm (M−1) | Δ_Hb_ (kcal/mole) | K (M−1) | |
|---|---|---|---|---|---|---|
| Poly(dA)·poly(dT) | 66.1 | 92.2 | 9.84 | 1.82×10⁷ | 3.11 | 6.94×10⁶ |
| Poly(dA-dT)2 | 59.5 | 82.4 | 7.16 | 1.57×10⁶ | −4.52 | 5.35×10⁶ |
Table 2.
ITC determined binding parameters for the interaction of DB75 with poly(dA)·poly(dT) and poly(dA-dT)·poly(dA-dT).a
| n (bp/drug) | K (M−1) | Δ_H_ (kcal/mole) | TΔ_S_ (kcal/mole) | Δ_G_ (kcal/mole) | Δ_Cp_ (cal mol−1 K−1) | |
|---|---|---|---|---|---|---|
| Poly(dA)·poly(dT) | 4.71 | 7.06×10⁶ | 3.11 | 12.4 | −9.34 | −174 |
| Poly(dA-dT)2 | 4.01 | 4.51×10⁶ | −4.52 | 4.54 | −9.06 | −127 |
As observed in the UV and CD melting profiles (Figure 2A and Figure 4A), the heat capacity versus temperature curve for poly(dA)·poly(dT) binding with DB75 are also biphasic (Figure 5A), with the low–temperature transition centered around 50 °C due to the dissociation of the polydT third strand from the polydA·2polydT triplex (the HG transition) and the high–temperature transition at 90 °C due to the dissociation of the duplex strands (the WC transition). By contrast, a clear monophasic transition corresponding to WC transition appeared in the thermal denaturation profile for poly(dA-dT)·poly(dA-dT) binding with DB75 (Figure 5B). The UV and CD melting profiles and the DSC thermograms for poly(dA)·poly(dT) all reveal triplex formation induced by DB75 binding.
3.4. ITC thermodynamic studies
To probe the detailed energetic basis of the DB75 sequence dependent interaction differences in more detail and at a constant temperature, ITC experiments were conducted with the AT sequence DNAs (Figure 1). Calorimetric titration curves of poly(dA)·poly(dT) and poly(dA-dT)·poly(dA-dT) with DB75 at 25 °C (Figure 6) are completely different. A large positive enthalpy is observed in the ITC titration of DB75 into poly(dA)·poly(dT), while a large negative enthalpy is obtained on titration of DB75 into alternating poly(dA-dT)·poly(dA-dT) at the same conditions. The titration heat was converted to heat per mole as a function of total molar ratio with subtraction of the heat for a blank titration of DB75 into buffer with no DNA. The corrected isotherm was fitted to a 1:1 model to obtain a full set of thermodynamic parameters (Table 2). The binding stoichiometry of 4~5 base pairs of DNA per compound by ITC experiments is consistent with that obtained from CD titration experiments. At 25 °C DB75 binding to poly(dA)·poly(dT) is overwhelmingly entropy driven, whereas DB75 binding to poly(dA-dT)·poly(dA-dT) is enthalpy driven. The similarity in the DB75 binding free energies for both polymeric DNAs results from impressive enthalpy–entropy compensation, a common signature of minor grove binders [41, 42].
Fig. 6.

ITC curves for the binding of DB75 to the AT DNA polymers and hairpins in MES10 at 25 °C. Every peak represents the instrument response for injection of DB75 into DNA during the course of the titration (top). A binding isotherm from integration with respect to time, with appropriate dilution correction (bottom). For poly(dA)·poly(dT) (A) and poly(dA-dT)·poly(dA-dT) (B), the smooth lines show the fit to the results and best fit Δ_H_ (Table 2) values for binding. For A15 (C) and (AT)7 (D) hairpins, a ‘model–free ITC’ protocol was used to obtain Δ_H_.
Binding enthalpies for different length DNA hairpins (Figure 1) with DB75 were determined using a “model–free ITC” protocol at low binding ratios to avoid any fitting bias and influence by end effects for binding to oligomers [36]. Figure 6C and 6D show representative primary data from the titration of DB75 into A15 and (AT)7 hairpin DNA solution at 25 °C, respectively. As with polymeric DNAs, a large positive enthalpy was observed in ITC titration of DB75 into the A15 hairpin and a large negative enthalpy for titration of DB75 into the alternating (AT)7 hairpin. Integration of the peaks followed by normalization for the number of moles of added DB75 and subtraction of the blank heat provides a direct estimate of the binding enthalpy. The average binding enthalpy values are 2.9 kcal/mol for the A15 hairpin and −4.6 kcal/mol for the (AT)7 hairpin (Table 3). Interestingly, these values with the oligomer duplexes, closely match the endothermic and exothermic values for poly(dA)·poly(dT) and poly(dA-dT)·poly(dA-dT) (Table 2). The binding enthalpies for the still shorter A8 and (AT)4 hairpins with DB75, however, decreased relative to the polymers and 15mer hairpin sequences (Supporting Material, Figure S4). The average binding enthalpies are 0.064 kcal/mol for A8 and −6.0 kcal/mol for (AT)4, both substantially more negative than with the longer sequences. These results suggest that the A15 and (AT)7 hairpins are good models to mimic results with longer DNA binding sequences.
Table 3.
SPR determined binding parameters for the interaction of DB75 with A15, (AT)7 and (CG)4 sequences.
| _K_1 (M−1) | _K_2 (M−1) | _K_3 (M−1) | _K_4 (M−1) | _K_meana (M−1) | Δ_G_ (kcal/mole) | Δ_H_b (kcal/mole) | TΔ_S_ (kcal/mole) | |
|---|---|---|---|---|---|---|---|---|
| A15 | 2.99×10⁷ | 2.95×10⁷ | 2.34×10⁶ | 1.91×10⁶ | 1.59×10⁷ | −9.81 | 2.94 | 12.8 |
| (AT)7 | 5.09×10⁷ | 4.61×10⁷ | 3.79×10⁶ | 8.40×10⁵ | 2.54×10⁷ | −10.08 | −4.56 | 5.52 |
| (CG)4 | 2.14×10⁶ | 2.63×10⁵ | — | — | 1.20×10⁶ | — | — | — |
To investigate the sequence dependent binding differences for DB75 in more detail, the corrected binding isotherms for DB75 titrations into the two polymeric DNAs at different temperatures from 5 °C to 50°C were obtained (Supporting Material, Figure S5). Representative ITC titration and integrated heat results for the titration of DB75 into poly(dA)·poly(dT) and poly(dA-dT)·poly(dA-dT) at four different temperatures are plotted in Figure 7. Inspection of Figure S5A reveals that the binding enthalpies for poly(dA)·poly(dT) from 5 °C to 30 °C are strongly temperature dependent and decrease regularly (becoming more exothermic) as the temperature is increased. At temperatures above 30 °C, however, we observed abnormal binding enthalpy drops, indicating that an unusual DNA conformation transition occurred. These drops at higher temperature are clearly DNA–compound ratio dependent. Previous UV melting experiments for poly(dA)·poly(dT) (Figure 2C and Figure S1C in Supporting Material) showed that triplex formation induced by DB75 binding was DNA–compound ratio and temperature dependent. The phase diagram in Figure 2 suggests that we are observing a duplex-triplex transition at higher temperatures as DB75 is added to the duplex DNA.
Fig. 7.

Representative ITC titration and integrated heat data for DB75 binding to poly(dA)·poly(dT) (top) and poly(dA-dT)·poly(dA-dT) (bottom) at 10, 20, 30, 40 °C.
Further inspection of Figure S5B revealed that the binding enthalpies for poly(dA-dT)·poly(dA-dT) at all studied temperatures were negative and their magnitude decreased regularly with increasing temperature from 5 °C to 40 °C. When the temperature was above 45 °C, however, a larger, nonlinear decrease in binding enthalpy was observed. Since the Tm for poly(dA-dT)·poly(dA-dT) itself was around 55 °C (Figure 2A), it is likely that some pre–melted single strand DNA fractions fold back to poly(dA-dT)·poly(dA-dT) duplex on titration of DB75 into DNA solution at higher temperatures. In this case, the observed binding enthalpy is the sum of heat of binding interaction and heat of refolding DNA to give the abnormal large values relative to lower temperature results.
The corrected isotherms for poly(dA)·poly(dT) (from 5 °C to 30 °C) and poly(dA-dT)·poly(dA-dT) (from 5 °C to 40 °C) were fitted with 1:1 binding model to obtain the binding free energy, enthalpy and entropy (Figure 8). Because the free energy values change much less with temperature than the enthalpies, there was significant compensation in the enthalpy and entropy values as can be seen in Figure 8. No curvature in the plots of the thermodynamic constants versus temperature is apparent over the corresponding temperature range and all of the plots were fitted with linear functions. The experimental heat capacity changes for formation of the complexes were obtained from linear fitting of binding enthalpy as a function of temperature (Table 2). The calculated Δ_Cp_ values for DB75 binding are all large and negative: for poly(dA)·poly(dT), −174 ± 7.3 cal mol−1 K−1; for poly(dA-dT)·poly(dA-dT), −127 ± 3.1 cal mol−1 K−1.
Fig. 8.

Complete thermodynamic results for binding of DB75 to poly(dA)·poly(dT) (open) and poly(dA-dT)·poly(dA-dT) (solid) are shown as a function of temperature. Because the free energy changes much less with temperature than the enthalpy, there is significant enthalpy–entropy compensation as can be seen in the Figure. The Δ_C_p values in Table 2 are the slopes of the Δ_H_° plots and no curvature is apparent over this temperature range.
3.5. Biosensor–SPR studies
Because large K values are difficult to determine accurately at the concentrations generally required in diamidine–DNA ITC studies, the DB75–DNA binding constants were also evaluated by biosensor–SPR methods. Since ITC results show that the 15mer hairpins are good mimics for longer DNAs binding with DB75, 5′–Biotin labeled A15, (AT)7 and (CG)4 hairpin sequences (Figure 1) were immobilized on three flow cells of a Biacore sensor chip and the fourth flow cell was left blank for reference subtraction. Sensorgrams for the interaction of A15 and (AT)7 sequences with DB75 are compared in Figure 9 (a). The differences in interaction strength for all three sequences binding with DB75 could be more easily visualized in the plot of r (moles of compound bound/mole of hairpin DNA) versus _C_free, the free compound concentration [Figure 9 (b)]. The data for DB75 binding with A15 and (AT)7 hairpin are best fit with a four–site binding model and the (CG)4 results were well fit using a two–site binding model (Table 3). As expected, DB75 binds strongly to A15 and (AT)7 hairpins with similar interaction strength, but it binds quite weakly to the (CG)4 sequence. From _T_m melting (Figure 2B) and CD titration experiments (Figure 3C and D) of A15 and (AT)7 hairpins binding with DB75, the compound–DNA binding ratio of 4:1 was obtained. These observations are in good agreement with the SPR fitting results, suggesting that one A15 or (AT)7 sequence could bind four DB75 molecules. As described above, the average binding enthalpies for A15 and (AT)7 hairpins have been obtained using the model–free ITC protocol (Table 3). From the experimental binding free energy and enthalpy values, the entropies for A15 and (AT)7 hairpins could be calculated (Table 3).
Fig. 9.
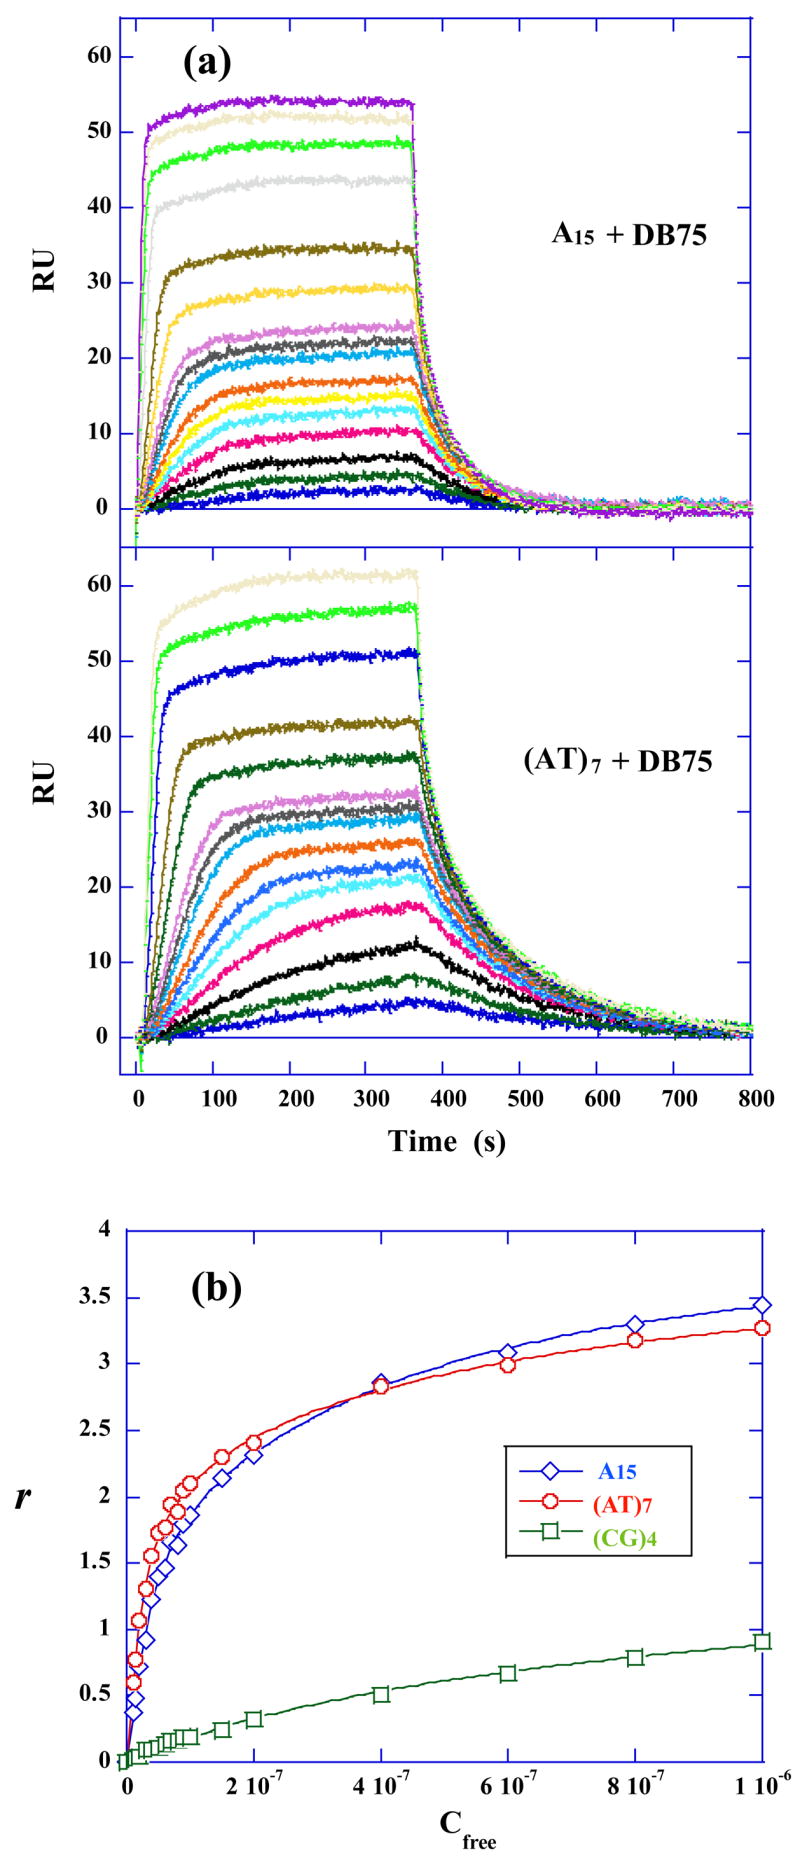
SPR binding affinity: (a) SPR sensorgrams for the interaction of A15 hairpin and (AT)7 hairpin with DB75. The compound concentrations for DB75 from bottom to top are 0 to 1 μM. (b) RU values from the steady–state region of SPR sensorgrams were converted to r (r = RU/_RU_max) and are plotted against the unbound compound concentration (flow solution) for A15 (diamonds), (AT)7 (circles) and (CG)4 (squares) hairpins binding with DB75. The lines are the best fit values using appropriate binding models.
4. Discussion
As described in the introduction, AT site specific minor groove binding diamidines are important for development of new antiparasitic therapeutics and for biotechnology reagents. A prodrug of DB75, for example is in Phase III clinical trials against sleeping sickness[43] and a derivative of DB75 is the basis of a highly sensitive fluorescence assay for trypanosomes resistant to melarsoprol, the primary drug currently used to treat late stage sleeping sickness [44]. These compounds target the AT rich sequences of kDNA minicircles with destruction of the trypanosome kinetoplast and cell death [22].
In spite of extensive studies of diamidines as well as other AT specific minor groove agents, there is little quantitative information on the energetic basis for their ability to distinguish among different sequences in AT binding sites such as those in kDNA. Available results for a small number of AT specific minor groove binding compounds indicate that binding affinities vary quite significantly among different sequences of all AT sites [4]. We have also discovered that similar variations can occur with sequence specific minor groove binding polyamides which recognize mixed sequences of DNA [45, 46]. The polyamides have affinities for their cognate DNA binding sites, for example, that vary by over a factor of 1000. There are few detailed thermodynamic studies of the basis for the different affinities among minor groove binding sites. Given the increasing importance of diamidines as DNA–targeted therapeutics and biotechnology reagents, it is important to establish the variations in thermodynamic quantities that characterize their interactions at different sequence AT binding sites. Since a thermodynamic analysis of DB75 has been previously conducted with d(CGCGAATTCGCG)2 [47] that compound has been used with the alternating and nonalternating DNA sequences of different length in the research reported here to probe the sequence dependent thermodynamics of binding. Since extended AT sequences in parasitic mitochondrial kinetoplast DNA have been shown to be the biological target of diamidines [22], these studies are part of the essential information needed for detailed understanding of the therapeutic activity of DB75 and for design of new drugs.
DB75 and a number of other diamidines have been crystallized with the self–complementary DNA duplex d(CGCGAATTCGCG)2 [48]. The compounds bind in the minor groove at the -AATT- site and the complex is stabilized by H–bonding, van der Waals and electrostatic interactions. The curvature of DB75 lets it slide deeply into the minor groove and the twist of the diamidines allows them to H–bond with terminal T bases in the AATT sequences on opposite strands of the duplex [48]. In agreement with this binding mode, CD studies indicate that DB75 binds in a similar manner to the minor groove of the alternating and nonalternating AT sequences of different length (Figure 3). Melting experiments by UV, CD and DSC methods all show that the alternating and nonalternating AT sites have similar affinities for DB75. Triple–helical dT·dA·dT is not stable under the conditions of these experiments but the melting studies also show that DB75 can induce formation of the triplex in the nonalternating sequence as the ratio of DB75 to duplex is increased. By using competition dialysis and melting experiments, Chaires et al.[30] previously have shown that DB75 is a triplex stabilizing agent.
SPR and ITC experiments confirm that DB75 has similar affinities for the alternating and nonalternating AT sequences, but ITC results illustrate striking differences in DB75 interactions with these two types of sites. At 25 °C, for example, the nonalternating sequence has Δ_H_ = +3.1 kcal/mole while the alternating sequence binds with an exothermic enthalpy of −4.5 kcal/mole. At the same temperature Δ_H_ = −2.2 kcal/mole for the AATT oligomer[47]. The three AT sequences have very similar binding Gibbs energies but they obtain the similar affinities with a large variation in the underlying thermodynamics of binding. Similar results with the AT polymers have been seen with other AT specific minor groove binding compounds such as netropsin [24, 49].
To better understand the thermodynamics for DB75 binding with poly(dA)·poly(dT) and poly(dA-dT)·poly(dA-dT), the observed binding free energy (Δ_G_obs) at 25 °C for DB75 binding to DNA was divided into two primary contributions[50, 51]:
where Δ_G_pe is the electrostatic (polyelectrolyte) contribution, due mainly to coupled polyelectrolyte effects, the most important of which is the release of condensed counterions from the DNA helix upon ligand binding. Δ_G_t is the nonpolyelectrolyte contribution, which arises from all other molecular interaction factors such as hydrophobic contacts, van der Waals forces, H–bonding, etc. The polyelectrolyte term may be calculated using the relationship[52]:
where Z is the charge on the ligand (for DB75, Z is equal to 2 for the two amidines charged, Figure 1), and ϕ is the proportion of total counterions associated with each DNA phosphate (about 0.88 for B–DNA duplex). (M+) is salt concentration. For both polymeric DNAs binding with DB75:
ΔGpe=2∗0.88∗RTln(0.1)=−2.4 kcal mol−1,
and Δ_G_t is −6.9 kcal mol−1 and −6.7 kcal mol−1 respectively for poly(dA)·poly(dT) and poly(dA-dT)·poly(dA-dT).
Similarly, the observed binding enthalpy can be parsed into two contributions:
whereΔ_H_pe is assumed to be essentially zero [53], and Δ_H_t equal to Δ_H_obs. For poly(dA)·poly(dT) binding with DB75, Δ_H_t was obtained as 3.1 kcal mol−1, while for poly(dA-dT)·poly(dA-dT) binding with DB75, Δ_H_t was obtained as −4.5 kcal mol−1. From the binding free energy and enthalpy values determined above, the enthalpy (Δ_S_) of complex formation could be calculated from equation (4):
The obtained thermodynamics parameters are summarized in Table S1. To visualize the differences of thermodynamic forces more easily, the overall thermodynamic profiles for the interaction of poly(dA)·poly(dT) and poly(dA-dT)·poly(dA-dT) with DB75 are compared in Figure 10. As can be seen, DB75 binding to the non–alternating and alternating AT–tracts results in distinctive, sequence dependent, thermodynamic profiles. The minor grove of nonalternating AnTn sequences has been shown to be more narrow than that of alternating (AT)n by solution and x–ray studies [4, 54–57]. The results also show a much more ordered hydration array in AnTn sequences and this feature can explain, at least quantitatively most observations in Figure 10. Displacement of water from AT sites on binding of DB75 results in a positive entropy contribution for both alternating and nonalternating AT sequence. The much larger T_·Δ_S value for AnTn is expected from the more highly ordered water in its minor groove. Release of the minor grove water results in the breaking of a highly favorable H–bonded network with a positive enthalpy, however, DB75–DNA interactions for AnTn do not add enough negative enthalpy to overcome the positive term so that the binding enthalpy is positive until high temperature. The molecular interaction term adds more enthalpy than the breaking of the water network costs for (AT)n binding and the overall enthalpy for binding is exothermic. The release of counterions on binding of the dicationic DB75 also results in a positive entropy contribution, while the bimolecular association adds a negative term. These two values are essentially the same, however, for AnTn and (AT)n and the difference in binding enthalpy for the sequences must be dominated by hydration effects.
Fig. 10.
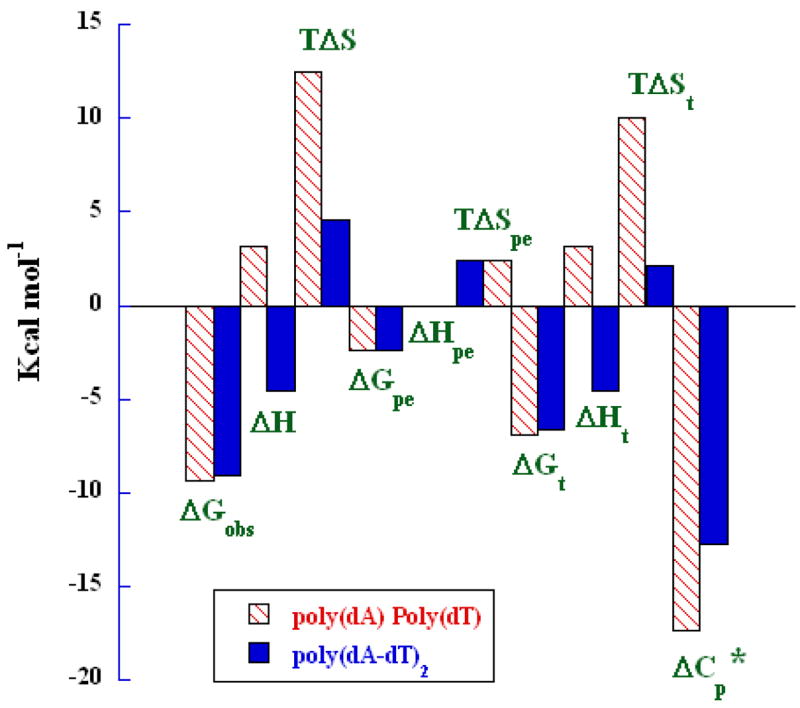
Parsing the free energy (Δ_G_obs) of polymeric DNAs binding with DB75 into the contributor energy terms. The two bars on the right represent Δ_C_p*= Δ_C_p/10 in unit of cal mol−1K−1.
The Δ_C_p value for DB75 binding to both AT polymers is negative in agreement with a binding mechanism involving extensive water release. The Δ_C_p for the alternating polymer is close to the value observed for DB75 binding to the –AATT– site in a duplex oligomer[47]. The value is also close to the predicted value of Δ_C_p based on changes in solvent accessible surface area on binding and calculated from an equation from Chaires and coworkers[36] based on small molecule–DNA experiments. The larger value of Δ_C_p for DB75 binding to poly(dA)·poly(dT) again agrees with a more extensive and highly ordered water network in the minor grove of this polymer. DB75 binding would disrupt the network over a larger region than the binding site and such extended disruption would result in a large experimental binding Δ_C_p.
In summary, unlike minor grove binding, organic cations in general, DB75 has similar binding constants for binding to alternating and nonalternating AT sequences. As shown in Figure 10, however, the thermodynamics underlying the Δ_G_ value for binding are completely different. The differences of Δ_H_, Δ_S_ and Δ_C_p on binding to the two DNAs, can be explained by models that involve differences in amount and order of water release from the minor grove with DB75 binding.
Supplementary Material
01
Figure S1. UV melting profiles at 260nm of A8 hairpin (A), (AT)4 hairpin (B) and poly(dA)·poly(dT) (C) in the absence and presence of DB75 at the indicated increasing molar ratios.
Figure S2. CD titration spectra of the A8 and (AT)4 hairpins binding with DB75 at various mixing ratio. Insertion: increase in CD magnitude at 391nm (∘) and decrease in CD magnitude at 267nm (•).
Figure S3. Temperature–dependent CD spectra of poly(dA)·poly(dT) (left) and poly(dA-dT)·poly(dA-dT) (right) binding with DB75 at compound–DNA ratio of 0, 0.25 and 0.5. Measurements were taken at the indicated temperatures.
Figure S4. ITC curves for the binding of DB75 to the A8 (A) and (AT)7 (B) hairpins in MES10 at 25 °C. Every peak represented the instrument response for each injection during the course of the titration (top). Binding isotherm resulted from integration with respect to time, with appropriate dilution correction (bottom). A ‘model–free ITC’ protocol was used to obtain multiple estimates of Δ_H_.
Figure S5. ITC binding isotherms obtained for the interaction of DB75 with poly(dA)·poly(dT) (top) and poly(dA-dT)·poly(dA-dT) (bottom) as a function of indicated temperature.
Table S1. Parsing the free energy (Δ_G_obs) of polymeric DNAs binding with DB75 into the contributor energy terms.
Acknowledgments
Research was supported by National Institutes of Health (GM61587 and AL46365 to WDW and DWB) and the Georgia Research Alliance.
Abbreviations used
ITC
isothermal titration microcalorimetry
DSC
differential scanning calorimetry
SPR
surface plasmon resonance
CD
circular dichroism
Tm
thermal melting
kDNA
kinetoplast DNA
MES
2-(N-morpholino) ethanesulfonic acid
RU
response units
Footnotes
Publisher's Disclaimer: This is a PDF file of an unedited manuscript that has been accepted for publication. As a service to our customers we are providing this early version of the manuscript. The manuscript will undergo copyediting, typesetting, and review of the resulting proof before it is published in its final citable form. Please note that during the production process errors may be discovered which could affect the content, and all legal disclaimers that apply to the journal pertain.
References
- 1.Hampshire AJ, Rusling DA, Broughton-Head VJ, Fox KR. Footprinting: A method for determining the sequence selectivity, affinity and kinetics of DNA-binding ligands. Methods. 2007;42:128–140. doi: 10.1016/j.ymeth.2007.01.002. [DOI] [PubMed] [Google Scholar]
- 2.Bailly C, Chaires JB. Sequence-specific DNA minor groove binders. Design and synthesis of netropsin and distamycin analogues. Bioconjug Chem. 1998;9:513–538. doi: 10.1021/bc980008m. [DOI] [PubMed] [Google Scholar]
- 3.Weston SA, Lahm A, Suck D. X-ray structure of the DNase I-d(GGTATACC)2 complex at 2.3 A resolution. J Mol Biol. 1992;226:1237–1256. doi: 10.1016/0022-2836(92)91064-v. [DOI] [PubMed] [Google Scholar]
- 4.Abu-Daya A, Brown PM, Fox KR. DNA sequence preferences of several AT-selective minor groove binding ligands. Nucleic Acids Res. 1995;23:3385–3392. doi: 10.1093/nar/23.17.3385. [DOI] [PMC free article] [PubMed] [Google Scholar]
- 5.Abu-Daya A, Fox KR. Interaction of minor groove binding ligands with long AT tracts. Nucleic Acids Res. 1997;25:4962–4969. doi: 10.1093/nar/25.24.4962. [DOI] [PMC free article] [PubMed] [Google Scholar]
- 6.Zimmer C. Effects of the antibiotics netropsin and distamycin A on the structure and function of nucleic acids. Prog Nucleic Acid Res Mol Biol. 1975;15:285–318. doi: 10.1016/s0079-6603(08)60122-1. [DOI] [PubMed] [Google Scholar]
- 7.Zimmer C, Marck C, Schneider C, Guschlbauer W. Influence of nucleotide sequence on dA.dT-specific binding of Netropsin to double stranded DNA. Nucleic Acids Res. 1979;6:2831–2837. doi: 10.1093/nar/6.8.2831. [DOI] [PMC free article] [PubMed] [Google Scholar]
- 8.Dervan PB, Burli RW. Sequence-specific DNA recognition by polyamides. Curr Opin Chem Biol. 1999;3:688–693. doi: 10.1016/s1367-5931(99)00027-7. [DOI] [PubMed] [Google Scholar]
- 9.Moravek Z, Neidle S, Schneider B. Protein and drug interactions in the minor groove of DNA. Nucleic Acids Res. 2002;30:1182–1191. doi: 10.1093/nar/30.5.1182. [DOI] [PMC free article] [PubMed] [Google Scholar]
- 10.Neidle S. DNA minor-groove recognition by small molecules. Nat Prod Rep. 2001;18:291–309. doi: 10.1039/a705982e. [DOI] [PubMed] [Google Scholar]
- 11.Reddy BS, Sondhi SM, Lown JW. Synthetic DNA minor groove-binding drugs. Pharmacol Ther. 1999;84:1–111. doi: 10.1016/s0163-7258(99)00021-2. [DOI] [PubMed] [Google Scholar]
- 12.Wemmer DE, Dervan PB. Targeting the minor groove of DNA. Curr Opin Struct Biol. 1997;7:355–361. doi: 10.1016/s0959-440x(97)80051-6. [DOI] [PubMed] [Google Scholar]
- 13.Bailly C, Waring MJ. Use of DNA molecules substituted with unnatural nucleotides to probe specific drug-DNA interactions. Methods Enzymol. 2001;340:485–502. doi: 10.1016/s0076-6879(01)40438-1. [DOI] [PubMed] [Google Scholar]
- 14.Breusegem SY, Clegg RM, Loontiens FG. Base-sequence specificity of Hoechst 33258 and DAPI binding to five (A/T)4 DNA sites with kinetic evidence for more than one high-affinity Hoechst 33258-AATT complex. J Mol Biol. 2002;315:1049–1061. doi: 10.1006/jmbi.2001.5301. [DOI] [PubMed] [Google Scholar]
- 15.Hud NV, Polak M. DNA-cation interactions: The major and minor grooves are flexible ionophores. Curr Opin Struct Biol. 2001;11:293–301. doi: 10.1016/s0959-440x(00)00205-0. [DOI] [PubMed] [Google Scholar]
- 16.Johansson E, Parkinson G, Neidle S. A new crystal form for the dodecamer C-G-C-G-A-A-T-T-C-G-C-G: symmetry effects on sequence-dependent DNA structure. J Mol Biol. 2000;300:551–561. doi: 10.1006/jmbi.2000.3907. [DOI] [PubMed] [Google Scholar]
- 17.Woods KK, Maehigashi T, Howerton SB, Sines CC, Tannenbaum S, Williams LD. High-resolution structure of an extended A-tract: [d(CGCAAATTTGCG)]2. J Am Chem Soc. 2004;126:15330–15331. doi: 10.1021/ja045207x. [DOI] [PubMed] [Google Scholar]
- 18.Hud NV, Plavec J. A unified model for the origin of DNA sequence-directed curvature. Biopolymers. 2003;69:144–158. doi: 10.1002/bip.10364. [DOI] [PubMed] [Google Scholar]
- 19.Tidwell RRBDW. In: DNA and RNA Binders: from Small Molecules to Drugs. Demeunynck M, Bailly C, Wilson WD, editors. Wiley-VCH; 2003. pp. 414–460. [Google Scholar]
- 20.Mathis AM, Bridges AS, Ismail MA, Kumar A, Francesconi I, Anbazhagan M, Hu Q, Tanious FA, Wenzler T, Saulter J, Wilson WD, Brun R, Boykin DW, Tidwell RR, Hall JE. Diphenyl furans and Aza Analogs: Effects of structural modification on in vitro activity, DNA binding, and accumulation and distribution in trypanosomes. Antimicrob Agents Chemother. 2007;51:000. doi: 10.1128/AAC.00005-07. [DOI] [PMC free article] [PubMed] [Google Scholar]
- 21.Boykin DW. Antimicrobial activity of the DNA minor groove binders furamidine and analogs. J Braz Chem Soc. 2002;13:763–771. [Google Scholar]
- 22.Wilson WD, Nguyen B, Tanious FA, Mathis A, Hall JE, Stephens CE, Boykin DW. Dications that target the DNA minor groove: compound design and preparation, DNA interactions, cellular distribution and biological activity. Curr Med Chem Anticancer Agents. 2005;5:389–408. doi: 10.2174/1568011054222319. [DOI] [PubMed] [Google Scholar]
- 23.Cui T, Wei S, Brew K, Leng F. Energetics of binding the mammalian high mobility group protein HMGA2 to poly(dA-dT)2 and poly(dA)-poly(dT) J Mol Biol. 2005;352:629–645. doi: 10.1016/j.jmb.2005.07.048. [DOI] [PubMed] [Google Scholar]
- 24.Marky LA, Breslauer KJ. Origins of netropsin binding affinity and specificity: correlations of thermodynamic and structural data. Proc Natl Acad Sci USA. 1987;84:4359–4363. doi: 10.1073/pnas.84.13.4359. [DOI] [PMC free article] [PubMed] [Google Scholar]
- 25.Shi X, Macgregor RB., Jr Temperature dependence of the volumetric parameters of drug binding to poly[d(A-T)].Poly[d(A-T)] and Poly(dA).Poly(dT) Biophys J. 2006;90:1729–1738. doi: 10.1529/biophysj.105.066258. [DOI] [PMC free article] [PubMed] [Google Scholar]
- 26.Liu B, Liu Y, Motyka SA, Agbo EE, Englund PT. Fellowship of the rings: the replication of kinetoplast DNA. Trends Parasitol. 2005;21:363–369. doi: 10.1016/j.pt.2005.06.008. [DOI] [PubMed] [Google Scholar]
- 27.Lukes J, Guilbride DL, Votypka J, Zikova A, Benne R, Englund PT. Kinetoplast DNA network: evolution of an improbable structure. Eukaryot Cell. 2002;1:495–502. doi: 10.1128/EC.1.4.495-502.2002. [DOI] [PMC free article] [PubMed] [Google Scholar]
- 28.Shapiro TA, Englund PT. The structure and replication of kinetoplast DNA. Annu Rev Microbiol. 1995;49:117–143. doi: 10.1146/annurev.mi.49.100195.001001. [DOI] [PubMed] [Google Scholar]
- 29.Hong M, Simpson L. Genomic organization of Trypanosoma brucei kinetoplast DNA minicircles. Protist. 2003;154:265–279. doi: 10.1078/143446103322166554. [DOI] [PubMed] [Google Scholar]
- 30.Chaires JB, Ren J, Hamelberg D, Kumar A, Pandya V, Boykin DW, Wilson WD. Structural selectivity of aromatic diamidines. J Med Chem. 2004;47:5729–5742. doi: 10.1021/jm049491e. [DOI] [PubMed] [Google Scholar]
- 31.Das BP, Boykin DW. Synthesis and antiprotozoal activity of 2,5-bis(4-guanylphenyl)furans. J Med Chem. 1977;20:531–536. doi: 10.1021/jm00214a014. [DOI] [PubMed] [Google Scholar]
- 32.Brandts JF, Lin LN. Study of strong to ultratight protein interactions using differential scanning calorimetry. Biochemistry. 1990;29:6927–6940. doi: 10.1021/bi00481a024. [DOI] [PubMed] [Google Scholar]
- 33.Breslauer KJ. Extracting thermodynamic data from equilibrium melting curves for oligonucleotide order-disorder transitions. Methods Enzymol. 1995;259:221–242. doi: 10.1016/0076-6879(95)59046-3. [DOI] [PubMed] [Google Scholar]
- 34.Leng F, Priebe W, Chaires JB. Ultratight DNA binding of a new bisintercalating anthracycline antibiotic. Biochemistry. 1998;37:1743–1753. doi: 10.1021/bi9720742. [DOI] [PubMed] [Google Scholar]
- 35.Barcelo F, Capo D, Portugal J. Thermodynamic characterization of the multivalent binding of chartreusin to DNA. Nucleic Acids Res. 2002;30:4567–4573. doi: 10.1093/nar/gkf558. [DOI] [PMC free article] [PubMed] [Google Scholar]
- 36.Ren J, Jenkins TC, Chaires JB. Energetics of DNA intercalation reactions. Biochemistry. 2000;39:8439–8447. doi: 10.1021/bi000474a. [DOI] [PubMed] [Google Scholar]
- 37.Nguyen B, Tanious FA, Wilson WD. Biosensor-surface plasmon resonance: Quantitative analysis of small molecule-nucleic acid interactions. Methods. 2007;42:150–161. doi: 10.1016/j.ymeth.2006.09.009. [DOI] [PubMed] [Google Scholar]
- 38.Davis TM, Wilson WD. Determination of the refractive index increments of small molecules for correction of surface plasmon resonance data. Anal Biochem. 2000;284:348–353. doi: 10.1006/abio.2000.4726. [DOI] [PubMed] [Google Scholar]
- 39.Lane AN, Jenkins TC, Brown T, Neidle S. Interaction of berenil with the EcoRI dodecamer d(CGCGAATTCGCG)2 in solution studied by NMR. Biochemistry. 1991;30:1372–1385. doi: 10.1021/bi00219a030. [DOI] [PubMed] [Google Scholar]
- 40.Malin ABN, Tomas K. In: Circular Dichroism. Nina B, Koji N, Robert W, editors. Wiley-VCH; 2000. pp. 741–768. [Google Scholar]
- 41.Breslauer KJ, Remeta DP, Chou WY, Ferrante R, Curry J, Zaunczkowski D, Snyder JG, Marky LA. Enthalpy-entropy compensations in drug-DNA binding studies. Proc Natl Acad Sci USA. 1987;84:8922–8926. doi: 10.1073/pnas.84.24.8922. [DOI] [PMC free article] [PubMed] [Google Scholar]
- 42.Chaires JB. Energetics of drug-DNA interactions. Biopolymers. 1997;44:201–215. doi: 10.1002/(SICI)1097-0282(1997)44:3<201::AID-BIP2>3.0.CO;2-Z. [DOI] [PubMed] [Google Scholar]
- 43.Midgley I, Fitzpatrick K, Taylor LM, Houchen TL, Henderson SJ, Wright SJ, Cybulski ZR, John BA, McBurney A, Boykin DW, Trendler KL. Pharmacokinetics and metabolism of the prodrug DB289 (2,5-bis[4-(N-methoxyamidino)phenyl]furan monomaleate) in rat and monkey and its conversion to the antiprotozoal/antifungal drug DB75 (2,5-bis(4-guanylphenyl)furan dihydrochloride) Drug Metab Dispos. 2007;35:955–967. doi: 10.1124/dmd.106.013391. [DOI] [PubMed] [Google Scholar]
- 44.Stewart ML, Krishna S, Burchmore RJ, Brun R, de Koning HP, Boykin DW, Tidwell RR, Hall JE, Barrett MP. Detection of arsenical drug resistance in Trypanosoma brucei with a simple fluorescence test. Lancet. 2005;366:486–487. doi: 10.1016/S0140-6736(05)66793-1. [DOI] [PubMed] [Google Scholar]
- 45.Buchmueller KL, Staples AM, Howard CM, Horick SM, Uthe PB, Le NM, Cox KK, Nguyen B, Pacheco KA, Wilson WD, Lee M. Extending the language of DNA molecular recognition by polyamides: unexpected influence of imidazole and pyrrole arrangement on binding affinity and specificity. J Am Chem Soc. 2005;127:742–750. doi: 10.1021/ja044359p. [DOI] [PubMed] [Google Scholar]
- 46.Lacy ER, Le NM, Price CA, Lee M, Wilson WD. Influence of a terminal formamido group on the sequence recognition of DNA by polyamides. J Am Chem Soc. 2002;124:2153–2163. doi: 10.1021/ja016154b. [DOI] [PubMed] [Google Scholar]
- 47.Mazur S, Tanious FA, Ding D, Kumar A, Boykin DW, Simpson IJ, Neidle S, Wilson WD. A thermodynamic and structural analysis of DNA minor-groove complex formation. J Mol Biol. 2000;300:321–337. doi: 10.1006/jmbi.2000.3869. [DOI] [PubMed] [Google Scholar]
- 48.Nunn CM, Neidle S. Sequence-dependent drug binding to the minor groove of DNA: crystal structure of the DNA dodecamer d(CGCAAATTTGCG)2 complexed with propamidine. J Med Chem. 1995;38:2317–2325. doi: 10.1021/jm00013a008. [DOI] [PubMed] [Google Scholar]
- 49.Lah J, Vesnaver G. Energetic diversity of DNA minor-groove recognition by small molecules displayed through some model ligand-DNA systems. J Mol Biol. 2004;342:73–89. doi: 10.1016/j.jmb.2004.07.005. [DOI] [PubMed] [Google Scholar]
- 50.Chaires JB. Dissecting the free energy of drug binding to DNA. Anticancer Drug Des. 1996;11:569–580. [PubMed] [Google Scholar]
- 51.Haq I. Thermodynamics of drug-DNA interactions. Arch Biochem Biophys. 2002;403:1–15. doi: 10.1016/S0003-9861(02)00202-3. [DOI] [PubMed] [Google Scholar]
- 52.Record MT, Jr, Anderson CF, Lohman TM. Thermodynamic analysis of ion effects on the binding and conformational equilibria of proteins and nucleic acids: the roles of ion association or release, screening, and ion effects on water activity. Q Rev Biophys. 1978;11:103–178. doi: 10.1017/s003358350000202x. [DOI] [PubMed] [Google Scholar]
- 53.Patel MM, Anchordoquy TJ. Contribution of hydrophobicity to thermodynamics of ligand-DNA binding and DNA collapse. Biophys J. 2005;88:2089–2103. doi: 10.1529/biophysj.104.052100. [DOI] [PMC free article] [PubMed] [Google Scholar]
- 54.Berman HM. Crystal studies of B-DNA: the answers and the questions. Biopolymers. 1997;44:23–44. doi: 10.1002/(SICI)1097-0282(1997)44:1<23::AID-BIP3>3.0.CO;2-1. [DOI] [PubMed] [Google Scholar]
- 55.Olsen GL, Louie EA, Drobny GP, Sigurdsson ST. Determination of DNA minor groove width in distamycin-DNA complexes by solid-state NMR. Nucleic acids Res. 2003;31:5084–5089. doi: 10.1093/nar/gkg720. [DOI] [PMC free article] [PubMed] [Google Scholar]
- 56.Fox KR. Probing the conformations of eight cloned DNA dodecamers; CGCGAATTCGCG, CGCGTTAACGCG, CGCGTATACGCG, CGCGATATCGCG, CGCAAATTTGCG, CGCTTTAAAGCG, CGCGGATCCGCG and CGCGGTACCGCG. Nucleic acids Res. 1992;20:6487–6493. doi: 10.1093/nar/20.24.6487. [DOI] [PMC free article] [PubMed] [Google Scholar]
- 57.Bailly C, Mollegaard NE, Nielsen PE, Waring MJ. The influence of the 2-amino group of guanine on DNA conformation. Uranyl and DNase I probing of inosine/diaminopurine substituted DNA. The EMBO J. 1995;14:2121–2131. doi: 10.1002/j.1460-2075.1995.tb07204.x. [DOI] [PMC free article] [PubMed] [Google Scholar]
Associated Data
This section collects any data citations, data availability statements, or supplementary materials included in this article.
Supplementary Materials
01
Figure S1. UV melting profiles at 260nm of A8 hairpin (A), (AT)4 hairpin (B) and poly(dA)·poly(dT) (C) in the absence and presence of DB75 at the indicated increasing molar ratios.
Figure S2. CD titration spectra of the A8 and (AT)4 hairpins binding with DB75 at various mixing ratio. Insertion: increase in CD magnitude at 391nm (∘) and decrease in CD magnitude at 267nm (•).
Figure S3. Temperature–dependent CD spectra of poly(dA)·poly(dT) (left) and poly(dA-dT)·poly(dA-dT) (right) binding with DB75 at compound–DNA ratio of 0, 0.25 and 0.5. Measurements were taken at the indicated temperatures.
Figure S4. ITC curves for the binding of DB75 to the A8 (A) and (AT)7 (B) hairpins in MES10 at 25 °C. Every peak represented the instrument response for each injection during the course of the titration (top). Binding isotherm resulted from integration with respect to time, with appropriate dilution correction (bottom). A ‘model–free ITC’ protocol was used to obtain multiple estimates of Δ_H_.
Figure S5. ITC binding isotherms obtained for the interaction of DB75 with poly(dA)·poly(dT) (top) and poly(dA-dT)·poly(dA-dT) (bottom) as a function of indicated temperature.
Table S1. Parsing the free energy (Δ_G_obs) of polymeric DNAs binding with DB75 into the contributor energy terms.