DBTSS: database of transcription start sites, progress report 2008 (original) (raw)
Abstract
DBTSS is a database of transcriptional start sites, based on our unique collection of precise, experimentally determined 5′-end sequences of full-length cDNAs. Since its first release in 2002, several major updates have been made. In this update, we expanded the human transcriptional start site dataset by 19 million uniquely mapped, and RefSeq-associated, 5′-end sequences, which were generated by a newly introduced Solexa sequencer. Moreover, in order to provide means for interpreting those massive TSS data, we implemented two new analytical tools: one for connecting expression information with predicted transcription factor binding sites; the other for examining evolutionary conservation or species-specificity of promoters and transcripts, which can be browsed by our own comparative genome viewer. With the expanded dataset and the enhanced functionalities, DBTSS provides a unique platform that enables in-depth transcriptome analyses. DBTSS is accessible at http://dbtss.hgc.jp/.
INTRODUCTION
One of the most challenging subjects of the genome science in the post-genome-sequencing era is to understand the transcriptional regulatory networks, by which the timing and quantity of transcriptions are collectively controlled. To eventually decode the genome information into a macromolecular system of the cell, in-depth knowledge of its higher-order regulatory mechanisms should be indispensable (1,2). It is also expected that detailed evolutionary comparisons of transcriptional networks would explain molecular mechanisms underlying the phenotypic divergence and speciation (3). Therefore, the identification and analyses of promoters, where most of the binding sites of transcription factors are contained, are essential. To define promoter regions, positional information about transcriptional start sites (TSSs) is the first clue (4).
In order to provide the precise information of TSSs, we launched DBTSS in 2002 (5). DBTSS contains the TSS information determined with our experiments. The 5′-end sequences of full-length cDNA clones isolated from libraries, which are mainly constructed by the oligo-capping method and are enriched in full-length cDNAs, are mapped on to genome sequences. Each TSS is determined as a genomic position to which the 5′-end of some full-length cDNAs is corresponded (6). Since the initial release of DBTSS, we have made several updates, including the expansion of the data amount as well as the covered species, the addition of the information of so-called alternative promoters (7), and the implementation of an analytical tool, which enables the promoter sequence comparison between human and mouse. In this article, we introduce new updates and additions since DBTSS 2006, the most important one being the addition of TSS information which has been massively produced by a new-generation sequencer.
Newly developed, massively parallel sequencing technologies, such as GS20 and Solexa sequencer systems, have enabled to determine millions of sequences in a single run (8). We recently accommodated our full-length cDNA technique, the oligo-capping method, for the Solexa sequencers (detailed protocol will be published elsewhere). Utilizing the extremely high-throughput Solexa sequencer, we generated 19-million TSS information and incorporated it into DBTSS. At the same time, we also considered that, in order to maximally extract biological information from this size of TSS data, the implementation of powerful analytical tools should be essential. Therefore, in this update, together with the expansion of the TSS data, we put two analytical tools into service; the first for correlating expression information with promoter elements; the second for examining the evolutionary conservation or species-specificity of promoters and transcripts, which can be browsed by a dynamic and flexible comparative genome browser. Both of these new functionalities are closely related with the Solexa sequence browser and enable the enhanced interpretation of the TSS data.
NEW FEATURES
Incorporation of the TSS data produced by the Solexa sequencer
A major update of the current version of DBTSS, version 6, since the previous report, is that the amount of data for human TSSs has been significantly increased. We recently started to determine the 5′-end sequences of the oligo-capped cDNAs using the Solexa sequencer. Briefly, 5′- and 3′-adaptor sequences necessary for the Solexa sequencing were introduced as a 5′-end-oligo at the RNA ligation and as a random hexamer primer at the first strand cDNA synthesis, respectively. Because of this straightforward procedure, thereby collected data should be improved by its size without degrading its quality. Obtained data were processed as previously described for the classical Sanger sequences with some minor modifications. The genomic positions to which the 5′-ends of the Solexa sequences were mapped were defined as putative TSSs. Clustering by 500 bp bins was also applied to separate putative alternative promoters (7). As a result, 10 000 349 and 8 633 345 sequences were obtained from the MCF7 cells (a human cell line of breast cancer origin; ATCC#HTB-22) and the human embryonic kidney 293 cells (HEK293; ATCC#CRL-1573), respectively, which were uniquely mapped to the RefSeq mRNA regions of the human genome (hg18). Those sequences collectively represent 29 210 and 41 238 putative (alternative) promoters of 12 133 and 11 598 RefSeq genes in the two cell lines, respectively (Table 1). This is one of the largest collections of human TSS information collected from a single cell type (9).
Table 1.
Statistics of the datasets produced by the Solexa sequencer (upper two rows) and by the original Sanger sequencer (bottom row) in humans. TSSs which were supported by equal or greater than five sequences were counted for the Solexa datasets
| Total no. of mapped sequences | No. of sequences associated with NMs | No. represented NMs | Total no. of putative promoters | |
|---|---|---|---|---|
| MCF7 (Solexa) | 11 919 330 | 10 000 349 | 12 133 | 29 210 |
| HEK293 (Solexa) | 10 062 560 | 8 633 345 | 11 598 | 41 238 |
| CDNA (Sanger, total) | 1 540 411 | 1 370 985 | 15 194 | 32 122 |
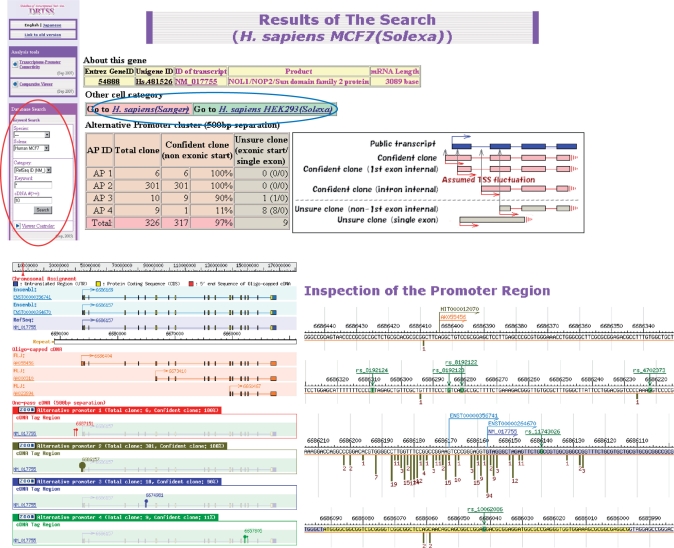
The Solexa data can be retrieved in parallel with the original Sanger data (Figure 1). In other words, we did not mix the new TSS information from the Solexa data with the original dataset so that the in-depth transcriptome analysis focusing on a single cell type is possible, while the previous data representing general features of promoters taken from the data of various cell types and tissues, could be preserved. Otherwise, the clustering and the representations of the promoters in the original dataset could be severely biased because of the size of the new data.
Figure 1.
Screenshot from the Solexa sequence viewer. Its basic utility is similar to that of the previous version (5). Users can choose the database to search, either Sanger or Solexa dataset, in the left panel and then retrieve the results (red circle). Users can also switch the browsers between the Sanger and Solexa results (blue circle).
Connecting expression information with promoter elements
In order to further investigate the biological significance or the underlying regulatory mechanisms of the observed TSSs, the information on the changes of expression levels invoked by various environmental stimulations would provide important clues. For this purpose, at least before the expression information produced by the Solexa and the GS20 sequencers [where millions of collected sequences are subjected to the SAGE-like analysis; see (10)] will be accumulated to some sufficient level, hitherto compiled microarray data are conveniently available. In particular, for MCF 7, there is a series of microarray data, which was recently produced by the Connectivity Map project, representing the expression profiles of this particular cell on the administrations of over 200 kinds of drugs in several time courses (11).
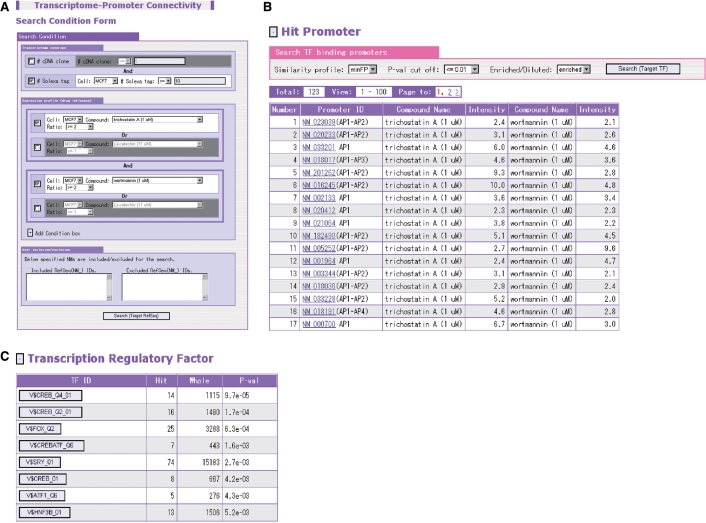
In addition to the incorporation of the MCF7 expression data, we implemented an analytical tool. This analytical tool looks for putative transcription factor binding sites commonly occurring in the promoters, which show similar behaviors on various drug perturbations. It is assumed that those promoters should be under the regulations of similar transcription factors, thus, containing particular transcription factor binding sites in common. As shown in Figure 2, as for the user-specified group of promoters or promoters which satisfy some specified search conditions on the expression profiles, transcription factor binding sites are predicted by the matrix search of the TRANFAC database (12) under any cut-off values. The degree of enrichment of the predicted transcription factor binding sites is evaluated assuming the hypergeometric distributions. Thereby, the enriched binding sites are listed and users can further retrieve the information regarding in which promoters and in which part of them these sites are located. Although the MCF7 dataset is currently the only resource of the expression data, we will further expand the dataset to cover expression profiles in various cell types and conditions. Moreover, further increases in the amount of the Solexa data for TSS determination themselves will enrich the source of expression information. Such data will directly couple the positional information within promoters with the changes of expression levels, as the latter should be represented by the number of allocated sequences.
Figure 2.
Screenshot from the search engine for enrichment of the putative transcription factor binding sites (A). The figure exemplifies the search for common TF binding sites appearing in the promoters of genes with which more than 10 Solexa sequences are associated and the relative expression levels are more than 2-fold elevated both by the 1 μm trichostatin A treatment and by the 1 μm wortmannin treatment (B). From the resultant list of the enriched sites, the link can be followed to the main viewer to retrieve further detailed information (C).
Evolutionary conservation of promoters and their downstream transcripts
Another approach to infer the biological relevance of the TSSs is to examine the details of their evolutionary conservation or turnovers in both their upstream promoters and downstream transcribed regions. Recently, it has become clear that some of the (alternative) promoters are well conserved, while others are rapidly evolving (13). Whether the non-conserved (alternative) promoters are the noise of transcription or actually playing species-specific roles still remains elusive. However, further ways for investigating those (alternative) promoters should be different from the first step, depending on whether they are associated with conserved, possibly principal, biological roles or species-specific phenotypic features.
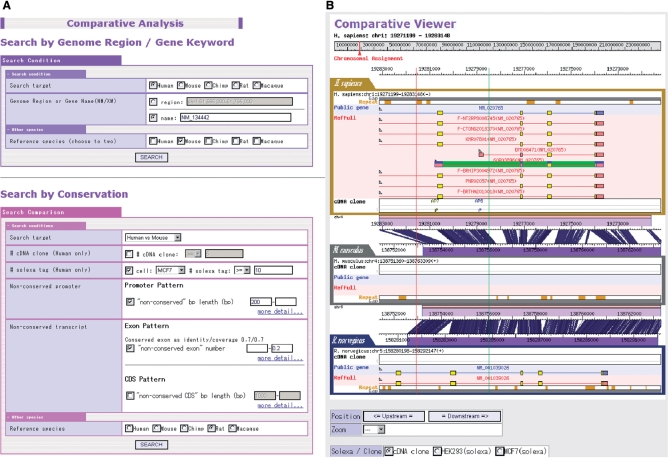
As shown in Figure 3, our new comparative browser enables users to examine evolutionary conservation of the surrounding regions of TSSs, based on the genomic sequences of various kinds of mammals, such as mice, rats and monkeys, as well as their mutual base-pair alignments from the UCSC Genome Browser (14). Furthermore, users can search for the promoters or transcripts according to the degree of evolutionary conservation, using variable parameters, including the coverage of alignable regions and the base substitution rate therein. Further detailed searches focusing on limited regions of the transcripts, such as UTRs, CDSs or the ‘coding exons’ are also supported. These results are browsed with our new comparative browser, which provides the dynamic magnification from the sequence level to the overview level. This viewer currently supports up to four-way comparisons between four genomes of user's choice.
Figure 3.
Screenshot from the search engine for the evolutionary conservation of the promoters and transcripts (A). The figure exemplifies the results of the search for promoters for which more than 10 Solexa sequences are associated, the alignable region in the promoters in human–mouse comparison is <300 bp and the overall base substitution of the downstream transcript region is <20% (B). The regions specified between red (one selection) and green (second selection) vertical lines (or one left click) can be magnified up to the sequence level.
FUTURE PERSPECTIVE
We will continue Solexa sequencing in various tissues with various environmental conditions, by which not only TSS data but also expression data will be increased further. We will also take a similar approach for model organisms other than humans. Their relevant data will be incorporated into DBTSS and made publicly available. Especially, in many organisms, their cDNA resources still remain scarce, while the genome sequences are being hastily released. Our massive transcriptome data will be most helpful not only for determining TSSs and upstream promoters but also for putting accurate annotations for the compiled genome sequences. DBTSS, with expanded data and supported by several new analytical tools, provides a unique platform for enabling in-depth analyses of transcriptomes. We believe DBTSS will serve as a firm foundation leading us into deeper insights on how the transcriptional regulatory network is realized by the code of genomic DNA sequences.
ACKNOWLEDGEMENTS
We thank Katsuyuki Tsuritani, Kazumi Abe and Kiyomi Imamura for their excellent works in sequencing generation and processing. We are also thankful to Nicolas Sierro and Fah Sathirapongsasuti for critically reading the article. This work was supported by a Grant-in-Aid for Scientific Research on Priority Areas and by special coordination funds for promoting science and technology (SCF), both from the Ministry of Education, Culture, Sports, Science and Technology in Japan (MEXT). Computation time was provided by the Super Computer System, Human Genome Center, Institute of Medical Science, University of Tokyo. Funding to pay the Open Access publication charges for this article was provided by MEXT.
Conflict of interest statement. None declared.
REFERENCES
- 1.Birney E., Stamatoyannopoulos J.A., Dutta A., Guigo R., Gingeras T.R., Margulies E.H., Weng Z., Snyder M., Dermitzakis E.T., et al. Identification and analysis of functional elements in 1% of the human genome by the ENCODE pilot project. Nature. 2007;447:799–816. doi: 10.1038/nature05874. [DOI] [PMC free article] [PubMed] [Google Scholar]
- 2.Maston G.A., Evans S.K., Green M.R. Transcriptional regulatory elements in the human genome. Annu. Rev. Genomics Hum. Genet. 2006;7:29–59. doi: 10.1146/annurev.genom.7.080505.115623. [DOI] [PubMed] [Google Scholar]
- 3.Prabhakar S., Noonan J.P., Paabo S., Rubin E.M. Accelerated evolution of conserved noncoding sequences in humans. Science. 2006;314:786. doi: 10.1126/science.1130738. [DOI] [PubMed] [Google Scholar]
- 4.Suzuki Y., Tsunoda T., Sese J., Taira H., Mizushima-Sugano J., Hata H., Ota T., Isogai T., Tanaka T., et al. Identification and characterization of the potential promoter regions of 1031 kinds of human genes. Genome Res. 2001;11:677–684. doi: 10.1101/gr.164001. [DOI] [PMC free article] [PubMed] [Google Scholar]
- 5.Yamashita R., Suzuki Y., Wakaguri H., Tsuritani K., Nakai K., Sugano S. DBTSS: database of human transcription start sites, progress report 2006. Nucleic Acids Res. 2006;34:D86–D89. doi: 10.1093/nar/gkj129. [DOI] [PMC free article] [PubMed] [Google Scholar]
- 6.Suzuki Y., Sugano S. Construction of a full-length enriched and a 5′-end enriched cDNA library using the oligo-capping method. Methods Mol. Biol. 2003;221:73–91. doi: 10.1385/1-59259-359-3:73. [DOI] [PubMed] [Google Scholar]
- 7.Kimura K., Wakamatsu A., Suzuki Y., Ota T., Nishikawa T., Yamashita R., Yamamoto J., Sekine M., Tsuritani K., et al. Diversification of transcriptional modulation: large-scale identification and characterization of putative alternative promoters of human genes. Genome Res. 2006;16:55–65. doi: 10.1101/gr.4039406. [DOI] [PMC free article] [PubMed] [Google Scholar]
- 8.Bentley D.R. Whole-genome re-sequencing. Curr. Opin. Genet. Dev. 2006;16:545–552. doi: 10.1016/j.gde.2006.10.009. [DOI] [PubMed] [Google Scholar]
- 9.Carninci P., Kasukawa T., Katayama S., Gough J., Frith M.C., Maeda N., Oyama R., Ravasi T., Lenhard B., et al. The transcriptional landscape of the mammalian genome. Science. 2005;309:1559–1563. doi: 10.1126/science.1112014. [DOI] [PubMed] [Google Scholar]
- 10.Emrich S.J., Barbazuk W.B., Li L., Schnable P.S. Gene discovery and annotation using LCM-454 transcriptome sequencing. Genome Res. 2007;17:69–73. doi: 10.1101/gr.5145806. [DOI] [PMC free article] [PubMed] [Google Scholar]
- 11.Lamb J., Crawford E.D., Peck D., Modell J.W., Blat I.C., Wrobel M.J., Lerner J., Brunet J.P., Subramanian A., et al. The connectivity map: using gene-expression signatures to connect small molecules, genes, and disease. Science. 2006;313:1929–1935. doi: 10.1126/science.1132939. [DOI] [PubMed] [Google Scholar]
- 12.Matys V., Kel-Margoulis O.V., Fricke E., Liebich I., Land S., Barre-Dirrie A., Reuter I., Chekmenev D., Krull M., et al. TRANSFAC and its module TRANSCompel: transcriptional gene regulation in eukaryotes. Nucleic Acids Res. 2006;34:D108–D110. doi: 10.1093/nar/gkj143. [DOI] [PMC free article] [PubMed] [Google Scholar]
- 13.Tsuritani K., Irie T., Yamashita R., Sakakibara Y., Wakaguri H., Kanai A., Mizushima-Sugano J., Sugano S., et al. Distinct class of putative ‘non-conserved’ promoters in humans: comparative studies of alternative promoters of human and mouse genes. Genome Res. 2007;17:1005–1014. doi: 10.1101/gr.6030107. [DOI] [PMC free article] [PubMed] [Google Scholar]
- 14.Kuhn R.M., Karolchik D., Zweig A.S., Trumbower H., Thomas D.J., Thakkapallayil A., Sugnet C.W., Stanke M., Smith K.E., et al. The UCSC genome browser database: update 2007. Nucleic Acids Res. 2007;35:D668–D673. doi: 10.1093/nar/gkl928. [DOI] [PMC free article] [PubMed] [Google Scholar]


