The Regulated Expression of miRNAs in Normal and Polycythemia Vera Erythropoiesis (original) (raw)
. Author manuscript; available in PMC: 2009 Jun 19.
Abstract
Objective
Polycythemia vera (PV) is a myeloproliferative disorder, arising from the acquired mutation(s) of a hematopoietic stem cell. The JAK2 V617F somatic mutation is found in most PV patients; however, it is not the disease-initiating mutation. Since microRNAs (miRNAs) play a regulatory role in hematopoiesis, we studied miRNA expressions in PV and normal erythropoiesis.
Methods
The peripheral blood mononuclear cells were cultured in a three-phase liquid system resulting in synchronized expansion of erythroid progenitors. Using gene expression profiling by CombiMatrix MicroRNArray, we searched for PV specific changes at day1, 14 and 21. Twelve miRNA candidates were then reevaluated by quantitative RealTime PCR in a larger number of samples obtained from progenitors at the same stage of differentiation.
Results
A significant difference of miR-150 expression was found in PV. In normal erythropoiesis, three expression patterns of miRNAs were observed: progressive down-regulation of miR-150, miR-155, miR-221, miR-222; up-regulation of miR-451, miR-16 at late stages of erythropoiesis; and biphasic regulation of miR-339, miR-378. The miR-451 appears to be erythroid specific.
Conclusions
We identified the miRNAs with regulated expression in erythropoiesis; one appeared to be PV specific. Their miRNA expression levels define early, intermediate, and late stages of erythroid differentiation. The validity of our findings was confirmed in non-expanded peripheral blood cells.
Keywords: miRNA expression, erythroid differentiation, polycythemia vera
Introduction
Polycythemia vera (PV) is a myeloproliferative disorder, arising from a somatic mutation(s) of a single hematopoietic stem cell leading to clonal hematopoiesis. A somatic JAK2 V617F point mutation is found in over 90% of PV patients; however, it is not the disease initiating mutation, since a) some PV patients are JAK2 V617F negative [1]; b) this mutation is also seen in the other acquired disorders [2]; c) there are rare families with multiple PV subjects wherein some PV relatives have, while others do not have, the JAK2 V617F mutation [3]; d) analysis of clonal PV populations reveals the presence of <50 and >50% mutated JAK2 V617F cells, indicating a mixed population of cells with regard to JAK2 V617F status [4, 5]; and e) some erythropoietin (Epo) independent colonies - a hallmark of PV - are JAK2 V617F negative, although most are homozygous for this mutation. Exaggerated erythropoiesis is the principal feature of PV. To search for pre-JAK2 V617F somatic or germ line PV mutations, we focused on microRNAs and studied their expression in differentiating erythroid progenitors (EP).
MicroRNAs (miRNAs) are non-coding RNAs of 18-22nts that mediate posttranscriptional gene repression by inhibiting protein translation or by destabilizing target mRNA through cleavage or deadenylation [6]. There is growing evidence that miRNAs regulate mammalian hematopoiesis and that some miRNAs are specific for the hematopoietic lineages [7, 8]. Several miRNAs appear differentially regulated during T-cell development [9]. The down-modulation of miR-221 and miR-222 was reported in in vitro cord blood erythropoietic differentiating CD34+ cells and this paralleled with increased c-Kit expression correlating with the expansion of early erythroblasts [10]. It has also been demonstrated that miR-155 controls both myeloid and erythroid differentiation [8]. Expression profiles of miRNAs associated with early erythroid commitment (miR-32, miR-136, miR-137) and maturation (miR-22, miR-28, miR-185) of in vitro erythroid cultures of cord blood were reported [11].
Using in vitro culture system, we studied miRNA expressions of normal and PV erythroid progenitors during differentiation by arrays. To validate our array data, we performed selective miRNA analyses from a larger number of PV and control samples by quantitative RealTime Polymerase Chain Reaction (qRT-PCR). Further, we also analyzed expression of the miRNAs from peripheral blood CD34+, mononuclear cells (MNCs), granulocytes, reticulocytes and platelets that were not exposed to artificial in vitro culture conditions.
Materials and Methods
Samples and in vitro erythroid expansion
Peripheral blood was obtained from 13 PV patients (11/13 JAK2 V617F positive) and 8 healthy donors with local IRB approved informed consent. All PV patients fulfilled Polycythemia Vera Study Group clinical criteria. In addition, all patients had low erythropoietin levels and erythropoietin independent colonies, and all informative females had clonal hematopoiesis [12]. Quantitative analysis of the JAK2 V617F mutation was performed as described [13]. MNCs and granulocytes were isolated by Ficoll-Paque (Sigma) gradient centrifugation. Positive selection of CD34+ cells was performed using a MACS CD34+ kit (Miltenyi Biotec) according to the manufacturers' instructions. The blood used for preparation of reticulocyte RNA was washed 3 times with 0.9% NaCl and erythrocytes were lysed. 1/10 volume of 1.5M sucrose+0.15M KCl (mixture 1:1) was added to the supernatant and centrifuged at 12800g for 10min at 4°C. Supernatant was decanted and the pH adjusted to 5.1 with 10% acetic acid. The RNA was collected by centrifugation at 12800g for 20min at 4°C. This method yields a high purity of erythroid specific mRNAs [14].
For in vitro erythroid expansion, peripheral blood MNCs (PB-MNCs) were cultured over 21 days in a three-phase liquid assay (days 1-7 100ng/ml SCF,100ng/ml Tpo,100ng/ml Flt3-L; days 8-14 50ng/ml SCF, 50ng/ml IGF, 3U/ml Epo; days 15-21 50ng/ml IGF, 3U/ml Epo) as described [13]. The cells were collected on the 1st, 7th, 9th, 11th, 14th, 16th, 19th and 21st days. At each time point the cells were evaluated for differentiation stage, morphology, cell growth and viability. Differentiation stages were monitored throughout culture by flow cytometry (FACScan Analyzer, Becton Dickinson) using double immunostaining with CD71 and CD235a antibodies (BD Pharmingen) as described [15]. For cell morphology analyses, cytospin preparations (200,000 cells/slide) were stained with Wright-Giemsa stain (Sigma). Cell number/viability was determined using CellometerAutoT4 (Nexcelom Bioscience) based on the trypan blue exclusion method.
Expression analyses
Total RNA was isolated by TriReagent (MRC). The control samples from day21 were pooled because of RNA amount limitation (PV1 was under RNA limit). CombiMatrix MicroRNA CustomArray 4×2K slides (#3257) with 326 miRNA probes were used for gene expression profiling. Labeling and hybridization were performed as described [16]. The slides were scanned with Genepix 4000B Scanner (Axon) and raw pixel intensities were extracted with CombiMatrix Microarray Imager (4×2K) software. The median signal from all the mismatch probes was set to background. The probe signals that were >1.5 times background signal were considered as “present”. The expression data were normalized by the global median method. The data were analyzed by Genesis software (http://genome.tugraz.at). The one-way ANOVA analysis was applied to microarray data to determine differentially expressed miRNAs during erythropoiesis with statistical significance of P<0.01. Expression of selected miRNAs was validated by qRT-PCR. Putative targets of the miRNAs were predicted by algorithms TargetScan 3.1, miRBase Targets v.4 and PicTar.
Gene expression of the miRNAs was determined at each time point using TaqMan MicroRNA Expression Assays (Applied Biosystems) according to the manufacture's protocol. Gene expression was calculated based on generation of standard curve derived from the serial dilutions of PCR product of specific miRNA. The optimal threshold was selected automatically from regression parameters (r2>0.99) of the standard curve. The miRNA expression levels were normalized to an endogenous control RNAU6B (Applied Biosystems). The relative gene expression is expressed in arbitrary units (AU).
Results
In vitro expansion of erythroid cells derived from PB-MNCs
Although the starting MNC population represents a heterogeneous population, the expanded EPs were virtually all erythroid cells with a homogeneous differentiation pattern (Figure 1)[15]. The day1 cell population included mostly lymphoid cells, but at day7 and on the ensuing days of culture, the erythroid cells became dominant. Immunological characterization of the cells showed significant CD71 expression at day7. Thereafter CD71 expression on expanded cells continued to increase up to day11, followed by a gradual decrease at later stages of EP differentiation. At day7, the expression of erythroid specific antigen glycophorin A (CD235a) appeared and its expression gradually increased to day21. Erythroid differentiation was morphologically evident at day7, and from day9 the cells were exclusively erythroid. At day14, basophilic erythroblasts represented the dominant population. At day16, the cells were basophilic and polychromatophilic erythroblasts. At day19, the expanded cells further differentiated into a mixture of polychromatophilic erythroblasts and normoblasts. At day21, the majority of the cells were late normoblasts and a few were reticulocytes [15]. In general, CD71/235a expression and morphology patterns of our expanded cells agreed with Neildez-Nguyen et al, although our protocol of EP expansion differed in several aspects [17].
Figure 1. Induction of erythroid differentiation from peripheral blood MNCs.
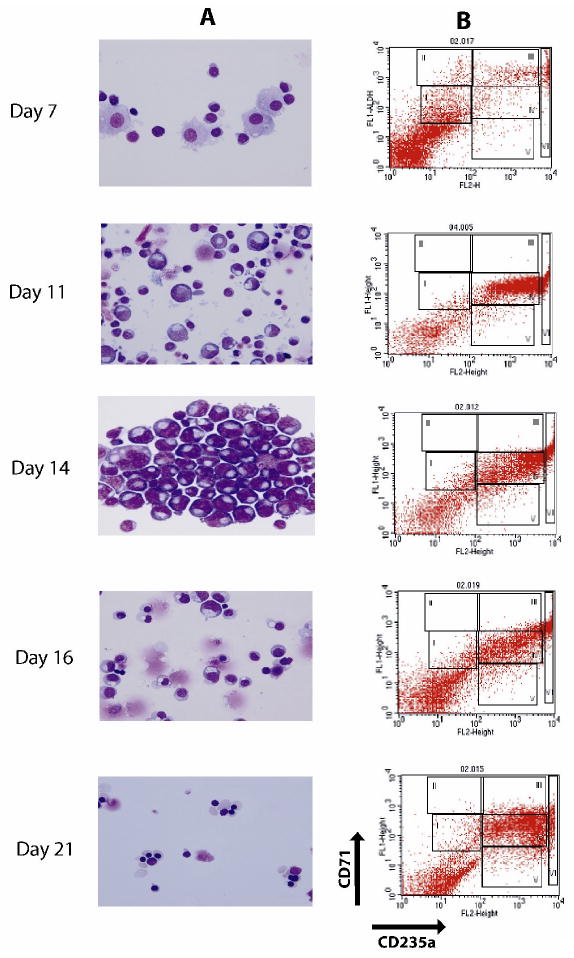
A) Morphology analysis of Wright-Giemsa stained cells at selected days (magnification 100×). The representative populations are shown: day7 – immature early erythroid progenitors, day11 - proerythroblasts and basophilic erythroblasts, day14 - mostly basophilic erythroblasts, day16 - basophilic and polychromatophilic erythroblasts, day21 – late normoblasts and some reticulocytes; B) Flow cytometry analysis of surface antigens, CD71 and CD235a, on expanded cells at different stages of differentiation. The cells were immunostained with (FITC)-conjugated anti-CD71 and (PE)-conjugated anti-CD235a antibodies. In the plot, X- and Y-axes indicate the relative fluorescence of PE and FITC, respectively. The gated regions define characteristic expression patterns of the surface antigens: CD71med and CD235alow (R1), - CD71high and CD235alow (R2), - CD71high and CD235ahigh (R3), - CD71med and CD235ahigh (R4), - CD71low and CD235ahigh (R5).
Expression analyses of miRNAs during erythroid differentiation
To identify potential dysregulation of miRNAs in in vitro expanded EPs, we initially performed genomewide array profiling by CombiMatrix slides from 3 PV patients and 3 controls from days1, 14 and 21 of culture. Comparative analyses of control and PV EPs suggested increased levels of miR-451, miR-16, miR-21 and miR-26b and decreased levels of miR-150 and miR-221 in PV group (Figure 2).
Figure 2. Expression of the differentially regulated miRNAs during erythroid differentiation.
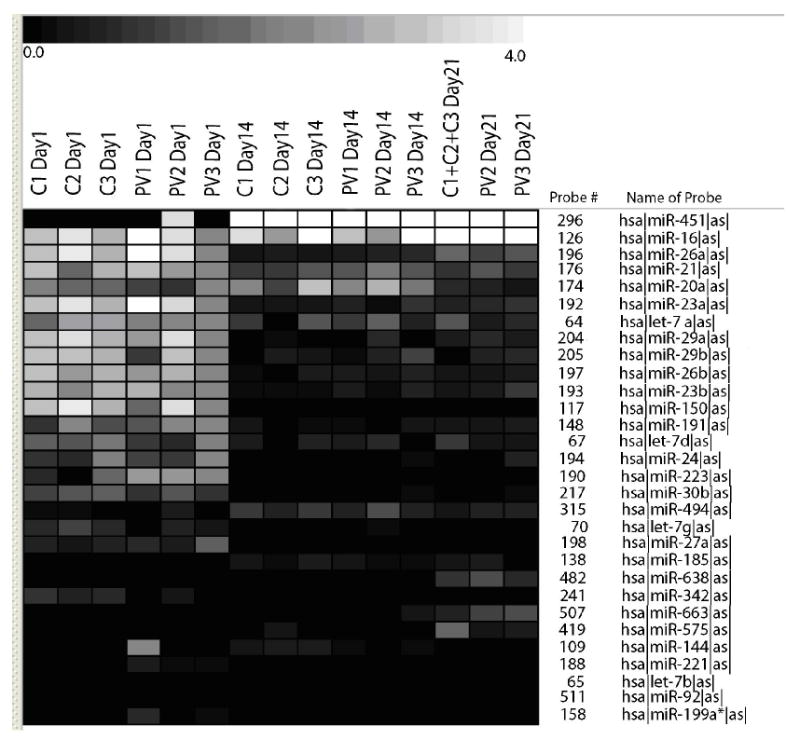
The one-way ANOVA analysis (P<0.01) selected 30 miRNAs which were differentially expressed between the 3 groups (Day1 versus Day14 versus Day21). The control samples from day21 were pooled because of limited amount of RNA. The relative gene expressions are expressed by a gradient intensity of color, as shown in the grey scale at the top. The darkest color indicates no expression and the lightest color indicates maximal expression. C-control, PV- polycythemia vera patient.
We then set up to validate the potential differential expression of these miRNAs by qRT-PCR in 13 PV and 8 control subjects. In addition, gene expression of the miRNAs was studied at more time points of differentiation (days 1, 7, 9, 11, 14, 16, 19 and 21) and in non-expanded peripheral blood cells (i.e. CD34+, MNCs, granulocytes, reticulocytes and platelets).
In these analyses, the level of miRNA at day7, when erythroid differentiation occurs, was used for comparison to other days in this section.
PV specific difference in miRNA expression
miR-150
Expression of miR-150 progressively declined with erythroid differentiation, its expression decreased 9-fold (P<0.05) from day7 to 11. We observed its lower level in the PV group at most points of analyses, but only at days11 and 21 there were significant differences (P<0.05) (day9: P=0.08) between PV and control EPs (Figure 4A).
Figure 4. Gene expression patterns of the miRNAs depicting decreased levels during erythroid differentiation.
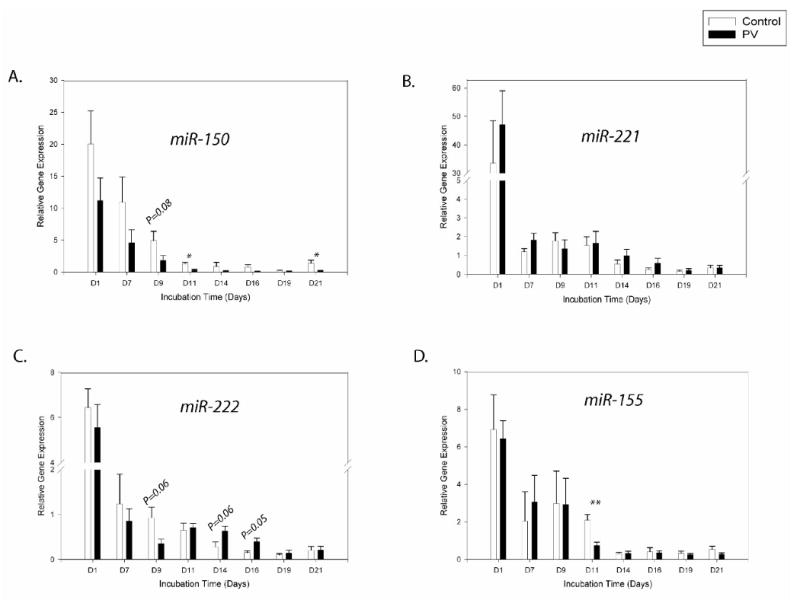
Gene expression was determined by qRT-PCR at the defined time points. Relative gene expression was calculated based on generation of standard curve and normalized against the endogenous control RNAU6B. The plotted data (arbitrary units) express as mean with standard error. Statistical significance between control and PV cells was calculated by t-test at each time point (*P<0.05, **P<0.01). Control - healthy controls, PV- polycythemia vera patients, D – day.
These miR-150 expression data were verified in freshly prepared cells. The reduced miR-150 expression was found in reticulocytes and its expression was even lower in PV reticulocytes (P<0.05). Low miR-150 expression was also present in granulocytes, but PV patients had similar expression as controls in these cells. There were higher levels of miR-150 in CD34+, MNCs and platelets compared to granulocytes and reticulocytes (Figure 6C).
Figure 6. Expression levels of the miRNAs in non-expanded peripheral blood cells from controls and PV patients.
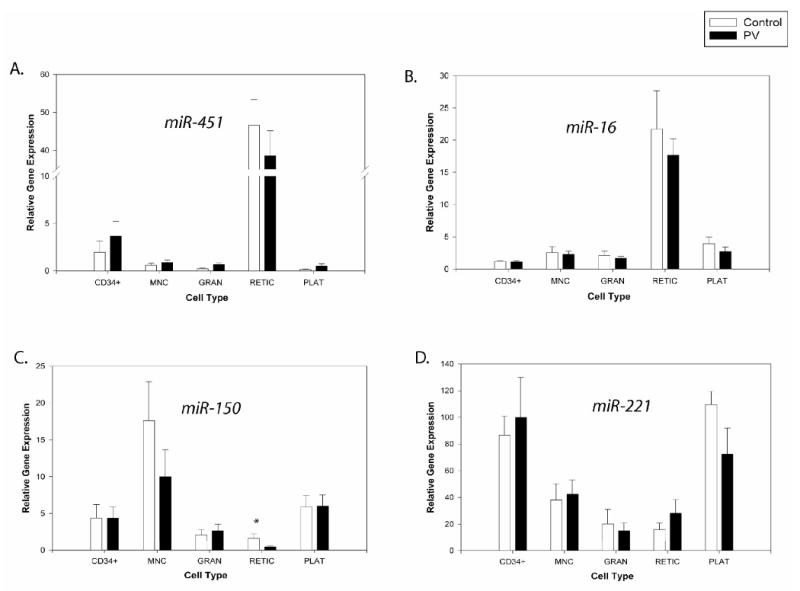
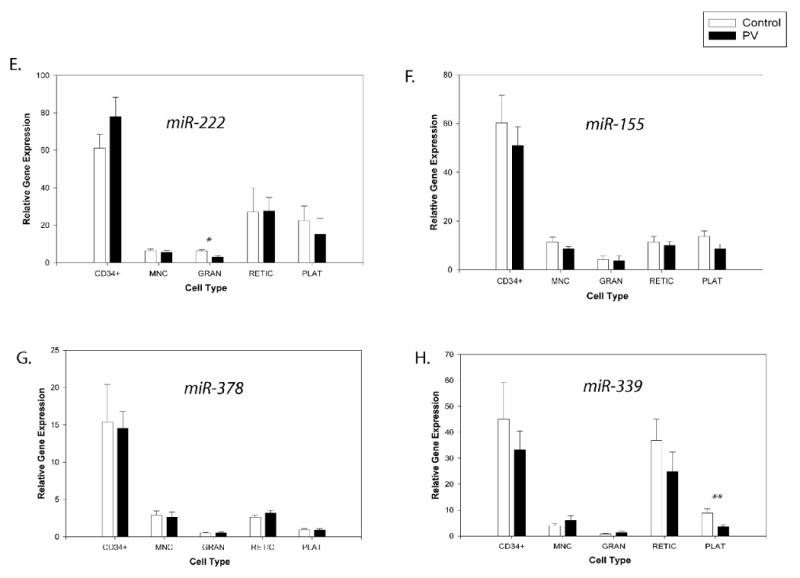
Gene expression was determined by qRT-PCR. Relative gene expression was calculated based on generation of standard curve and normalized against the endogenous control RNAU6B. The plotted data (arbitrary units) express as mean with standard error. Statistical significance between control and PV cells was calculated by t-test in each cell lineage (*P<0.05, **P<0.01). Control - healthy controls, PV - polycythemia vera patients, MNC - mononuclear cells, GRAN - granulocytes, RETIC - reticulocytes, PLAT - platelets.
miRNA expression during normal erythropoiesis
miR-451
The expression analyses of EP expanded cells revealed the highest expression of miR-451 at late stages of differentiation in both normal and PV samples (Figure 3A). From day7 up to day14, miR-451 expression increased ∼3-fold (P<0.01), and then it increased ∼ 35-fold by day21 (P<0.01). Further, we found higher expression (P<0.05) of miR-451 in PV samples compared to controls at the starting points at day7 as well as day9. Analyses of the differentiation stage by FACS revealed accelerated differentiation of PV EPs at these time points. By day11 (when Epo was present), both PV samples and controls were no longer asynchronous as reflected by expression of CD71/CD235a and morphological evaluations [15].
Figure 3. Gene expression patterns of the miRNAs depicting increased levels during erythroid differentiation.
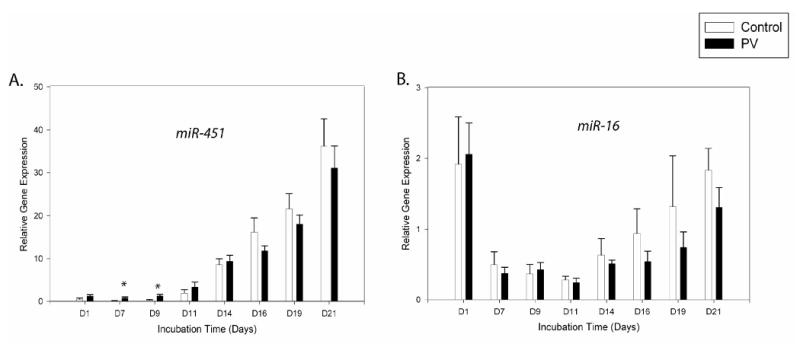
Gene expression was determined by qRT-PCR at the defined time points. Relative gene expression was calculated based on generation of standard curve and normalized against the endogenous control RNAU6B. The plotted data (arbitrary units) express as mean with standard error. Statistical significance between control and PV cells was calculated by t-test at each time point (*P<0.05, **P<0.01). Control - healthy controls, PV- polycythemia vera patients, D – day.
We then examined whether miR-451 expression is specific for erythroid cells in vivo. In native cells, we detected a significantly increased expression of miR-451 (∼40-fold) in peripheral blood reticulocytes compared to the other blood cell lineages (Figure 6A).
miR-16
Expression of miR-16 from day7 to 11 was relatively constant; however, from day14 there was a gradual increase of its level up to day21 of culture (∼3-fold)(P<0.05)(Figure 3B). In analyses of circulating blood cells, we observed miR-16 overexpression in reticulocytes compared to the other blood cells (Figure 6B).
miR-221
We observed gradually decreasing expression of miR-221 from day11 to day21 (∼5-fold)(P<0.01)(Figure 4B). However, in freshly isolated peripheral blood cells we found higher miR-221 expression in both normal and PV CD34+ and platelets, while its level was lower in reticulocytes, MNCs, and granulocytes (Figure 6D).
miR-21, miR-26b
We could not confirm possible PV specific array-detected increased levels of miR-21 and miR-26b in the larger set of samples by qRT-PCR. Expressions of the miRNAs oscillated along the EP expansion at similar levels in both controls and PV patients (data not shown).
Expression of putative miRNAs which may control erythropoiesis regulators
Erythroid differentiation is orchestrated at the molecular level by a complex of regulatory factors including cytokines and receptors (i.e. Epo, EpoR), as well as transcription factors (i.e. Gata-1, Stat5). Using the TargetScan algorithm we predicted potential miRNAs that may target the major regulators of erythropoiesis. Combining our microarray data and published data with our prediction we selected several miRNAs (miR-27a, miR-140, miR-149, miR-378, miR-155, miR-339 and miR-222) and their expression patterns during erythroid differentiation were tested by qRT-PCR.
miR-27a (potential targets-STAT-5, GATA-2)
miR-27a did not show any significant changes during EP differentiation (data not shown).
miR-140 (potential targets–EPO, EPOR, GATA-1, STAT-5)
Level of miR-140 was non significantly increased from day11 up to day21 (data not shown).
miR-149 (potential targets-GATA-1, STAT-5)
Expression of miR-149 was present at low level throughout culture and only at day21 showed an increased level but with a high variation within tested samples (data not shown).
miR-222 (potential target-c-Kit) [10]
miR-222 showed similar expression pattern during in vitro EP expansion as miR-221. There was down-regulation from day7 up to day19 (∼4-fold)(P<0.05)(Figure 4C). In circulating blood cells, the highest level of miR-222 was found in CD34+ cells. Platelets and reticulocytes had higher levels of miR-222 compared to MNCs and granulocytes (Figure 6E).
miR-155 (potential targets-CXCR4,JUN,GATA-3)[8]
miR-155 expression was progressively down-regulated from day9 to day14 (∼5-fold)(P<0.05) and then its level remained low (Figure 4D). There was significant difference (P<0.01) between controls and PV at day11. In native cells, we detected similar expression of miR-155 in most tested cell types with the exception of CD34+ that had a higher level (Figure 6F).
miR-378 (potential target-EPOR)
We detected up-regulation of miR-378 from day9 up to day14 (P<0.05) followed by its gradual decrease up to day19 (P<0.05) and then up-regulation at day21 (Figure 5A). Its levels in peripheral blood lineages are shown in Figure 6G.
Figure 5. Gene expression patterns of the miRNAs depicting biphasic regulation during erythroid differentiation.
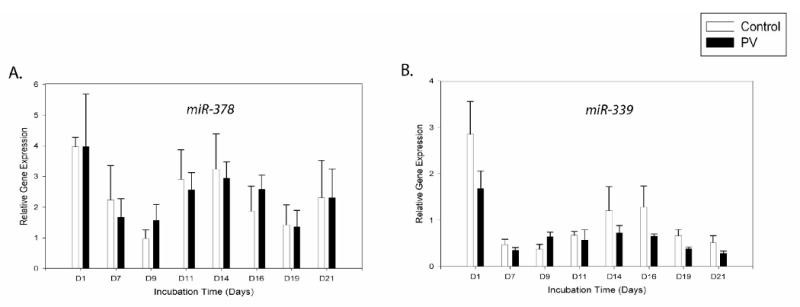
Gene expression was determined by qRT-PCR at the defined time points. Relative gene expression was calculated based on generation of standard curve and normalized against the endogenous control RNAU6B. The plotted data (arbitrary units) express as mean with standard error. Statistical significance between control and PV cells was calculated by t-test at each time point (*P<0.05, **P<0.01). Control - healthy controls, PV- polycythemia vera patients, D – day.
miR-339 (potential targets - EPOR and STAT-5)
Level of miR-339 increased from day9 with the highest expression at day14 (P<0.01) and 16 followed by a gradual decrease to day21 (Figure 5B). During the third week, miR-339 expression was lower in the PV group, but it did not achieve statistical significance. In native cells, we observed higher levels of miR-339 in CD34+ cells and reticulocytes compared to other cell types. There was significantly lower expression of miR-339 in PV platelets (P<0.01) (Figure 6H).
Discussion
There is a growing recognition of an important role of miRNAs in regulation of hematopoiesis. We hypothesized that dysregulation of miRNA expression may precede the somatic mutation JAK2 V617F in the genesis of PV. In order to accomplish this objective, we developed a method that expands the erythroid progenitors from an easily obtainable small amount of peripheral blood and harvests the erythroid cells at different stages of their differentiation. Initial microarray assays suggested possible dysregulated miRNAs; those miRNAs were analyzed in detail at consecutive times of their differentiation stages using qRT-PCR. These data were then compared to the levels of these miRNAs in peripheral blood cells from PV patients and healthy donors. We report that the expression of only one miRNA significantly differs between PV and controls; that of the miR-150. Additionally, miRNA-451 was expressed at higher level in early PV progenitors but at that differentiation stage PV progenitors were also differentiating faster than normal EPs.
PV specific difference in miRNA expression
Our in vitro and in vivo analyses revealed significantly decreased expression of miR-150 in PV erythroid cells. In in vitro system miR-150 showed marked down-regulation with progressive EP differentiation. At all tested time points we observed its lower expression in PV samples. The native PV reticulocytes also had significantly decreased expression of miR-150. This PV specific down-regulation suggests possible involvement of miR-150 in PV pathogenesis and additional functional studies should answer this hypothesis. A high level of miR-150 expression has been reported in mature B and T cells [18] which is consistent with our data since miR-150 was detected at a high level in MNCs (mostly lymphoid cells) compared to other cell types. Zhou et al also showed increased expression of miR-150 during B and T cell maturation [18], while its down-regulation was detected along the in vitro megakaryocytic differentiation [7]. All these findings suggest a role of miR-150 in lineage specific hematopoietic differentiation.
Expression of miRNAs in normal erythropoiesis
Other miRNAs were differentially expressed at the different points of erythroid differentiation but their levels were similar in PV and controls. Based on qRT-PCR data we could classify the miRNAs into four groups: (i) those with increasing levels during erythroid differentiation: miR-451, miR-16, miR-140 and miR-149; (ii) those with decreasing levels during erythroid differentiation: miR-155, miR-221 and miR-222; (iii) those with biphasic regulation during erythroid differentiation: miR-339 and miR-378; (iv) those with moderate changes during erythroid differentiation: miR-21, miR-26b and miR-27a (Table 1).
Table 1. Putative targets of tested miRNAs predicted using TargetScan, miRBase and PicTar prediction algorithms.
| miRNA ID* | Chromosomal location | Regulation along EP expansion | Putative targets□ |
|---|---|---|---|
| hsa-miR-451 | 17q11.2 | up | OSR1,NSMAF,SGIP1,EEF1E1,PMM2,BMP-7 |
| hsa-miR-16 | 13q14.3 | up | FGF2,BCL2, CCND2,LUZP1,CCNE1,ARL2 |
| hsa-miR-150 | 19q13.33 | down | MYB,ZFP91,ELK1,EPHB2,SMARCD1 |
| hsa-miR-155 | 21q21 | down | ZNF537,BACH1, PICALM,FBXO11,MYB |
| hsa-miR-221 | Xp11.3 | down | cKIT,TCF12,NAP1L5,CDKN1B,RAP1B,ETS1 |
| hsa-miR-222 | Xp11.3 | down | RIMS3,cKIT,CDKN1B,NAP1L5,HECTD2 |
| hsa-miR-339 | 7p22.3 | biphasic | GRM3, SCN3A,BCL6,CUGBP2,TFAP4,PAK6 |
| hsa-miR-378 | 5q32 | biphasic | BCL11B,NEBL,E2F3,TAZ,FLJ33814 |
| hsa-miR-21 | 17q23.2 | non | PLAG1,PURB, PDCD4,STAT3,CCL1 |
| hsa-miR-26b | 2q35 | non | NHS,E2F7,HSHIN1,SLC25A16,AK1,CCND2 |
| hsa-miR-27a | 19p13.12 | non | RANBP2L1,PLK2,BTG2,SEMA6A,EDRF1 |
(i) miRNAs with increasing levels during erythroid differentiation
miR-451
Expression of miR-451 rapidly increased during erythroid maturation and at the last point of our analysis we detected ∼35-fold increase compared to its level at day7. The same overexpression was observed in native reticulocytes from PV patients and controls. Rathjen et al also found high expression of miR-451 in erythrocytes; however these investigators did not detect any expression in the progenitor stages of any blood lineages by Northern blot method [19]. Using the more sensitive method of qRT-PCR we detected low levels of miR-451 expression in tested native cells including CD34+ progenitors with the exception of reticulocytes. It suggests that miR-451 represents specific erythroid miRNA and may regulate erythroid differentiation and/or maturation. This hypothesis may be also supported by our observation of higher miR-451 expression in PV samples at early stages of culture, possibly reflecting the presence of Epo-independent erythroid progenitors.
miR-16
Expression of miR-16 increased from day11 up to day21 of our analysis. miR-16 is normally expressed in most of the hematopoietic cell lines [20, 21]. It is located on chromosome 13q14 which is deleted in > 50% of CLL [22] and miR-16 down-regulation is associated with up-regulation of anti-apoptotic B-cell leukemia/lymphoma 2 protein (Bcl2) [23]. Our data are in keeping with the notion that the terminal differentiation of erythroid progenitors requires an active apoptotic pathway that is essential for the productive erythropoiesis and generation of enucleated cells [24, 25]. This is consistent with our analyses of the cells at the third week of culture when cells undergo terminal differentiation. This suggests that miR-16 up-regulation may have pro-apoptotic effect through Bcl2. miR-16 has been suggested to regulate differentiation of later progenitor cells [8] and Choong et al showed correlation of miR-16 expression with increase of erythroid surface antigens (i.e. CD235a) [11].
(ii) miRNAs with decreasing levels during erythroid differentiation
miR-155
In this study miR-155 expression progressively decreased from day9 onwards. It has been reported that miR-155 negatively regulates myelopoiesis and erythropoiesis since _miR-155_-transduced human CD34+ progenitors formed fewer colonies than controls [7]. Our results may support the prediction that miR-155 represents a potential inhibitor of hematopoietic differentiation and its down-regulation is associated with erythroid maturation. In disease states, miR-155 overexpression has been described in B cell lymphomas [26] and in the solid tumors [27].
miR-221 and miR-222
miR-221 and miR-222 had similar down-regulation patterns from day11 along the differentiation. This is consistent with the hypothesis that these miRNAs may inhibit erythropoiesis and their down-regulation is necessary for promotion of erythroid differentiation [8, 10].
We also detected high levels of miR-221, miR-222 and miR-155 in native CD34+ cells. Their expression was reported in both PB and bone marrow CD34+ cells [8].
iii) miRNAs with biphasic levels during erythroid differentiation
miR-339
We detected two miRNAs with biphasic pattern during erythroid differentiation. miR-339 had the highest level at day14 and then its expression gradually declined. There was a trend in PV cells for a lower level at the third week of culture. Down-regulation of miR-339 and miR-150 was observed during in vitro CD34+ megakaryocytic differentiation [7].
miR-378
Based on in silico analysis, miR-378 is the highest scored miRNA which may target EPOR gene. Scicchitano et al tested EPOR expression during in vitro expansion of human cord blood EPs (at days 4, 7 and 15) and found a decreased level at day15 [28]. Our expression data are consistent with this report as we detected the highest level of EPOR mRNA at day14 with its subsequent down-regulation (data not shown). However, the miR-378 expression profile does not match the profile of EPOR transcript suggesting that this miRNA does not regulate EPOR at the mRNA level. These data, however, can not rule out EPOR regulation by translation repression.
(iv) miRNAs with moderate changes during erythroid differentiation
This group includes miR-21, miR-26b and miR-27a whose expressions oscillated along the in vitro EP expansion at similar levels in both controls and PV patients.
Overexpression of miR-21 has been demonstrated in various cancer types and is associated with malignant cell growth [27, 29]. miR-26b has been reported to belong to hematopoietic miRNAs [8].
In silico search for target genes of studied miRNAs
Putative targets of the regulated miRNAs during EP expansion were predicted by three target prediction softwares (Table 1). Computational prediction suggested several targets for miR-451 which was highly expressed in late stage erythroid cells. Bone morphogenetic protein-7 (BMP-7) gene is the only putative target associated with hematopoiesis. However, it was described that Bmp-7 may increase granulocyte/monocyte colony formation but not erythroid colony formation [30]. Potential target of miR-16 is BCL2 gene. We have evaluated mRNA levels of BCL2 during erythropoiesis (not shown) and it showed negative correlation with miR-16 profile. miR-16 may function at the mRNA regulation level to suppress BCL2 gene expression. miR-150 (decreased in PV cells) is predicted to target cMYB proto-oncogene. This gene plays an important role in erythropoiesis by maintaining proliferation at early stages and it may inhibit terminal erythroid differentiation [31]. Expression of cMYB is also associated with c-KIT expression in erythroid cells [31]. The decline of miR-221/222 expression increases c-Kit protein production leading to expansion of early erythroblasts [10]. We also observed decreasing levels of these miRNAs with progressive differentiation. The role of cMYB in PV pathogenesis is being evaluated. Taken together, these data show that miRNA regulatory mechanism of erythropoiesis will likely be complex and miRNAs may cooperate to regulate gene expression of target genes.
We report expressions of miRNAs in normal and PV cells during erythroid differentiation. A significant decrease of miR-150 was found in PV erythroid progenitors during the intermediate and late stages of differentiation. In both normal and PV erythropoiesis, up-regulation of miR-451, miR-16 and down-regulation of miR-150, miR-221, miR-222 and miR-155 are associated with late stages of erythroid differentiation. Higher levels of miR-339 and miR-378 are associated with intermediate stage of erythropoiesis. Our results suggest that miR-451 may represent erythroid specific miRNA.
It remains to be determined whether gain/loss-of-function of these miRNAs will impair erythropoiesis and if their expression dysregulation or germ line/somatic mutations may be responsible for erythropoiesis defects, such as those seen in congenital and acquired red cell disorders.
Acknowledgments
The study was supported by 1P01CA108671-O1A2 (MPD) Consortium project#1; R01HL50077-11 (PI Prchal) and NR/9236-3 IGA MZD CR.
We thank to Sabina Swierczek,PhD. for analyzing PV subjects and level quantification of JAK2 V617F mutation in their granulocytes.
Footnotes
Conflict of interest statement: No conflicts declared.
Publisher's Disclaimer: This is a PDF file of an unedited manuscript that has been accepted for publication. As a service to our customers we are providing this early version of the manuscript. The manuscript will undergo copyediting, typesetting, and review of the resulting proof before it is published in its final citable form. Please note that during the production process errors may be discovered which could affect the content, and all legal disclaimers that apply to the journal pertain.
References
- 1.Bellucci S, Michiels JJ. The role of JAK2 V617F mutation, spontaneous erythropoiesis and megakaryocytopoiesis, hypersensitive platelets, activated leukocytes, and endothelial cells in the etiology of thrombotic manifestations in polycythemia vera and essential thrombocythemia. Semin Thromb Hemost. 2006;32:381–398. doi: 10.1055/s-2006-942759. [DOI] [PubMed] [Google Scholar]
- 2.Levine RL, Gilliland DG. JAK-2 mutations and their relevance to myeloproliferative disease. Curr Opin Hematol. 2007;14:43–47. doi: 10.1097/00062752-200701000-00009. [DOI] [PubMed] [Google Scholar]
- 3.Rumi E, Passamonti F, Pietra D, et al. JAK2 (V617F) as an acquired somatic mutation and a secondary genetic event associated with disease progression in familial myeloproliferative disorders. Cancer. 2006;107:2206–2211. doi: 10.1002/cncr.22240. [DOI] [PubMed] [Google Scholar]
- 4.Lippert E, Boissinot M, Kralovics R, et al. The JAK2-V617F mutation is frequently present at diagnosis in patients with essential thrombocythemia and polycythemia vera. Blood. 2006;108:1865–1867. doi: 10.1182/blood-2006-01-013540. [DOI] [PubMed] [Google Scholar]
- 5.Nussenzveig RH, Swierczek SI, Jelinek J, et al. Polycythemia vera is not initiated by JAK2V617F mutation. Exp Hematol. 2007;35:32–38. doi: 10.1016/j.exphem.2006.11.012. [DOI] [PubMed] [Google Scholar]
- 6.Zhao Y, Srivastava D. A developmental view of microRNA function. Trends Biochem Sci. 2007;32:189–197. doi: 10.1016/j.tibs.2007.02.006. [DOI] [PubMed] [Google Scholar]
- 7.Garzon R, Pichiorri F, Palumbo T, et al. MicroRNA fingerprints during human megakaryocytopoiesis. Proc Natl Acad Sci U S A. 2006;103:5078–5083. doi: 10.1073/pnas.0600587103. [DOI] [PMC free article] [PubMed] [Google Scholar]
- 8.Georgantas RW, 3rd, Hildreth R, Morisot S, et al. CD34+ hematopoietic stem-progenitor cell microRNA expression and function: a circuit diagram of differentiation control. Proc Natl Acad Sci U S A. 2007;104:2750–2755. doi: 10.1073/pnas.0610983104. [DOI] [PMC free article] [PubMed] [Google Scholar]
- 9.Neilson JR, Zheng GX, Burge CB, Sharp PA. Dynamic regulation of miRNA expression in ordered stages of cellular development. Genes Dev. 2007;21:578–589. doi: 10.1101/gad.1522907. [DOI] [PMC free article] [PubMed] [Google Scholar]
- 10.Felli N, Fontana L, Pelosi E, et al. MicroRNAs 221 and 222 inhibit normal erythropoiesis and erythroleukemic cell growth via kit receptor down-modulation. Proc Natl Acad Sci U S A. 2005;102:18081–18086. doi: 10.1073/pnas.0506216102. [DOI] [PMC free article] [PubMed] [Google Scholar]
- 11.Choong ML, Yang HH, McNiece I. MicroRNA expression profiling during human cord blood-derived CD34 cell erythropoiesis. Exp Hematol. 2007;35:551–564. doi: 10.1016/j.exphem.2006.12.002. [DOI] [PubMed] [Google Scholar]
- 12.Liu E, Jelinek J, Pastore YD, Guan Y, Prchal JF, Prchal JT. Discrimination of polycythemias and thrombocytoses by novel, simple, accurate clonality assays and comparison with PRV-1 expression and BFU-E response to erythropoietin. Blood. 2003;101:3294–3301. doi: 10.1182/blood-2002-07-2287. [DOI] [PubMed] [Google Scholar]
- 13.Gaikwad A, Nussenzveig R, Liu E, Gottshalk S, Chang K, Prchal JT. In vitro expansion of erythroid progenitors from polycythemia vera patients leads to decrease in JAK2 V617F allele. Exp Hematol. 2007;35:587–595. doi: 10.1016/j.exphem.2006.12.007. [DOI] [PMC free article] [PubMed] [Google Scholar]
- 14.Prchal JT, Cashman DP, Kan YW. Hb Long Island [(β-l) Met; β 2(NA2)His -->Pro] is Caused by a Single Mutation (A to C) Resulting in a Failure to Cleave N-Terminal Methionine. Proc Natl Acad Sci USA. 1986;83:24–28. doi: 10.1073/pnas.83.1.24. [DOI] [PMC free article] [PubMed] [Google Scholar]
- 15.Yoon D, Bruchova H, Agarwal AM, Prchal JT, Prchal JF. In Vitro Erythroid Cell Expansion Analysis in Polycythemia Vera [abstract] Blood. 2006;108(11):316b. Abstract 4916. [Google Scholar]
- 16.Thomson JM, Parker J, Perou CM, Hammond SM. A custom microarray platform for analysis of microRNA gene expression. Nat Methods. 2004;1:47–53. doi: 10.1038/nmeth704. [DOI] [PubMed] [Google Scholar]
- 17.Neildez-Nguyen TM, Wajcman H, Marden MC, et al. Human erythroid cells produced ex vivo at large scale differentiate into red blood cells in vivo. Nat Biotechnol. 2002;20:467–472. doi: 10.1038/nbt0502-467. [DOI] [PubMed] [Google Scholar]
- 18.Zhou B, Wang S, Mayr C, Bartel DP, Lodish HF. miR-150, a microRNA expressed in mature B and T cells, blocks early B cell development when expressed prematurely. Proc Natl Acad Sci U S A. 2007;104:7080–7085. doi: 10.1073/pnas.0702409104. [DOI] [PMC free article] [PubMed] [Google Scholar]
- 19.Rathjen T, Nicol C, McConkey G, Dalmay T. Analysis of short RNAs in the malaria parasite and its red blood cell host. FEBS Lett. 2006;580:5185–5188. doi: 10.1016/j.febslet.2006.08.063. [DOI] [PubMed] [Google Scholar]
- 20.Ramkissoon SH, Mainwaring LA, Ogasawara Y, et al. Hematopoietic-specific microRNA expression in human cells. Leuk Res. 2006;30:643–647. doi: 10.1016/j.leukres.2005.09.001. [DOI] [PubMed] [Google Scholar]
- 21.Yu J, Wang F, Yang GH, et al. Human microRNA clusters: genomic organization and expression profile in leukemia cell lines. Biochem Biophys Res Commun. 2006;349:59–68. doi: 10.1016/j.bbrc.2006.07.207. [DOI] [PubMed] [Google Scholar]
- 22.Calin GA, Dumitru CD, Shimizu M, et al. Frequent deletions and down-regulation of micro- RNA genes miR15 and miR16 at 13q14 in chronic lymphocytic leukemia. Proc Natl Acad Sci U S A. 2002;99:15524–15529. doi: 10.1073/pnas.242606799. [DOI] [PMC free article] [PubMed] [Google Scholar]
- 23.Cimmino A, Calin GA, Fabbri M, et al. miR-15 and miR-16 induce apoptosis by targeting BCL2. Proc Natl Acad Sci U S A. 2005;102:13944–13949. doi: 10.1073/pnas.0506654102. [DOI] [PMC free article] [PubMed] [Google Scholar]
- 24.Testa U. Apoptotic mechanisms in the control of erythropoiesis. Leukemia. 2004;18:1176–1199. doi: 10.1038/sj.leu.2403383. [DOI] [PubMed] [Google Scholar]
- 25.Zermati Y, Garrido C, Amsellem S, et al. Caspase activation is required for terminal erythroid differentiation. J Exp Med. 2001;193:247–254. doi: 10.1084/jem.193.2.247. [DOI] [PMC free article] [PubMed] [Google Scholar]
- 26.Eis PS, Tam W, Sun L, et al. Accumulation of miR-155 and BIC RNA in human B cell lymphomas. Proc Natl Acad Sci U S A. 2005;102:3627–3632. doi: 10.1073/pnas.0500613102. [DOI] [PMC free article] [PubMed] [Google Scholar]
- 27.Iorio MV, Ferracin M, Liu CG, et al. MicroRNA gene expression deregulation in human breast cancer. Cancer Res. 2005;65:7065–7070. doi: 10.1158/0008-5472.CAN-05-1783. [DOI] [PubMed] [Google Scholar]
- 28.Scicchitano MS, McFarland DC, Tierney LA, Narayanan PK, Schwartz LW. In vitro expansion of human cord blood CD36+ erythroid progenitors: temporal changes in gene and protein expression. Exp Hematol. 2003;31:760–769. doi: 10.1016/s0301-472x(03)00185-1. [DOI] [PubMed] [Google Scholar]
- 29.Roldo C, Missiaglia E, Hagan JP, et al. MicroRNA expression abnormalities in pancreatic endocrine and acinar tumors are associated with distinctive pathologic features and clinical behavior. J Clin Oncol. 2006;24:4677–4684. doi: 10.1200/JCO.2005.05.5194. [DOI] [PubMed] [Google Scholar]
- 30.Detmer K, Walker AN. Bone morphogenetic proteins act synergistically with haematopoietic cytokines in the differentiation of haematopoietic progenitors. Cytokine. 2002;17:36–42. doi: 10.1006/cyto.2001.0984. [DOI] [PubMed] [Google Scholar]
- 31.Vegiopoulos A, Garcia P, Emambokus N, Frampton J. Coordination of erythropoiesis by the transcription factor c-Myb. Blood. 2006;107:4703–4710. doi: 10.1182/blood-2005-07-2968. [DOI] [PMC free article] [PubMed] [Google Scholar]