Mitochondrial Fusion and Function in Charcot-Marie-Tooth Type 2A Patient Fibroblasts with Mitofusin 2 Mutations (original) (raw)
. Author manuscript; available in PMC: 2009 May 1.
Abstract
Charcot-Marie-Tooth Type 2A is a dominantly inherited peripheral neuropathy characterized by axonal degeneration of sensory and motor nerves. The disease is caused by mutations in the mitochondrial fusion gene MFN2. Mfn2 is an integral outer mitochondrial membrane protein composed of a large GTPase domain and two heptad repeat (HR) domains that face the cytoplasm. Mitochondrial membrane fusion and division are balanced processes that are necessary to maintain tubular mitochondrial morphology, respiratory function, and uniform distribution of the organelle throughout the cell. We have utilized primary fibroblasts from CMT2A patients to survey mitochondrial phenotypes associated with heterozygous MFN2 alleles expressed at physiological levels. Our results indicate that, in fibroblasts, mitofusin expression, mitochondrial morphology, ultrastructure, mtDNA content, and respiratory capacity are not affected by the presence of mutant Mfn2 protein. Consistent with a lack of mitochondrial dysfunction, we also show that mitochondrial fusion occurs efficiently in CMT2A patient-derived fibroblasts. Our observations are in agreement with the neuronal specificity of the disease and are consistent with a recent finding that mitochondrial fusion can be maintained in cells that express mutant Mfn2 protein due to complementation by a second mitofusin, Mfn1. We discuss our results and those of others in terms of a comprehensive model for the mechanism(s) by which mutations in MFN2 may lead to CMT2A disease.
Keywords: CMT2A, peripheral neuropathy, mitochondria, mitofusin, Mfn2, Mfn1, GTPase, membrane fusion, fibroblasts
Introduction
In the past decade it has become increasingly clear that the regulation of mitochondrial dynamics, including fusion, division, and transport, is vital to cell viability, particularly in cells with very high energetic demands such as neurons (reviewed by (Baloh, 2007, Chan, 2006a, Chan, 2007, Chen and Chan, 2006). Charcot-Marie-Tooth disease Type 2A (CMT2A) is an autosomal dominant axonal peripheral neuropathy caused by heterozygous mutations in MFN2, the gene encoding Mitofusin 2 (Mfn2) (Chung, et al., 2006, Kijima, et al., 2005, Lawson, et al., 2005, Verhoeven, et al., 2006, Zuchner, et al., 2006, Zuchner, et al., 2004). Mfn2 is one of two mitofusin proteins that are directly involved in the regulated fusion of mitochondrial membranes and in the maintenance of tubular mitochondrial morphology (Eura, et al., 2003, Ishihara, et al., 2004, Legros, et al., 2002, Santel, et al., 2003). Mfn1 and Mfn2 are conserved integral outer mitochondrial membrane proteins, each consisting of a large GTPase domain and two heptad repeat (HR), or putative coiled-coil domains, all of which face the cytoplasm (reviewed by (Chan, 2006b, Okamoto and Shaw, 2005). Mouse knockout studies have shown that loss of either Mfn1 (_MFN1_−/−) or Mfn2 (_MFN2_−/−) is embryonic lethal, and double mitofusin knockout mouse embryonic fibroblasts (MEFs) exhibit severely fragmented mitochondria, slow growth, altered mitochondrial membrane potential, and decreased respiratory activity (Chen, et al., 2005, Chen, et al., 2003). Mitochondrial fusion has been proposed to promote and preserve the ‘health’ and functionality of this essential organelle via the regular inter-mixing of matrix contents, including mitochondrial DNA (mtDNA) (Chan, 2006b, Chen and Chan, 2006, Detmer and Chan, 2007b).
CMT2A causes progressive length-dependent sensory loss, distal muscle atrophy and weakness, and foot deformities in patients with MFN2 mutations (Lawson, et al., 2005, Zuchner, et al., 2006, Zuchner, et al., 2004). Reduced compound motor action potential amplitudes indicate that symptoms result from axonal loss or degeneration in peripheral nerves (Chung, et al., 2006, Lawson, et al., 2005, Verhoeven, et al., 2006). In addition to CMT2A, mutations in MFN2 have recently been identified in patients with HMSN VI, another CMT-related peripheral neuropathy with optic atrophy (Verhoeven, et al., 2006, Zuchner, et al., 2006). Similarly, mutations in the mitochondrial fusion gene OPA1 cause Dominant Optic Atrophy (DOA) (Delettre, et al., 2000) and some cases of CMT4A are caused by mutations in GDAP1 (Baxter, et al., 2002, Cuesta, et al., 2002), a mitochondrial outer membrane protein with a putative role in mitochondrial division (Niemann, et al., 2005). This growing collection of neuropathies associated with mutant mitochondrial proteins highlights the significant contribution of mitochondrial dynamics to neurological function.
Studies in cells expressing CMT2A-associated MFN2 alleles have suggested models for the molecular basis and the neuronal specificity of the disease. In one study, overexpression of mutant MFN2 in primary rat dorsal root ganglion (DRG) cells resulted in the accumulation of mitochondria in the cell body, fewer mitochondria in distal axons, and an increased number of stationary organelles (Baloh, et al., 2007). The authors proposed that CMT2A alleles impair mitochondrial transport, leading to specific degeneration in the highly polar and lengthy axons of peripheral nerves. An alternative model was based on the expression of CMT2A-causing MFN2 alleles in single and double mitofusin knockout MEFs (Detmer and Chan, 2007a). This analysis revealed that Mfn1 can functionally complement the fusion defect of several mutant MFN2 alleles. Hence, lower Mfn1 expression levels in neurons could explain the neuronal specific consequences of CMT2A-associated mutations. Finally, mitochondrial function was examined in fibroblasts obtained from four CMT2A patients carrying three of the approximately 40 known MFN2 mutations (Loiseau, et al., 2007). Mitochondria in these patient fibroblasts formed normal tubular networks but displayed an energetic coupling defect, which could contribute to the axonal degeneration observed in CMT2A patients. Thus, despite what is known about the role of Mfn2 in mitochondrial fusion, the molecular pathogenesis of MFN2 mutations in CMT2A remains unclear.
Although the pathological effects of CMT2A alleles would ideally be evaluated in CMT2A patient-derived neurons, these tissues are not readily available. However, primary patient fibroblasts can be easily acquired and have practical advantages over studies in knockout mice and in neuronal culture systems. In particular, methods for studying mitochondrial fusion are well established in fibroblasts (Chen, et al., 2005, Chen, et al., 2003), and patient cells allow the evaluation of mutant alleles at native expression levels, thereby avoiding phenotypes caused by Mfn2 overexpression (Detmer and Chan, 2007a, Eura, et al., 2003, Huang, et al., 2007, Rojo, et al., 2002). In this study, we characterized mitochondrial fusion and function in cultured primary fibroblasts obtained from five CMT2A patients with distinct MFN2 mutations. Fibroblasts were evaluated for changes in Mfn2 and Mfn1 protein abundance, mitochondrial morphology, mtDNA integrity, respiratory function, and membrane fusion. We found that mitochondrial dynamics and function were preserved in patient fibroblasts endogenously expressing both wild-type (WT) and mutant Mfn2 proteins, as well as Mfn1. This establishes that heterozygous MFN2 mutations are not sufficient to disrupt mitochondrial fusion or alter mitochondrial function in fibroblasts. These results are consistent with the neuronal specificity of CMT2A and establish that patient fibroblasts are not the preferred experimental system for determining the pathogenic mechanism of the diease. On the other hand, patient fibroblasts may provide a useful system for studying the compensating mechanisms that protect most CMT2A patient tissues.
Materials and Methods
Cell Culture
Patients with Charcot-Marie-Tooth Type 2A (CMT2A) caused by three different point mutations in Mfn2 (T105M, I213T, and V273G) have been described previously (Lawson, et al., 2005). The clinical descriptions of two additional CMT2A patients carrying novel MFN2 mutations, located in the GTPase (F240I) and HR2 (L734V) domains of the protein will be presented elsewhere. Under an IRB approved protocol, and following informed consent, skin punches were obtained from CMT2A patients harboring the mutations cited above. Primary fibroblast cultures were established using standard cell culture procedures. A skin punch was also obtained from an unrelated, unaffected individual with WT MFN2. Cultured fibroblasts from the normal individual were used throughout this work as the Control sample. Under standard culture conditions (low glucose Dulbecco’s Modified Eagle’s Medium (Invitrogen) supplemented with 10% Fetal Bovine Serum (Hyclone) incubated at 37ºC with 5% CO2) the CMT2A patient-derived fibroblasts exhibited cellular morphology and growth characteristics similar to those of the Control culture and could be maintained for approximately 15 passages (P15). All experiments were performed on early to mid-passage cells (P4-P9) unless otherwise indicated.
Mitofusin Protein Analysis
Total cellular protein was prepared from 1×10⁶ cells lysed with Cell Disruption Buffer (Ambion). 10μg total protein per sample was separated by electrophoresis on an 8% polyacrylamide-SDS gel. Separated proteins were transferred to nitrocellulose and specific proteins were detected by immuno-decoration with anti-Mfn2 (1/1000 dilution; Sigma #M6444), anti-porin (1/10,000 dilution; Molecular Probes #A31855), and anti-Mfn1 (1/250 dilution, a generous gift from M. Rojo). HRP-conjugated mouse or rabbit secondary antibodies were detected by ECL illumination (ECL Plus Western Blotting Reagent, GE LifeSciences) and densitometric analysis of the resulting films was used to quantify the signal of each protein band (Quantity One, Bio-Rad). The ratio of Mfn2 to porin was determined for each sample and all CMT2A samples were normalized to the Control sample (Control = 1.00; n=3).
For sub-cellular fractionation, cells were harvested, resuspended in Homogenization Buffer (250mM Sucrose, 20mM Tris, pH7.4, 140mM NaCl, 10mM KCl, 1.5mM MgCl2, 1mM DTT, 1× Complete EDTA-free protease inhibitor cocktail (Roche)) and disrupted in a dounce homogenizer. Homogenates were centrifuged at 800 × g to pellet nuclei and unlysed cells. The resulting supernatant was spun for 15 minutes at 10,000 × g to generate mitochondrial pellet (Mito) and post-mitochondrial supernatant (PMS) fractions. 5 μg protein from each fraction was separated by electrophoresis as described above and samples were analyzed for the presence of Mfn2, porin, and GAPDH (1/10,000 dilution; Sigma #G8795) by standard Western procedures.
MitoTracker Staining and Fluorescence Microscopy
Approximately 10,000 cells per population were plated on 35mm poly-d-lysine coated glass-bottom culture dishes (MatTek Corp.) in standard medium and incubated at 37°C for at least 24 hours. For mitochondrial staining, standard medium was replaced with medium containing 15nM MitoTracker® Red CM-H2XROS (Molecular Probes) and cells were incubated with the dye at 37°C for 6–8 hours. After incubation, cells were washed twice with Phosphate Buffered Saline. Mitochondria in live cells were visualized by fluorescence microscopy and mitochondrial morphology was scored as either Tubular, Mixed, or Fragmented. Images were obtained by standard or confocal fluorescence microscopy (Olympus IX71 or Olympus IX81 confocal, University of Utah School of Medicine Cell Imaging Facility).
Electron Microscopy
Mitochondrial morphology and ultrastructure were evaluated by transmission electron microscopy. Low passage (P3–P6) fibroblast cultures were grown to 70–80% confluence in standard 10 cm culture dishes as described above. Cells were fixed for 1 hour at room temperature (3.0% formaldehyde, 1.5% glutaraldehyde in 0.1M NaCacodylate, 5mM Ca2+, 2.5% sucrose, pH 7.4) and washed three times (15 minutes per wash; 0.1M NaCacodylate, 2.5% sucrose, pH 7.4). Cells were processed, sectioned, and analyzed as described previously (McCaffery and Farquhar, 1995). Briefly, cells were post-fixed in Palade’s OsO4, stained in Kellenberger’s uranyl acetate, dehydrated and embedded in epon for sectioning. Images were collected on a Phillipis EM 410 TEM equipped with a Soft Imaging System Megaview III digital camera.
Mitochondrial DNA Analysis
PCR analysis for detection of large-scale mitochondrial deletions was performed essentially as described previously (Kleinle, et al., 1997) except that the primers were used in different combinations to generate products for two distinct regions of the genome. Briefly, genomic DNA was isolated either from snap-frozen muscle biopsy samples or ~1×10⁷ P5 and P11 Control and CMT2A patient-derived fibroblasts. DNA isolated from muscle of individuals with Kearns-Sayre Syndrome (KSS) or Chronic Progressive External Opthamolplegia (CPEO) served as positive controls for single (KSS) and multiple (CPEO) mtDNA deletions. PCR amplification was performed using the Expand Long Template PCR System (Roche), with 100ng template DNA and 300nM primers D1B/OLA or D1A/OLB (Kleinle, et al., 1997). Primer pair D1B/OLA generates an ~11 kb product that extends from the heavy strand origin of replication (OH) to the light strand origin (OL). This region of the genome is commonly deleted or rearranged in mitochondrial disorders. Primer pair D1A/OLB generates an ~5.6 kb product that covers a region from OL to OH, where deletions are rare. Together, the two reactions cover the entire mitochondrial genome. PCR products were separated on a 1% agarose gel and visualized by staining with ethidium bromide.
Mitochondrial and nuclear DNA quantification was performed by quantitative real-time PCR (qRT-PCR) (Higuchi, et al., 1993), using a protocol similar to that reported previously for measuring quantities of telomeric DNA relative to nuclear DNA (Cawthon, 2002). Total cellular DNA was extracted from fibroblasts using the DNeasy Blood and Tissue Kit (Qiagen) and DNA yield was determined using the ND-1000 Spectrophotometer (NanoDrop). The single-copy nuclear gene β-globin and a region of mtDNA from bp 3130 to bp 3301 were amplified from 20ng total input DNA in separate 25μl real-time PCR reactions. The primers used to amplify mtDNA were previously shown to be specific for mtDNA and do not co-amplify nuclear sequences (Parfait, et al., 1998). Each template was mixed with Power SYBR® Green PCR Master Mix (Applied Biosystems) and 200nM primers (Integrated DNA Technologies, Inc.). Cycling and real-time detection was performed with the ABI PRISM® 7900 Sequence Detection System. Cycling conditions were as follows: 50°C for 2 min, 95°C for 10 min, followed by 35 cycles of 95°C for 30 sec, 50°C for 45 sec, 72°C for 30 sec. A dissociation profile was run on each sample and negative (no template) controls to confirm SYBR Green fluorescence detection was specific for the desired amplification product. In each experiment, 5ng – 40ng total DNA from the Control sample was amplified with both sets of primers to generate standard curves for quantification of the test samples. Using Cycle Threshold (Ct) values, the quantity of mtDNA and β-globin was determined from the corresponding standard curve (SDS 2.1.1 analysis software, Applied Biosystems) (See Supplemental Table 1) and relative amounts of mtDNA in each sample were calculated as the ratio of mtDNA to β-globin. All samples were amplified in quadruplicate in each experiment and the experiment was performed in triplicate. Statistical analyses were performed using PRISM® analytical software (GraphPad, Inc.) or Excel (Microsoft, Inc.).
Respiration Measurements
Basal and maximal (uncoupled) respiration rates were determined for individual fibroblast populations (Control, T105M, I213T, and V273G) by measuring oxygen consumption with a fiber-optic oxygen sensing probe (Ocean Optics, Denudin, FL) essentially as described previously (Chen, et al., 2005, O’Neill B, et al., 2007). Briefly, 8×10⁶ cells were suspended in 2 mL Buffer TD (137mM NaCl, 5mM KCl, 0.7mM Na2HPO4, 25mM Tris-Cl, pH 7.4) and transferred to the oxygen chamber. Following one minute of mixing to equilibrate the sample, the chamber was stoppered and allowed to equilibrate for an additional 2 minutes. Endogenous (basal) respiration was measured for 1 minute. The uncoupler 2,4-dinitrophenol (DNP) was injected into the chamber (83 mM final) at 4.5min after stoppering. Maximal (uncoupled) respiration was measured for 1 minute starting 0.5 minutes after the DNP injection.
Respiratory complex enzyme activities were measured from Control and three mutant fibroblast cultures (T105M, I213T, and V273G) as described previously (DiMauro, et al., 1987). Enzyme activity was calculated as nmoles/min/mg protein normalized to the mitochondrial matrix protein citrate synthase (CS).
PEG fusion assay
Plasmids pAC-GFP-mito (mito-GFP) and pDsRed2-mito (mito-RFP) (Clontech) were introduced into primary fibroblasts using the Amaxa Nucleofection System (Amaxa Biosystems, Germany) according to the manufacturer’s protocol for primary fibroblasts. 48 hours post-nucleofection nearly 90% of each culture expressed the appropriate mitochondrially targeted fluorophore. Fibroblasts expressing mito-GFP and mito-RFP were co-cultured (~15,000 cells each) overnight in poly-d-lysine treated 4-well slide chambers and the polyethylene glycol (PEG) fusion assay was performed essentially as described (Chen, et al., 2005, Chen, et al., 2003). Nine hours after PEG/cycloheximide treatment, cell hybrids were permeabilized and stained with DAPI, then fixed with 3.7% formaldehyde and treated with ProLong Gold® antifade reagent (Molecular Probes). Cell hybrids were visually evaluated for mitochondrial fusion and images were obtained by confocal fluorescence microscopy (Olympus IX81, University of Utah School of Medicine Cell Imaging Facility). Previous studies have established that PEG treatment alone does not induce mitochondrial membrane fusion (Chen, et al., 2005, Chen, et al., 2003, Eura, et al., 2003, Koshiba, et al., 2004, Mattenberger, et al., 2003).
Results
Mutant Mfn2 proteins are properly expressed and localized to mitochondria
Although CMT2A patients are heterozygous for MFN2 mutations, it is not known whether the CMT2A disease phenotype results from mitofusin insufficiency or dominant-negative disruption of mitofusin function. MFN2 mutations could produce haploinsufficiency as a result of either loss-of-function of the intact mutant protein or altered expression, stability, or localization of the mutant protein. We used Western analysis to evaluate steady-state mitofusin protein levels and Mfn2 sub-cellular localization in Control and CMT2A patient-derived fibroblasts harboring five different mutations in the Mfn2 protein (Figure 1). Four of the point mutations are located in the GTPase domain while the fifth is a newly identified mutation located in the HR2 region of Mfn2. A functional GTPase is required for an unknown step in the fusion reaction (Eura, et al., 2003, Ishihara, et al., 2004), while HR2 is proposed to tether adjacent organelles by forming homo- and heteromeric Mfn1 and Mfn2 fusion complexes (Koshiba, et al., 2004, Rojo, et al., 2002).
Figure 1. Mfn2 domain structure and location of CMT2A mutations.
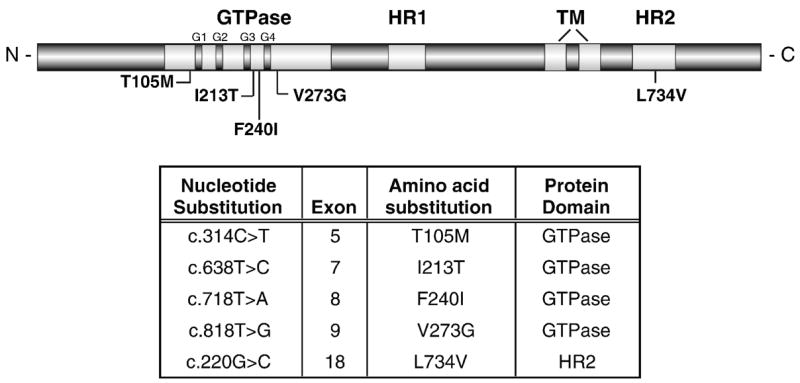
A schematic of the predicted functional and structural domains of Mfn2. The location of each CMT2A-associated amino acid substitution analyzed in this study is indicated. G1–G4 = functional motifs within the GTPase domain, TM = transmembrane domain, HR = heptad repeat or putative coil-coil domain.
Steady-state levels of Mfn2 protein (normalized to porin) were similar in total cell extracts from the Control and from all CMT2A fibroblast samples (Figure 2A), indicating that Mfn2 abundance is not affected by the presence of the mutations. Because none of the mutant Mfn2 proteins contain amino acid substitutions in the region used to generate the antibody (a.a. 557–576), the antibody should recognize both WT and mutant Mfn2 proteins. Similar studies using an anti-Mfn1 antibody on the same extracts indicated that Mfn1 protein is readily detected in human fibroblast extracts and that the presence of mutant Mfn2 protein in CMT2A fibroblasts did not alter steady-state levels of Mfn1 (Figure 2A).
Figure 2. Western analysis of mitofusin abundance and Mfn2 localization.
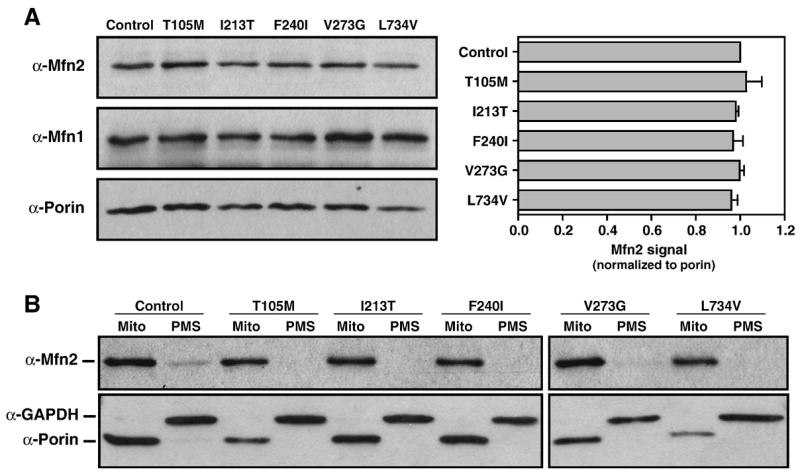
(A) Western blot analysis of the mitochondrial proteins Mfn2, porin, and Mfn1 (~86 kDa, 31 kDa, and 84 kDa, respectively) in 10μg protein from whole cell extracts of Control and CMT2A patient-derived fibroblasts. Mfn2 signal was normalized to porin and the ratio for the Control was set equal to 1.0. Bars represent average Mfn2 levels relative to porin and error bars indicate the standard deviation from triplicate analyses.
(B) Western blot analysis of Mfn2, porin, and GAPDH (~37 kDa) in mitochondrial pellets (Mito) and post-mitochondrial supernatants (PMS) from Control and Mfn2-mutant CMT2A fibroblasts. The outer mitochondrial membrane proteins Mfn2 and porin are detected primarily in the mitochondrial fractions while cytoplasmic GAPDH is only in PMS fractions. Mfn2 levels appear consistent between samples and both WT and mutant proteins are properly targeted and localized to the mitochondrial fraction.
To determine whether the mutations being studied interfere with the targeting of the Mfn2 protein to mitochondria, cell extracts were separated into mitochondrial (Mito) and cytoplasmic (post-mitochondrial supernatant or PMS) fractions by differential centrifugation. Each fraction was analyzed for the presence of Mfn2 by immuno-decoration with Mfn2 antibody as well as with antibodies to the outer mitochondrial membrane protein, porin, and the cytoplasmic protein, GAPDH (Figure 2B). Mfn2 protein was enriched in mitochondrial fractions and scarcely detectable in cytoplasmic fractions of both Control and CMT2A patient samples. Together, these analyses indicate that the disease-causing mutations do not change the steady-state abundance of Mfn2 protein nor interfere with the proper targeting of Mfn2 to mitochondria, and must instead lead to loss-of-function or dominant–negative effects.
Mitochondrial morphology and ultrastructure is normal in CMT2A patient-derived fibroblasts
In most cell types, including fibroblasts, mitochondria form a distinctive network of tubules dispersed throughout the cytosol. This network is maintained by a tightly regulated balance between mitochondrial fusion and division events (reviewed by (Chan, 2006b, Chen and Chan, 2004, Okamoto and Shaw, 2005). Mitochondrial fusion proteins are also involved in maintaining the distinctive cristae of the mitochondrial inner membrane (Frezza, et al., 2006, Griparic, et al., 2004, Olichon, et al., 2003). We determined the effect of CMT2A-associated MFN2 mutations on mitochondrial morphology, distribution, and membrane ultrastructure as a first indication of the ability of patient-derived fibroblasts to maintain a normal level of mitochondrial fusion.
Mid-passage Control and CMT2A patient fibroblasts were stained with MitoTracker® Red CM-H2XRos (MitoTracker) and mitochondria in live cells were visualized by fluorescence microscopy (Chen, et al., 2003). Mitochondrial morphology was scored (Figure 3A) and representative MitoTracker images of Control and CMT2A patient fibroblasts with the indicated Mfn2 mutations are shown (Figure 3B). No differences in mitochondrial morphology or distribution were observed between Control and patient fibroblasts. Electron microscopic examination further confirmed that mitochondria in CMT2A patient fibroblasts exhibit normal cytoplasmic distribution, morphology, and ultrastructure, including the characteristic double membrane and involuted inner membrane cristae (Figure 4).
Figure 3. Mitochondrial morphology in Control and CMT2A patient-derived fibroblasts.
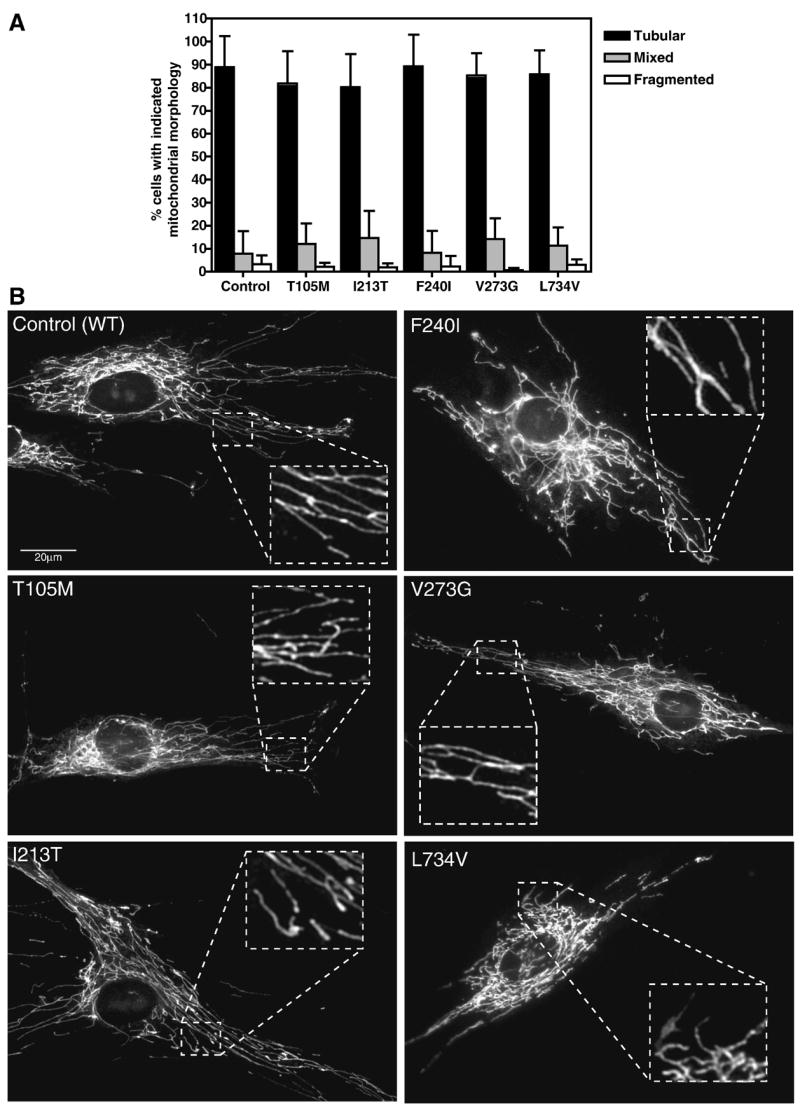
Primary fibroblast cultures were stained with 15nM MitoTracker for 6–8 hours and visualized by fluorescence microscopy. (A) Quantification of the percent of each population exhibiting the indicated mitochondrial morphologies. Tubular = interconnected tubular mitochondrial structures forming a network distributed throughout the cell. Mixed = a combination of normal tubular structures intermixed with spherical mitochondrial fragments. Fragmented = completely fragmented or spherical mitochondria. At least 100 individual cells per population were scored per experiment. Bars represent the mean percentage per category and error bars indicate the standard deviation from triplicate experiments. (B) Representative images of MitoTracker stained mitochondria in Control and CMT2A fibroblasts with the indicated Mfn2 amino acid substitutions. Insets are zoomed to highlight distinct tubular structures in the boxed areas.
Figure 4. Mitochondrial ultrastructure in Control and CMT2A patient-derived fibroblasts.

Primary fibroblast cultures were fixed and processed for transmission electron microscopy as described in Materials and Methods. Representative electron micrographs show normal gross mitochondrial morphology, quantity, and distribution in Control and the indicated Mfn2 mutant cells. Mitochondria are marked (m) and appear spherical or as longer tubules depending on the sectioning. A visible double membrane surrounds most of the pictured mitochondria and several have visible inner membrane cristae in the plane of focus, confirming normal mitochondrial ultrastructure.
Mitochondrial DNA integrity is normal in CMT2A patient-derived fibroblasts
A number of well-characterized clinical syndromes are associated with altered mitochondrial DNA integrity or copy number. These include large-scale single deletions in Kearns-Sayre Syndrome (KSS), multiple deletions in dominantly inherited chronic progressive ophthalmoplegia (CPEO), and mitochondrial depletion syndrome due to mutations in several of the autosomal genes responsible for mitochondrial replication or synthesis (Copeland, 2007). Disruption of mtDNA often alters the respiratory activity of cells, which can contribute to disease pathology. To evaluate the integrity of the mitochondrial genome in CMT2A patient fibroblasts, a long-range PCR assay was used to determine whether these cells contain mtDNA rearrangements similar to those found in patients with KSS and CPEO (Kleinle, et al., 1997). PCR amplification of Normal muscle and Control fibroblast samples yielded major products of ~11kb and ~5.6 kb with the OLA/D1B and OLB/D1A primers, respectively (Figure 5A). Together these primers amplify the entire mitochondrial genome and the products shown in the controls indicate intact, full-length genomic mtDNA. In contrast, OLA/D1B amplification of DNA from a KSS patient generated a distinct ~6 kb deletion product and amplification of the CPEO patient template produced a smear with minor bands, indicative of multiple mtDNA deletions. Amplification of mtDNA isolated from each of the CMT2A patient-derived fibroblasts produced the same 11 kb and 5.6 kb products seen in the control samples, suggesting that the CMT2A-associated MFN2 mutations under study do not cause instability of the mitochondrial genome. Since mtDNA instability could increase with progressive cell culture (particularly in the event of defective respiration and increased reactive oxygen species (ROS) production), we performed these assays on DNA from primary fibroblast cultures from progressive passages (P5, not shown, and P11, Figure 5A). Similar results were observed with both the P5 and P11 samples.
Figure 5. PCR-based mitochondrial DNA analysis.
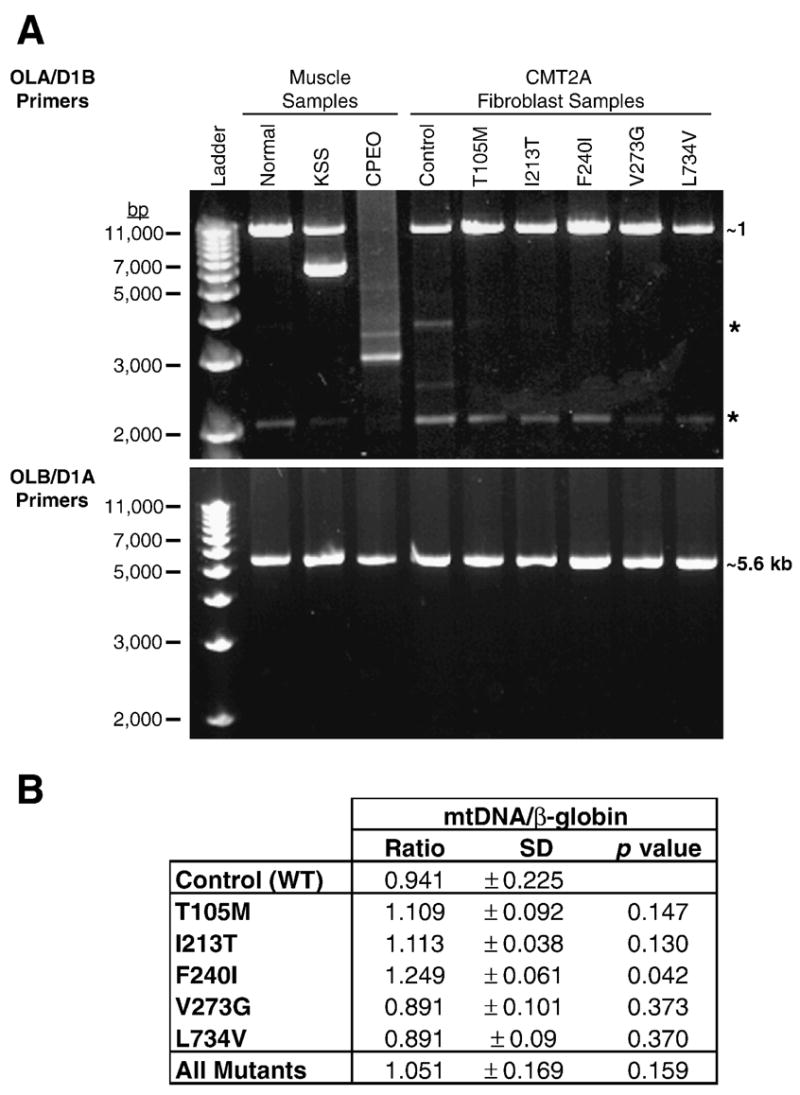
(A) Agarose gels displaying PCR products from muscle and fibroblast DNA samples using primers OLA/D1B and OLB/D1A. An 11kb PCR product generated from OLA/D1B primers is clearly visible in ‘Normal’ muscle and all fibroblast samples. Amplification of DNA isolated from muscle of a KSS patient produced a full-length product of 11kb as well as a deletion product of ~6kb. Amplification of DNA from muscle of a CPEO patient generated a large smear of DNA, indicating multiple deletions of the genome. All products generated from primers OLB/D1A are ~5.6 kb, the expected size for intact mtDNA. Asterisks (*) indicate non-specific amplification products visible in all lanes upon longer exposure. Analysis of DNA isolated from P5 fibroblasts produced results that were identical to those shown here for P11 cells.
(B) Results of qRT-PCR analysis of mtDNA in Control and CMT2A fibroblasts. The ratio of mtDNA/β-globin (± standard deviation) was calculated from triplicate experiments to determine the amount of mtDNA relative to a single copy nuclear gene (β-globin) in each sample. The Student’s t-test (unpaired, two-sample equal variance) was applied to the Control (WT) and each MFN2 mutant sample as well as all the mutant samples pooled together (All Mutants). A p value ≤ 0.05 indicates statistical significance.
Quantitative real-time PCR (qRT-PCR) was used to compare mtDNA content (approximate copy #) in Control and patient samples. The quantity of both β-globin, a single-copy nuclear gene, and mtDNA was calculated for each reaction based on the standard curve (Ct versus log input DNA) generated with each primer set (see Supplemental Table 1). The ratio of mtDNA to β-globin was calculated to determine the relative quantity of mtDNA in Control and CMT2A patient cells (Figure 5B). Relative mtDNA levels were not statistically different from the Control except for the F240I mutant sample (~25% more mtDNA, p =0.042 by Student’s t-test). This subtle difference, which probably falls within the normal range of variability in mtDNA content, is likely unrelated to the MFN2 mutation. It is noteworthy that while reduced mtDNA levels have been reported in fibroblasts from DOA patients (OPA1 mutations) (Kim, et al., 2005), the mtDNA levels measured in this collection of CMT2A patient fibroblasts varied both above and below that of the Control sample. When all patient samples were pooled (as done in the DOA fibroblast study), there was no significant difference between Control and patient mtDNA/β-globin ratios (Figure 5B, All Mutants), arguing against mtDNA loss or gain associated with MFN2 mutations.
Respiration rates and respiratory enzyme activities are normal in CMT2A patient-derived fibroblasts
To determine if CMT2A patient cells exhibit respiratory defects, we measured basal and maximal (DNP-uncoupled) rates of oxygen consumption (respiration rates) for three CMT2A patient fibroblast cultures (Figure 6). The vertical scatter plots of basal (Figure 6B) and uncoupled (Figure 6C) measurements from replicate experiments are included to demonstrate the range of respiratory rates measured from the same cell culture (including the Control). This variability resembles the range of respiration rates measured in fibroblasts from different healthy individuals of similar age (Greco, et al., 2003) and should be considered when trying to establish significant differences in respiratory capacity between individuals. We found that both mean basal and uncoupled respiration rates of CMT2A patient-derived fibroblasts were similar to those of the Control culture (Figure 6 A–C). Likewise, the approximately 3-fold increase in uncoupled respiration over basal rates (Figure 6A) for each of the CMT2A patient-derived cultures is consistent with the ratio observed in Control cells, suggesting that the electrochemical gradient across the inner mitochondrial membrane is intact (no ion leaking) and oxidative coupling is normal.
Figure 6. Respiration rates in control and CMT2A patient-derived fibroblasts.
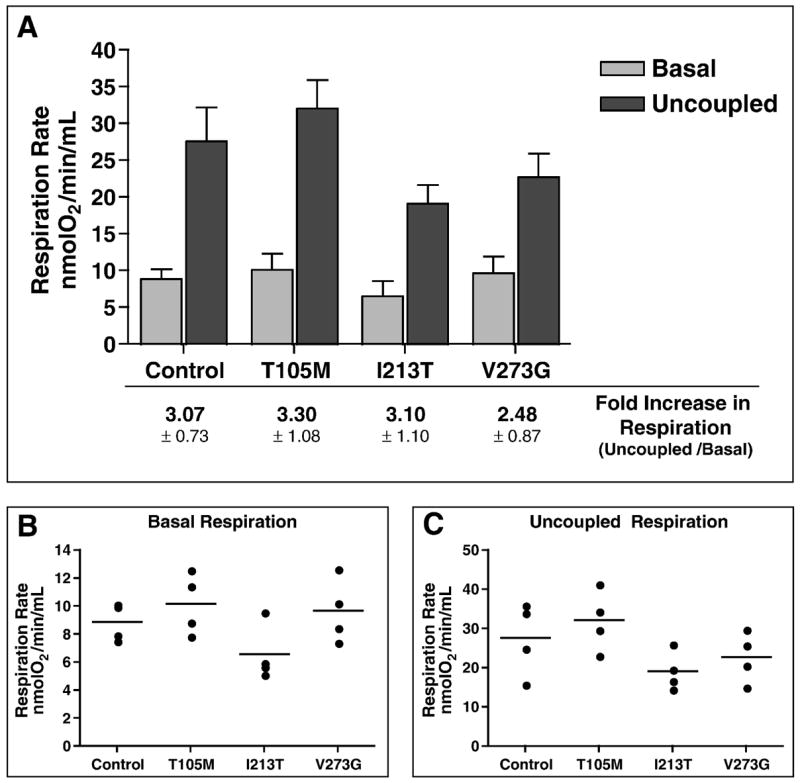
(A) Comparison of oxygen consumption rates for Control and mutant MFN2 (T105M, I213T, and V273G) fibroblast cultures measured under basal and uncoupled conditions. Bars represent the mean respiration rate (nmoles O2/min/mL) and error bars indicate the standard deviation from four independent measurements. Listed below each set of bars is the fold increase in respiration observed upon uncoupling by DNP addition (ratio of uncoupled/basal) ± standard deviation. (B) Vertical scatter plot indicating the range of basal respiration rates observed from multiple measures for each fibroblast population. (C) Vertical scatter plot indicating the range of uncoupled respiration rates observed from multiple measures for each fibroblast population. Each circle indicates an individual data point and the horizontal bar represents the mean value from replicate measures.
To confirm that the similar rates of respiration were indicative of a properly functioning respiratory chain, we also measured respiratory complex enzyme activities (Table 1). Consistent with the similarity in respiration rates, the respiratory complex enzyme activities measured in CMT2A patient-derived cultures did not significantly differ from those measured in Control cells.
Table 1. Respiratory complex enzyme activity.
The enzymatic activity of respiratory complexes I-IV (as indicated) were determined and normalized to the mitochondrial content of the sample by correcting each value to CS activity (Citrate Synthase - a reference matrix enzyme). Units for the activity listed in each column are nmoles/min/mg protein
| NADH Dehydrogenase (I) | Succinate Dehydrogenase (II) | NADH-Cyt C Reductase (I and III) | Succinate-Cyt C Reductase (II and III) | Cytochrome C Oxidase (IV) | |
|---|---|---|---|---|---|
| Control (WT) | 15 | 0.80 | 1.70 | 0.53 | 1.20 |
| T105M | 21 | 1.00 | 2.10 | 0.54 | 1.23 |
| I213T | 20 | 0.93 | 1.90 | 0.50 | 1.29 |
| V273G | 19 | 0.62 | 1.90 | 0.37 | 1.06 |
Mitochondrial fusion occurs extensively in CMT2A patient-derived fibroblasts
Mitochondrial membrane fusion has been established as the primary function for Mfn2. Mouse knockout studies have shown that disruption of MFN2 impairs the ability of mitochondria to fuse, resulting in predominantly fragmented mitochondria (Chen, et al., 2005, Chen, et al., 2003). However, mitochondrial fusion has not been evaluated in human CMT2A cells, which express both WT and mutant Mfn2 proteins. Although tubular mitochondrial networks, like those observed in Figure 3, typically indicate normal fusion activity, in S. cerevisiae, tubular networks are retained in the absence of fusion if division is also impaired (Sesaki and Jensen, 1999). This observation raised the possibility that tubular mitochondria could be maintained under certain conditions even in the absence of productive fusion.
To directly assess mitochondrial fusion competence in CMT2A patient fibroblasts, we employed a polyethylene glycol (PEG)-mediated fusion assay (Chen, et al., 2003, Mattenberger, et al., 2003). Cells harboring the same mutant MFN2 allele and expressing either matrix-targeted GFP (mito-GFP) or dsRed2 (mito-RFP) were co-cultured and cell fusion was induced by treatment with PEG. Cellular fusion is followed by cytoplasmic mixing, which allows mito-GFP and mito-RFP labeled organelles to interact and undergo fusion. Mixing of the fluorescent matrix contents indicates efficient mitochondrial double membrane fusion. Approximately nine hours after inducing cell fusion, the resulting bi- or multi-nucleated cell hybrids were examined for the presence of mitochondria with overlapping, or co-localized, fluorescent red and green signal (Figure 7, yellow mitochondria in merged panels). Similar to the Control sample, extensive fusion of mitochondrial tubules was observed in cell hybrids from each of the five CMT2A patient fibroblast cultures. Cell hybrids (both Control and patient-derived) with mostly tubular mitochondria often contained a few discrete spherical mitochondrial structures (fragments) that remained unfused (see asterisks (green) and arrowheads (red); Figure 7A′ and 7B′). We also routinely observed fused (yellow) spherical mitochondria, indicating that the fragments were either capable of fusion or had been generated from tubules that had fused prior to fragmentation (arrows; Figure 7B, B′). Because we did not observe cell hybrids with predominantly unfused or partially fused mitochondria, we conclude that extensive mitochondrial fusion occurred in both Control and CMT2A patient fibroblasts.
Figure 7. Mitochondrial fusion in cell hybrids formed from Control or CMT2A patient-derived fibroblasts.

PEG fusion of Control (A) and I213T mutant (B) fibroblasts expressing mito-GFP and mito-RFP. Cell hybrids contain two or more nuclei visualized with DAPI (blue) and overlapping red and green fluorescence (yellow) indicates successful mitochondrial fusion. The Control cell hybrid in (A) has normal tubular mitochondrial morphology with extensive mitochondrial fusion. The cell hybrid of I213T mutant cells in (B) displays mixed mitochondrial morphology (tubular and spherical mitochondria) with fused tubular mitochondria and some fused spherical mitochondria. (A′) and (B′) are zoomed images of the boxed regions in the ‘Merged’ panels of (A) and (B), respectively. Asterisks (*) indicate unfused mito-GFP spherical mitochondria, carats (^) indicate unfused mito-RFP spherical mitochondria, and arrows (↑) point to fused spherical mitochondria.
Discussion
One puzzling aspect of CMT2A is that the symptoms of the disease are restricted to very specific tissues or cell types, despite the fact that mutant MFN2 alleles are expressed in every cell. Thus, in addition to discovering the molecular defects caused by MFN2 mutations, it will be essential to uncover the basis for the selective effects of the mutations in peripheral nerves. While animal models will be useful for deciphering some features of CMT2A pathogenesis, it is also necessary to study mitochondrial function in affected and unaffected cells from patients. Here, we have expanded upon a recent study of CMT2A fibroblasts by evaluating mitochondrial phenotypes, including direct assays of mitochondrial fusion and mitofusin protein abundance, in patient fibroblasts harboring five MFN2 mutations not examined previously. We found that, regardless of the location of the Mfn2 mutation, CMT2A fibroblasts are as robust as Control cells, with normal mitochondrial fusion and function. Below, we summarize current molecular models for CMT2A pathology based on studies in cell cultures, mouse models, and patient-derived cells. We discuss our data in the context of these earlier findings and propose a unifying model that incorporates all available data.
The polarity and length of peripheral nerve axons has led to speculation that axonal degeneration in CMT2A results from failure to deliver functional mitochondria to nerve terminals. To test whether mutant Mfn2 proteins interfere with mitochondrial transport in axons, Baloh and colleagues overexpressed CMT2A alleles in primary rat DRG cells (Baloh, et al., 2007). Axonal mitochondria in WT cells were simple tubules and fragments of variable length. In cells over expressing the mutant Mfn2 proteins, mitochondria were clustered in the cell body and very few organelles were seen in the axons. Based on these results, the authors proposed that mutant Mfn2 proteins interfere with an undefined role of Mfn2 in mitochondrial transport, which helps direct mitochondria down the long axons of peripheral nerves. However, interpretation of these studies is difficult because phenotypes were generated by overexpression of mutant Mfn2 protein in the presence of endogenous WT mitofusins. Overexpression of both WT and mutant Mfn2 (as well as other mitochondrial membrane proteins) has been shown to cause morphological changes (typically mitochondrial aggregation or clustering), often in a dose-dependent manner (Detmer and Chan, 2007a, Eura, et al., 2003, Huang, et al., 2007, Kimura and Okano, 2007, Rojo, et al., 2002, Stojanovski, et al., 2004, Yano, et al., 1997). Since expression levels of the mutant Mfn2 proteins were not documented in the Baloh et al. study, it is difficult to predict how substantial mitochondrial aggregation and transport defects might be in neurons expressing endogenous levels of the mutant Mfn2 protein. In addition, mitochondrial accumulation and impaired movement prevented direct analysis of mitochondrial fusion. Thus, the investigators could not determine whether mutant Mfn2 proteins directly impaired mitochondrial transport defect or whether defective movement was a secondary consequence of a change in fusion activity. Our findings that both mitochondrial fusion and distribution are normal in CMT2A patient fibroblasts (no mitochondrial clustering) would suggest that Mfn2 protein-related transport defects may be specific to neurons.
Another study directly tested the fusion function of CMT2A mutant Mfn2 proteins in the presence and absence of other mitofusins (Detmer and Chan, 2007a). Using this approach, the authors established that the majority of the mutant Mfn2 proteins (including the T105M mutant protein analyzed here) were non–functional for fusion when expressed alone or in the presence of WT Mfn2. However, when the mutant proteins were expressed together with Mfn1, both tubular mitochondrial morphology and normal fusion activity were restored, suggesting that fusion competent complexes were formed between Mfn1 and mutant Mfn2. The finding that Mfn1 can correct the fusion defect of mutant Mfn2 proteins suggested a model for the tissue-specificity of the disease. As proposed by Chan and colleagues, peripheral nerves may be specifically affected in CMT2A patients because they express low levels of Mfn1 (or no Mfn1) and rely primarily on Mfn2 for fusion. By contrast, mitochondrial fusion should be normal in cells that express Mfn1 at levels sufficient to compensate for the Mfn2 defect (Detmer and Chan, 2007a, Detmer and Chan, 2007b). Consistent with this model, we found that CMT2A patient fibroblasts express Mfn1, and that mitochondria in these cells fuse normally. In principle, siRNA knockdown of Mfn1 could be used to reveal fusion defects associated with the Mfn2 mutations in CMT2A patient fibroblasts. However, the results of such studies would be difficult or impossible to interpret due to mitochondrial fusion deficiencies and fragmentation caused by Mfn1 knockdown alone (Eura, et al., 2003). Ultimately, validation of this model will require analysis of Mfn1 and Mfn2 expression levels in a collection of human tissues with an emphasis on the affected neuronal cell types.
Although the creation of a mouse model for CMT2A would greatly facilitate studies of disease pathology and tissue-specificity, initial studies indicate that mice heterozygous for a common CMT2A allele (MFN2+/R94Q) do not exhibit neurological phenotypes (Detmer and Chan, 2007a). In addition, conditional Mfn2 knockout mice experience neurodegeneration and exhibit mitochondrial abnormalities in Purkinje cells, but the mouse phenotype does not mimic CMT2A disease (Chen, et al., 2007). Finally, a transgenic mouse expressing the T105M MFN2 mutation directly in motor neurons was recently described (Detmer, et al., 2007). These mice display axonal loss, muscle atrophy, and hind-limb gait defects resembling CMT2A, however, the phenotype could only be generated upon significant overexpression of the transgene. Together, these observations suggest that development of a CMT2A mouse model may not be straightforward, and emphasize the importance of carrying out future studies in human stem-cell derived or primary neuronal cultures as well as in CMT2A patient cells and tissues.
Prior to our study, mitochondrial function had only been examined in CMT2A fibroblasts carrying three of the approximately 40 known MFN2 lesions (Loiseau, et al., 2007). This study, like ours, reported essentially normal mitochondrial morphology, mtDNA content, respiration rates, and respiratory complex activity in patient fibroblasts. In addition, the authors found no significant differences in ATP production, ROS generation, or susceptibility to apoptosis-inducing agents. However, they did report statistically significant increases in oligomycin-insensitive respiration as well as decreases in mitochondrial membrane potential (ΔΨ) and mitochondrial coupling efficiency ([ATP]/oxygen consumed). These results are surprising because respiratory chain dysfunction is often associated with altered mitochondrial morphology, mtDNA integrity, and defects in electron transport components. In addition, the severity of the reported coupling defects is not consistent with the clinical severity of patient symptoms. The authors speculated that CMT2A symptoms may result from neuronal sensitivity to these subtle changes in mitochondrial energetics (Loiseau, et al., 2007), however, it is not yet clear whether the coupling defects reported by Loiseau et al. are a direct consequence of the MFN2 mutations or whether these defects do in fact contribute to CMT2A pathology.
While no single model discussed above fully explains the published data, the combined results can be accommodated by a synthesis of all the models. Specifically, the data suggest that fibroblasts and other unaffected CMT2A patient cells express sufficient levels of Mfn1 to allow the formation of functional fusion complexes that maintain mitochondrial integrity. In contrast, peripheral nerves are more sensitive to the presence of mutant Mfn2 proteins due to low levels of Mfn1 (Detmer and Chan, 2007a, Detmer and Chan, 2007b). The formation of mostly non-functional Mfn2-Mfn2mutant fusion complexes (Detmer and Chan, 2007a) in an environment with little to no Mfn1 would reduce the frequency of efficient fusion and may generate an energetically heterogeneous population of mitochondria in the affected cells (Chen, et al., 2005, Loiseau, et al., 2007). It has been shown that axonal transport of mitochondria depends on mitochondrial function, such that energetically compromised mitochondria are preferentially transported from the synapse back to the cell body (Miller and Sheetz, 2004). As a result, mitochondria are in short supply at the nerve terminal where they are needed to provide energy essential for synaptic function (Verstreken, et al., 2005). Alternatively, axonal transport defects could arise from mitochondrial aggregation (Baloh, et al., 2007, Detmer and Chan, 2007a), perhaps caused by mutant fusion complexes that prolong, or make permanent, the tethering of adjacent mitochondria (Eura, et al., 2003, Huang, et al., 2007, Koshiba, et al., 2004, Rojo, et al., 2002). In either case, depletion of mitochondria from peripheral nerve axons and terminals could cause progressive degeneration of these structures, producing the CMT2A symptoms observed in the patients. If this cascade of cellular events can be experimentally validated, it is possible that up-regulation of MFN1 expression or delivery of Mfn1 protein to peripheral nerves (Detmer and Chan, 2007a) might slow or block the progression of clinical symptoms in individuals diagnosed with CMT2A.
Supplementary Material
01
Acknowledgments
We gratefully acknowledge Ling Zhao for her technical assistance in performing mtDNA deletion analyses; the University of Utah School of Medicine Cell Imaging Facility for confocal microscope use and imaging assistance; the Genomics Core Facility of the University of Utah for qRT-PCR advising and equipment use; Ms Michelle Husain for her excellent EM technical expertise; Charles Murtaugh for use of his IX71 fluorescence microscope; Manuel Rojo for Mfn1 antibody; Dean Tantin for cell culture facilities, supplies, and advice; Richard Cawthon for discussion on mtDNA quantification; and David Chan and Hsiuchen Chen for providing protocols and technical advice. Most importantly, we are grateful to the CMT2A patients and their families for their valuable personal contributions to our studies. This research was supported by : NRSA T32 Institutional Training Grant (HD 07576-22) to EAA; National Center for Research Resources (1S10RR023454-01) to JMM; NINDS (K08 NS 48180) to PBK; NIH Mentored Research Development Award (SK23NS42713-05) and University of Utah Research Foundation seed grant to VHL; NIH (GM 53466) to JMS; and the National Center for Research Resources (M01-RR00064) to the University of Utah (L. Betz, P.I.).
Footnotes
Publisher's Disclaimer: This is a PDF file of an unedited manuscript that has been accepted for publication. As a service to our customers we are providing this early version of the manuscript. The manuscript will undergo copyediting, typesetting, and review of the resulting proof before it is published in its final citable form. Please note that during the production process errors may be discovered which could affect the content, and all legal disclaimers that apply to the journal pertain.
References
- Baloh RH. Mitochondrial Dynamics and Peripheral Neuropathy. Neuroscientist 2007 [Google Scholar]
- Baloh RH, Schmidt RE, Pestronk A, Milbrandt J. Altered axonal mitochondrial transport in the pathogenesis of Charcot-Marie-Tooth disease from mitofusin 2 mutations. J Neurosci. 2007;27:422–430. doi: 10.1523/JNEUROSCI.4798-06.2007. [DOI] [PMC free article] [PubMed] [Google Scholar]
- Baxter RV, Ben Othmane K, Rochelle JM, Stajich JE, Hulette C, Dew-Knight S, Hentati F, Ben Hamida M, Bel S, Stenger JE, Gilbert JR, Pericak-Vance MA, Vance JM. Ganglioside-induced differentiation-associated protein-1 is mutant in Charcot-Marie-Tooth disease type 4A/8q21. Nat Genet. 2002;30:21–22. doi: 10.1038/ng796. [DOI] [PubMed] [Google Scholar]
- Cawthon RM. Telomere measurement by quantitative PCR. Nucleic Acids Res. 2002;30:e47. doi: 10.1093/nar/30.10.e47. [DOI] [PMC free article] [PubMed] [Google Scholar]
- Chan DC. Mitochondria: dynamic organelles in disease, aging, and development. Cell. 2006a;125:1241–1252. doi: 10.1016/j.cell.2006.06.010. [DOI] [PubMed] [Google Scholar]
- Chan DC. Mitochondrial fusion and fission in mammals. Annu Rev Cell Dev Biol. 2006b;22:79–99. doi: 10.1146/annurev.cellbio.22.010305.104638. [DOI] [PubMed] [Google Scholar]
- Chan DC. Mitochondrial dynamics in disease. N Engl J Med. 2007;356:1707–1709. doi: 10.1056/NEJMp078040. [DOI] [PubMed] [Google Scholar]
- Chen H, Chan DC. Mitochondrial dynamics in mammals. Curr Top Dev Biol. 2004;59:119–144. doi: 10.1016/S0070-2153(04)59005-1. [DOI] [PubMed] [Google Scholar]
- Chen H, Chan DC. Critical dependence of neurons on mitochondrial dynamics. Curr Opin Cell Biol. 2006;18:453–459. doi: 10.1016/j.ceb.2006.06.004. [DOI] [PubMed] [Google Scholar]
- Chen H, Chomyn A, Chan DC. Disruption of fusion results in mitochondrial heterogeneity and dysfunction. J Biol Chem. 2005;280:26185–26192. doi: 10.1074/jbc.M503062200. [DOI] [PubMed] [Google Scholar]
- Chen H, Detmer SA, Ewald AJ, Griffin EE, Fraser SE, Chan DC. Mitofusins Mfn1 and Mfn2 coordinately regulate mitochondrial fusion and are essential for embryonic development. J Cell Biol. 2003;160:189–200. doi: 10.1083/jcb.200211046. [DOI] [PMC free article] [PubMed] [Google Scholar]
- Chen H, McCaffery JM, Chan DC. Mitochondrial fusion protects against neurodegeneration in the cerebellum. Cell. 2007;130:548–562. doi: 10.1016/j.cell.2007.06.026. [DOI] [PubMed] [Google Scholar]
- Chung KW, Kim SB, Park KD, Choi KG, Lee JH, Eun HW, Suh JS, Hwang JH, Kim WK, Seo BC, Kim SH, Son IH, Kim SM, Sunwoo IN, Choi BO. Early onset severe and late-onset mild Charcot-Marie-Tooth disease with mitofusin 2 (MFN2) mutations. Brain. 2006;129:2103–2118. doi: 10.1093/brain/awl174. [DOI] [PubMed] [Google Scholar]
- Copeland WC. Inherited Mitochondrial Diseases of DNA Replication. Annu Rev Med. 2007 doi: 10.1146/annurev.med.59.053006.104646. [DOI] [PMC free article] [PubMed] [Google Scholar]
- Cuesta A, Pedrola L, Sevilla T, Garcia-Planells J, Chumillas MJ, Mayordomo F, LeGuern E, Marin I, Vilchez JJ, Palau F. The gene encoding ganglioside-induced differentiation-associated protein 1 is mutated in axonal Charcot-Marie-Tooth type 4A disease. Nat Genet. 2002;30:22–25. doi: 10.1038/ng798. [DOI] [PubMed] [Google Scholar]
- Delettre C, Lenaers G, Griffoin JM, Gigarel N, Lorenzo C, Belenguer P, Pelloquin L, Grosgeorge J, Turc-Carel C, Perret E, Astarie-Dequeker C, Lasquellec L, Arnaud B, Ducommun B, Kaplan J, Hamel CP. Nuclear gene OPA1, encoding a mitochondrial dynamin-related protein, is mutated in dominant optic atrophy. Nat Genet. 2000;26:207–210. doi: 10.1038/79936. [DOI] [PubMed] [Google Scholar]
- Detmer SA, Chan DC. Complementation between mouse Mfn1 and Mfn2 protects mitochondrial fusion defects caused by CMT2A disease mutations. J Cell Biol. 2007a;176:405–414. doi: 10.1083/jcb.200611080. [DOI] [PMC free article] [PubMed] [Google Scholar]
- Detmer SA, Chan DC. Functions and dysfunctions of mitochondrial dynamics. Nat Rev Mol Cell Biol. 2007b;8:870–879. doi: 10.1038/nrm2275. [DOI] [PubMed] [Google Scholar]
- Detmer SA, Velde CV, Cleveland DW, Chan DC. Hindlimb gait defects due to motor axon loss and reduced distal muscles in a transgenic mouse model of Charcot-Marie-Tooth type 2A. Hum Mol Genet. 2007 doi: 10.1093/hmg/ddm314. [DOI] [PubMed] [Google Scholar]
- DiMauro S, Servidei S, Zeviani M, DiRocco M, DeVivo DC, DiDonato S, Uziel G, Berry K, Hoganson G, Johnsen SD, et al. Cytochrome c oxidase deficiency in Leigh syndrome. Ann Neurol. 1987;22:498–506. doi: 10.1002/ana.410220409. [DOI] [PubMed] [Google Scholar]
- Eura Y, Ishihara N, Yokota S, Mihara K. Two mitofusin proteins, mammalian homologues of FZO, with distinct functions are both required for mitochondrial fusion. J Biochem (Tokyo) 2003;134:333–344. doi: 10.1093/jb/mvg150. [DOI] [PubMed] [Google Scholar]
- Frezza C, Cipolat S, Martins de Brito O, Micaroni M, Beznoussenko GV, Rudka T, Bartoli D, Polishuck RS, Danial NN, De Strooper B, Scorrano L. OPA1 controls apoptotic cristae remodeling independently from mitochondrial fusion. Cell. 2006;126:177–189. doi: 10.1016/j.cell.2006.06.025. [DOI] [PubMed] [Google Scholar]
- Greco M, Villani G, Mazzucchelli F, Bresolin N, Papa S, Attardi G. Marked aging-related decline in efficiency of oxidative phosphorylation in human skin fibroblasts. Faseb J. 2003;17:1706–1708. doi: 10.1096/fj.02-1009fje. [DOI] [PubMed] [Google Scholar]
- Griparic L, van der Wel NN, Orozco IJ, Peters PJ, van der Bliek AM. Loss of the intermembrane space protein Mgm1/OPA1 induces swelling and localized constrictions along the lengths of mitochondria. J Biol Chem. 2004;279:18792–18798. doi: 10.1074/jbc.M400920200. [DOI] [PubMed] [Google Scholar]
- Higuchi R, Fockler C, Dollinger G, Watson R. Kinetic PCR analysis: real-time monitoring of DNA amplification reactions. Biotechnology (N Y) 1993;11:1026–1030. doi: 10.1038/nbt0993-1026. [DOI] [PubMed] [Google Scholar]
- Huang P, Yu T, Yoon Y. Mitochondrial clustering induced by overexpression of the mitochondrial fusion protein Mfn2 causes mitochondrial dysfunction and cell death. Eur J Cell Biol. 2007;86:289–302. doi: 10.1016/j.ejcb.2007.04.002. [DOI] [PubMed] [Google Scholar]
- Ishihara N, Eura Y, Mihara K. Mitofusin 1 and 2 play distinct roles in mitochondrial fusion reactions via GTPase activity. J Cell Sci. 2004;117:6535–6546. doi: 10.1242/jcs.01565. [DOI] [PubMed] [Google Scholar]
- Kijima K, Numakura C, Izumino H, Umetsu K, Nezu A, Shiiki T, Ogawa M, Ishizaki Y, Kitamura T, Shozawa Y, Hayasaka K. Mitochondrial GTPase mitofusin 2 mutation in Charcot-Marie-Tooth neuropathy type 2A. Hum Genet. 2005;116:23–27. doi: 10.1007/s00439-004-1199-2. [DOI] [PubMed] [Google Scholar]
- Kim JY, Hwang JM, Ko HS, Seong MW, Park BJ, Park SS. Mitochondrial DNA content is decreased in autosomal dominant optic atrophy. Neurology. 2005;64:966–972. doi: 10.1212/01.WNL.0000157282.76715.B1. [DOI] [PubMed] [Google Scholar]
- Kimura M, Okano Y. Human Misato regulates mitochondrial distribution and morphology. Exp Cell Res. 2007;313:1393–1404. doi: 10.1016/j.yexcr.2007.02.004. [DOI] [PubMed] [Google Scholar]
- Kleinle S, Wiesmann U, Superti-Furga A, Krahenbuhl S, Boltshauser E, Reichen J, Liechti-Gallati S. Detection and characterization of mitochondrial DNA rearrangements in Pearson and Kearns-Sayre syndromes by long PCR. Hum Genet. 1997;100:643–650. doi: 10.1007/s004390050567. [DOI] [PubMed] [Google Scholar]
- Koshiba T, Detmer SA, Kaiser JT, Chen H, McCaffery JM, Chan DC. Structural basis of mitochondrial tethering by mitofusin complexes. Science. 2004;305:858–862. doi: 10.1126/science.1099793. [DOI] [PubMed] [Google Scholar]
- Lawson VH, Graham BV, Flanigan KM. Clinical and electrophysiologic features of CMT2A with mutations in the mitofusin 2 gene. Neurology. 2005;65:197–204. doi: 10.1212/01.wnl.0000168898.76071.70. [DOI] [PubMed] [Google Scholar]
- Legros F, Lombes A, Frachon P, Rojo M. Mitochondrial fusion in human cells is efficient, requires the inner membrane potential, and is mediated by mitofusins. Mol Biol Cell. 2002;13:4343–4354. doi: 10.1091/mbc.E02-06-0330. [DOI] [PMC free article] [PubMed] [Google Scholar]
- Loiseau D, Chevrollier A, Verny C, Guillet V, Gueguen N, Pou de Crescenzo MA, Ferre M, Malinge MC, Guichet A, Nicolas G, Amati-Bonneau P, Malthiery Y, Bonneau D, Reynier P. Mitochondrial coupling defect in Charcot-Marie-Tooth type 2A disease. Ann Neurol. 2007;61:315–323. doi: 10.1002/ana.21086. [DOI] [PubMed] [Google Scholar]
- Mattenberger Y, James DI, Martinou JC. Fusion of mitochondria in mammalian cells is dependent on the mitochondrial inner membrane potential and independent of microtubules or actin. FEBS Lett. 2003;538:53–59. doi: 10.1016/s0014-5793(03)00124-8. [DOI] [PubMed] [Google Scholar]
- McCaffery JM, Farquhar MG. Localization of GTPases by indirect immunofluorescence and immunoelectron microscopy. Methods Enzymol. 1995;257:259–279. doi: 10.1016/s0076-6879(95)57031-4. [DOI] [PubMed] [Google Scholar]
- Miller KE, Sheetz MP. Axonal mitochondrial transport and potential are correlated. J Cell Sci. 2004;117:2791–2804. doi: 10.1242/jcs.01130. [DOI] [PubMed] [Google Scholar]
- Niemann A, Ruegg M, La Padula V, Schenone A, Suter U. Ganglioside-induced differentiation associated protein 1 is a regulator of the mitochondrial network: new implications for Charcot-Marie-Tooth disease. J Cell Biol. 2005;170:1067–1078. doi: 10.1083/jcb.200507087. [DOI] [PMC free article] [PubMed] [Google Scholar]
- O’Neill BT, Kim J, Wende AR, Theobald HA, Tuinei J, Buchanan J, Guo A, Zaha VG, Davis DK, Schell JC, Boudina S, Wayment B, Litwin SE, Shioi T, Izumo S, Birnbaum MJ, Abel ED. A Conserved Role for Phosphatidylinositol 3-Kinase but Not Akt Signaling in Mitochondrial Adaptations that Accompany Physiological Cardiac Hypertrophy. Cell Metab. 2007;6:294–306. doi: 10.1016/j.cmet.2007.09.001. [DOI] [PMC free article] [PubMed] [Google Scholar]
- Okamoto K, Shaw JM. Mitochondrial morphology and dynamics in yeast and multicellular eukaryotes. Annu Rev Genet. 2005;39:503–536. doi: 10.1146/annurev.genet.38.072902.093019. [DOI] [PubMed] [Google Scholar]
- Olichon A, Baricault L, Gas N, Guillou E, Valette A, Belenguer P, Lenaers G. Loss of OPA1 perturbates the mitochondrial inner membrane structure and integrity, leading to cytochrome c release and apoptosis. J Biol Chem. 2003;278:7743–7746. doi: 10.1074/jbc.C200677200. [DOI] [PubMed] [Google Scholar]
- Parfait B, Rustin P, Munnich A, Rotig A. Co-amplification of nuclear pseudogenes and assessment of heteroplasmy of mitochondrial DNA mutations. Biochem Biophys Res Commun. 1998;247:57–59. doi: 10.1006/bbrc.1998.8666. [DOI] [PubMed] [Google Scholar]
- Rojo M, Legros F, Chateau D, Lombes A. Membrane topology and mitochondrial targeting of mitofusins, ubiquitous mammalian homologs of the transmembrane GTPase Fzo. J Cell Sci. 2002;115:1663–1674. doi: 10.1242/jcs.115.8.1663. [DOI] [PubMed] [Google Scholar]
- Santel A, Frank S, Gaume B, Herrler M, Youle RJ, Fuller MT. Mitofusin-1 protein is a generally expressed mediator of mitochondrial fusion in mammalian cells. J Cell Sci. 2003;116:2763–2774. doi: 10.1242/jcs.00479. [DOI] [PubMed] [Google Scholar]
- Sesaki H, Jensen RE. Division versus fusion: Dnm1p and Fzo1p antagonistically regulate mitochondrial shape. J Cell Biol. 1999;147:699–706. doi: 10.1083/jcb.147.4.699. [DOI] [PMC free article] [PubMed] [Google Scholar]
- Stojanovski D, Koutsopoulos OS, Okamoto K, Ryan MT. Levels of human Fis1 at the mitochondrial outer membrane regulate mitochondrial morphology. J Cell Sci. 2004;117:1201–1210. doi: 10.1242/jcs.01058. [DOI] [PubMed] [Google Scholar]
- Verhoeven K, Claeys KG, Zuchner S, Schroder JM, Weis J, Ceuterick C, Jordanova A, Nelis E, De Vriendt E, Van Hul M, Seeman P, Mazanec R, Saifi GM, Szigeti K, Mancias P, Butler IJ, Kochanski A, Ryniewicz B, De Bleecker J, Van den Bergh P, Verellen C, Van Coster R, Goemans N, Auer-Grumbach M, Robberecht W, Milic Rasic V, Nevo Y, Tournev I, Guergueltcheva V, Roelens F, Vieregge P, Vinci P, Moreno MT, Christen HJ, Shy ME, Lupski JR, Vance JM, De Jonghe P, Timmerman V. MFN2 mutation distribution and genotype/phenotype correlation in Charcot-Marie-Tooth type 2. Brain. 2006;129:2093–2102. doi: 10.1093/brain/awl126. [DOI] [PubMed] [Google Scholar]
- Verstreken P, Ly CV, Venken KJ, Koh TW, Zhou Y, Bellen HJ. Synaptic mitochondria are critical for mobilization of reserve pool vesicles at Drosophila neuromuscular junctions. Neuron. 2005;47:365–378. doi: 10.1016/j.neuron.2005.06.018. [DOI] [PubMed] [Google Scholar]
- Yano M, Kanazawa M, Terada K, Namchai C, Yamaizumi M, Hanson B, Hoogenraad N, Mori M. Visualization of mitochondrial protein import in cultured mammalian cells with green fluorescent protein and effects of overexpression of the human import receptor Tom20. J Biol Chem. 1997;272:8459–8465. doi: 10.1074/jbc.272.13.8459. [DOI] [PubMed] [Google Scholar]
- Zuchner S, De Jonghe P, Jordanova A, Claeys KG, Guergueltcheva V, Cherninkova S, Hamilton SR, Van Stavern G, Krajewski KM, Stajich J, Tournev I, Verhoeven K, Langerhorst CT, de Visser M, Baas F, Bird T, Timmerman V, Shy M, Vance JM. Axonal neuropathy with optic atrophy is caused by mutations in mitofusin 2. Ann Neurol. 2006;59:276–281. doi: 10.1002/ana.20797. [DOI] [PubMed] [Google Scholar]
- Zuchner S, Mersiyanova IV, Muglia M, Bissar-Tadmouri N, Rochelle J, Dadali EL, Zappia M, Nelis E, Patitucci A, Senderek J, Parman Y, Evgrafov O, Jonghe PD, Takahashi Y, Tsuji S, Pericak-Vance MA, Quattrone A, Battaloglu E, Polyakov AV, Timmerman V, Schroder JM, Vance JM. Mutations in the mitochondrial GTPase mitofusin 2 cause Charcot-Marie-Tooth neuropathy type 2A. Nat Genet. 2004;36:449–451. doi: 10.1038/ng1341. [DOI] [PubMed] [Google Scholar]
Associated Data
This section collects any data citations, data availability statements, or supplementary materials included in this article.
Supplementary Materials
01