MicroRNA-mediated Systemic Down-regulation of Copper Protein Expression in Response to Low Copper Availability in Arabidopsis (original) (raw)
Abstract
In plants, copper is an essential micronutrient required for photosynthesis. Two of the most abundant copper proteins, plastocyanin and copper/zinc superoxide dismutase, are found in chloroplasts. Whereas plastocyanin is essential for photo-autotrophic growth, copper/zinc superoxide dismutase is dispensable and in plastids can be replaced by an iron superoxide dismutase when copper is limiting. The down-regulation of copper/zinc superoxide dismutase expression in response to low copper involves a microRNA,miR398. Interestingly, in Arabidopsis and other plants, three additional microRNA families, miR397, miR408, and_miR857_, are predicted to target the transcripts for the copper protein plantacyanin and members of the laccase copper protein family. We confirmed the predicted targets of miR397, miR408, and_miR857_ experimentally by cleavage site analysis. To study the spatial expression pattern of these microRNAs and the effect of copper on their expression, we analyzed Arabidopsis grown hydroponically on different copper regimes. On low amounts of copper the plants accumulated_miR397_, miR408, and miR857. The microRNA expression pattern was negatively correlated with the accumulation of transcripts for plantacyanin and laccases. Furthermore, the expression of other laccases that are not predicted targets for known microRNAs was similarly regulated in response to copper. For some of these laccases, the regulation was disrupted in a microRNA maturation mutant (hen1-1), suggesting the presence of other copper-regulated microRNAs. Thus, in Arabidopsis, microRNA-mediated down-regulation is a general mechanism to regulate nonessential copper proteins. We propose that this mechanism allows plants to save copper for the most essential functions during limited copper supply.
In plants copper plays critical roles in photosynthetic and respiratory electron transport, oxidative stress protection, cell wall metabolism, and ethylene perception (1). Copper deficiency results in changes in root, stem and leaf architecture and visible chlorosis (1). At the cellular level copper deficiency results in reduced photosynthetic electron transport (2,3), a reduction of plastoquinone and pigment synthesis (4), and a disintegration of the thylakoid membrane (2,5). On the other hand, when copper is present in excess, plants develop toxicity symptoms such as an inhibition of root elongation (6). Toxicity symptoms in the shoot include decreased photosystem II function and an inhibition of chlorophyll synthesis that is accompanied by a reduction of the thylakoid membrane surface and generation of excess reactive oxygen species in the chloroplast (7).
The copper protein plastocyanin (PC)2 is one of the most abundant proteins in the thylakoid lumen (8,9) and in plants is essential for electron transfer between the cytochrome b6f complex and photosystem I. Arabidopsis mutants with insertions in both PC genes are seedling-lethal (10). A class of abundant intracellular copper proteins is formed by the Cu,Zn superoxide dismutase (SOD) enzymes, which function to catalyze the dismutation of superoxide radicals ( ) into H2O2 (11). Three genes encode for Cu,Zn-SOD in the Arabidopsis genome (12); CSD1 is active in the cytosol, CSD2 is active in the chloroplast stroma, and CSD3 is active in the peroxisome. CSD1 and CSD2 are the major isoforms in green tissue.
Much of the machinery involved in cellular copper uptake and intracellular distribution in plant cells has now been described. Particularly, the delivery of copper to the ethylene receptors and the photosynthetic machinery is well characterized (for reviews, see Refs.13 and14). copper enters plant cells via the COPT transporters and is subsequently delivered to plastocyanin in the thylakoid lumen and to CSD2 in the stroma by a machinery that includes two chloroplast-localized copper-transporting P-type ATPases and a metallo-chaperone for Cu,Zn-SOD (for review, see Ref.13). In chloroplasts, another SOD called FSD1 utilizes iron as the cofactor. copper availability was found to regulate the expression of CCS, CSD1, CSD2, and FSD1 in_Arabidopsis_ and other dicot plant species (15–17). When copper levels are sufficient, the Cu,Zn-SOD proteins are expressed, and FSD1 expression is shut-off. Conversely, when copper is limiting, CSD1 and CSD2 expression is down-regulated, and FSD1 becomes abundant. The down-regulation of CSD1 and CSD2 under copper limitation involves a microRNA,miR398, which is itself up-regulated under copper limitation (18).
MicroRNAs (miRNAs) are ∼21-nucleotide noncoding RNAs that function primarily as negative regulators at the post-transcriptional level in plants and animals. In flowering plants, miRNAs are major regulators of developmental processes such as flower, leaf, and root development (for review, see Ref.19). miRNAs have also been predicted or confirmed to regulate other processes such as responses to stress, pathogen invasion, and mineral nutrient homeostasis (19).
Among the secreted proteins that utilize copper are the laccases and plantacyanin. Laccases are four copper atom-containing glycoproteins which catalyze the oxidation of a suitable substrate molecule with the production of water and oligomers. The laccases comprise a multi-gene family in plants (20,21). In Arabidopsis, there are 17 annotated laccase genes that can be divided into four sub-groups (22). In each subgroup some of the genes are expressed in a constitutive fashion, and others are expressed in specific tissues at a particular stage of development (22). Proposed functions of laccases in plants include roles in lignin synthesis (23–26), wound healing (24), iron acquisition (27), response to stress (28), and the maintenance of cell wall structure and integrity (25). Plantacyanin is a plant-specific protein that contains a single copper ion and belongs to the phytocyanin family of secreted blue copper proteins (29). In Arabidopsis, plantacyanin is encoded by a single gene that is reported to be expressed in roots and in the inflorescence, particularly in the flowers where it may have a role in directing pollen tube growth in the style (30). Three additional miRNAs are predicted to target laccase and plantacyanin transcripts. The microRNAs_miR408, miR397_, and miR857 were identified by computational analysis and predicted to target members of the laccase gene family and plantacyanin mRNAs in Arabidopsis, rice, and poplar (31–36).
With respect to copper nutrition, we have proposed that the_miR398_-mediated down-regulation of Cu,Zn-SODs may allow plants to save copper for essential functions such as plastocyanin, which is active in green photosynthetic tissue. However, in relation to copper the expression of_miR398_ and its targets was only studied at the seedling level (18). It had not been shown yet that _miR398_-mediated down-regulation of Cu,Zn-SODs on low copper occurs before PC function becomes limiting to photosynthesis. Now three additional miRNAs, miR408, miR397, and miR857, are predicted to target the transcripts for other copper enzymes. In analogy to the regulation of Cu,Zn-SOD proteins by copper via miR398, the existence of additional microRNAs that target copper proteins suggests that a connection may exist between the abundance of these miRNAs and copper availability, which in turn may regulate the expression of the target genes. Although the presence of at least four copper-related miRNA families suggests a general mechanism for the regulation of dispensable copper proteins, a direct link has not been established between the new miRNAs and their targets; neither has a link between these miRNAs and copper nutrition been shown. Furthermore, unlike CSD1 and CSD2, plantacyanin and many of the laccases, which are predicted to be targeted by the above-mentioned miRNAs, have expression patterns that do not overlap with the major copper protein plastocyanin and, thus, would not compete for copper in the same cell. Nevertheless, reduced copper use outside of photosynthetically active tissue could help save copper for use in photosynthetic electron transport elsewhere in the plant.
To investigate the possible roles of the various copper-related miRNAs in copper homeostasis in both seedlings and mature plants, we grew_Arabidopsis_ hydroponically on three copper regimes that we termed copper-deficient, copper-limited, and copper-replete. Copper-deficient plants have insufficient copper to supply plastocyanin and as a consequence are affected in their photosynthetic electron transport capacity; these plants do not express Cu,Zn-SODs. Although copper-limited plants have reduced plastocyanin and very little Cu,Zn-SOD expression, copper supply is sufficient to allow near maximal electron transport. copper-replete plants have full plastocyanin and Cu,Zn-SOD function. Our data suggest a strong link between copper status and miR397, miR398, miR408, and miR857 throughout the plant as evidenced by an analysis of the expression patterns of these miRNAs and their target transcripts as well as target mRNA cleavage site analysis. Additional regulation through as yet undiscovered miRNAs may exist in response to copper. Plastocyanin transcript levels were not down-regulated by copper deficiency or limitation. We propose that copper-related miRNAs have systemic roles in plants to regulate the abundance of a number of copper enzymes in response to fluctuations in copper availability.
EXPERIMENTAL PROCEDURES
Plant Materials and Growth Conditions_—_Arabidopsis seeds (Col ecotype) were surface-sterilized and germinated on agar plates containing one-quarter strength MS medium (37) supplemented with 1% sucrose. This medium contains 0.025 μm CuSO4, a concentration that does not limit germination. Seedlings were grown in 12-h/12-h light/dark cycles at a light intensity of 120 μmol of photons m-2 s-1 and 23 °C. After 10 days, seedlings were moved to a hydroponic setup on 1/10× strength Hoagland's solution (38) and allowed to grow for 5 weeks as described (17). For growth under copper deficiency, copper was omitted from the medium (-Cu), whereas 5 nm (copper limitation) and 50 nm (copper replete) CuSO4 were added as copper treatments. All equipment used for the hydroponic setup were washed with 25 mm EDTA and rinsed repeatedly with double-distilled H2O to minimize copper contamination. Chemicals used for Hoagland's solution were of A.C.S. grade and were purchased from Fisher. The growth medium was replaced every 7 days and maintained daily with double-distilled H2Otocompensate for evaporation. After 2 weeks on hydroponics, shoots were harvested for expression analyses in the seedling stage. After 3 more weeks, tissues (root, leaf, stem, and flower) were collected separately for RNA and immunoblot analyses.
For analysis of the miRNA processing mutant, hen1-1, the wild type and mutant seeds were sown on synthetic MS agar plates containing 1% sucrose. For growth under copper deficiency, no copper was added to the medium (-Cu), whereas 5 μm CuSO4 was added as copper treatment (copper replete). Plants were grown for 3 weeks in 12 h/12 h light/dark cycles at a light intensity of 120 μmol of photons m-2 s-1 and 23 °C. All the plant materials were frozen in liquid nitrogen and stored at -80 °C until use.
Chlorophyll Fluorescence and Metal Ion Measurements_— Fluorescence analysis was done on plants that were grown on hydroponics for 5 weeks. Chlorophyll fluorescence was measured using a Hansatech Fluorometer FMS2 (Hansatech Instrument, Norfolk, UK) on overnight dark-adapted rosette leaves as described (17). The parameters Fv/Fm, ΦPSII, electron transport rate, and non-photochemical quenching were calculated as described (39). For elemental composition analysis, the leaves, stems, roots, and flowers of_Arabidopsis plants grown for 5 weeks in hydroponic culture were harvested separately, washed twice with 1 mm EDTA and once with double-distilled H2O, and dried at 65 °C for 48 h. 100 mg of dried sample was digested in 1 ml of nitric acid and heated for 2 h at 60 °C and then for 6 h at 130 °C. Digests were diluted to 10 ml with double-distilled H2O and analyzed using inductively coupled plasma-atomic emission spectrometry as described (17).
_Protein Extraction and Immunoblotting_—Total protein was extracted as described (16), and the protein concentration was determined according to Bradford (40) using bovine serum albumin as a standard. 20 μg of total protein was separated by SDS-PAGE and transferred to nitrocellulose membrane by electroblotting. Antibodies for immunoblot detection of PC (16) and SOD isoforms (12) have been described.
_RNA Extraction and Transcript Analysis_—Total RNA was extracted with the TRIzol reagent (Invitrogen) as described in the user's manual. For transcript analysis, 10 μg of total RNA was subjected to electrophoresis on a 1% agarose gel containing 4% formaldehyde, transferred to a nylon membrane, and probed with 32P-labeled probes. The probes for Northern blotting were obtained by PCR amplification using the PC2-F and PC2-R primers for plastocyanin, Planta-F, and Planta-R for plantacyanin and CSD2-F and CSD2-R for CSD2 (Table 1). Radioactive probes were synthesized with an oligo-labeling kit (Amersham Biosciences) using random primers. Hybridization and washing was performed as described (16). For small RNA blot analysis, 20 μg of total RNA was resolved on a denaturing 17% polyacrylamide gel and transferred electrophoretically to Hybond N+ (Amersham Biosciences) as described (18). A DNA oligo complementary to miR408 (5′-GCCAGGGAAGAGGCAGTGCAT-3′) was end-labeled with [γ-32P]ATP using T4 polynucleotide kinase (Fermentas, Hanover, MD). The blots were also analyzed with an oligonucleotide probe specific to U6snRNA (5′-TCATCCTTGCGCAGGGGCCA-3′) as an internal control. Membranes were prehybridized for 1 h and hybridized overnight using ULTRAhybo-oligo hybridization buffer (Ambion, Austin, TX) at 38 °C. Blots were washed and visualized using a PhosphorImager (Storm, GE Healthcare) as described (18).
TABLE 1.
Sequence of oligonucleotides used for PCR F, forward; R, reverse.
| Oligonucleotide | Primer sequences |
|---|---|
| PC2-F (AT1G76100) | 5′–ATGGCCTCAGTAACCTCAGCCAC–3′ |
| PC2-R | 5′–TTAGTTAACGGTGACTTTACCGA–3′ |
| CSD2-F (AT2G28190) | 5′–AAACGTCAAACATAGCAGCAG–3′ |
| CSD2-R | 5′–AGTAAACACATCACTGTCAT–3′ |
| miR397-F | 5′–TGAATGAACATCATTGAGTGC–3′ |
| miR397-R | 5′–TAGAAAAACATAATTGAGCGC–3′ |
| miR857-F | 5′–ACCTAAAGGTAGCGTGACTATTG–3′ |
| miR857-R | 5′–TCCGATTCCTACAATACACCTTC–3′ |
| Planta-F (AT2G02850) | 5′–TGTCTAGATCAAACCGCGGTGACTG–3′ |
| Planta-R | 5′–ATGGATCCATGGCCAAGGGAAGAGG–3′ |
| ACT2-F (AT3G18780) | 5′–ACCTTGCTGGACGTGACCTTACTGAT–3′ |
| ACT2-R | 5′–GTTGTCTCGTGGATTCCAGCAGCTT–3′ |
| LAC2.RACE-F (AT2G29130) | 5′–ATGGGCTCCCAGGTCCATTATAC–3′ |
| LAC2.RACE-R | 5′–ACCATCTCTCCCTCCCATCAATAG–3′ |
| LAC3.RACE-F (AT2G30210) | 5′–TCCTTCATTGCCCTACTTGCCTAC–3′ |
| LAC3.RACE-R | 5′–TCATAGCCGCTGGCTCAGAGCC–3′ |
| LAC4.RACE-F (AT2G38080) | 5′–TGTCTCTGACTCTCACATGATCAACG–3′ |
| LAC4.RACE-R | 5′–ACTCTCCTCCTCCCCAACAATCC–3′ |
| LAC5F (AT2G40370) | 5′–CTCTCAGAAATACTGTCGGTGTACCTGTTA–3′ |
| LAC5R | 5′–TTGAATAGAAGAACATGAAAAACTATAATG–3′ |
| LAC7.RACE-F (AT3G09220) | 5′–AGTTAGGGTTCCTATTGCTTGCGC–3′ |
| LAC7.RACE-R | 5′–GTCCATCTGCCCAAACCGTTAGT–3′ |
| LAC8F (AT5G01040) | 5′–ATGGGTTGTCCTCAGATTTATCGCTAATA–3′ |
| LAC8R | 5′–TGTCTCTCGTACAAATCAGTTCAAGCATT–3′ |
| LAC11F (AT5G03260) | 5′–CGCCTGAGAGAAACACCGTTGGAGTACCTA–3′ |
| LAC11R | 5′–CAGACACAAATCAACAGAAGGGAAATACAA–3′ |
| LAC12.RACE-F (AT5G05390) | 5′–TCGGCTTCATTGATTATCGCCAAAG–3′ |
| LAC12.RACE-R | 5′–TTGTGGTGGCACGCTCACAGCTC–3′ |
| LAC13.RACE-F (AT5G07130) | 5′–TTCACTTGTCAATGCAGAAGTTCAC–3′ |
| LAC13.RACE-R | 5′–TCTCATTATCCGCCCTCCGCTCTC–3′ |
| LAC15F (AT5G48100) | 5′–GGTGAGTGGTGGAAGAGGGATGT–3′ |
| LAC15R | 5′–TTGTAAAAAGGAAGGGTTGGGTAA–3′ |
| LAC17.RACE-F (AT5G6002) | 5′–TCCTGGTCCATTATACAACTGCTC–3′ |
| LAC17.RACE-R | 5′–AAACCGATACTCCCTGCTCTAAACGA–3′ |
| GeneRacer 5′ | 5′–CGACTGGAGCACGAGGACACTGA–3′ |
| GeneRacer 5′-nested | 5′–GGACACTGACATGGACTGAAGGAGTA–3′ |
_Quantitative Real-time PCR_—Ten μg of total RNA was treated with DNase I (Fermentas, Hanover, MD) to eliminate the residual genomic DNA present in RNA samples. One microgram of DNase-treated total RNA was then reverse-transcribed into cDNA using Moloney murine leukemia virus-reverse transcriptase (Promega, Madison, WI) according to the manufacturer's instructions and used in the amplification reaction directly after dilution. The amplification reactions were carried out with the LightCycler 480 SYBR Green 1 master mix on a LightCycler 480 (Roche Applied Science). PCR vessels (10 μl) contained the vendor's master mix, 0.5 μm concentrations of each primer, and cDNA corresponding to 20 ng input RNA in the reverse transcriptase reaction. The PCR conditions were 95 °C for 7.5 min followed by 40 cycles of 95 °C for 10 s, annealing temp (calculated Tm, -5 °C) for 10 s, and 72 °C for 30 s. The fluorescence was measured at each cycle at 72 °C. Melting curves were performed after the PCR reaction to assess the presence of a unique final product, and the products were also analyzed by gel electrophoresis. The cycle number at which fluorescence signals crossed the threshold (CT) value was determined. To compare data from different PCR runs or cDNA samples, CT values for all tested genes were normalized to the CT value of the ACT2 gene, a constitutively expressed “housekeeping” gene. The average CT value for ACT2 was 17.55 (±1.39) for all cDNA samples used in the experiments. Gene expression was normalized to ACT2 expression by subtracting the CT value of ACT2 from the CT value of the tested gene (ΔCT). Expression levels are given as 40-ΔCT, where 40 is arbitrary and was chosen because PCR runs were stopped at cycle 40. This presentation of expression levels corresponds to a logarithmic scale. -Fold differences in expression were obtained from the expression (1 +E)ΔΔCT, where E is the PCR efficiency, and ΔΔCT represents the ΔCT-I (condition one; for instance, no copper) minus ΔCT-II (condition two; for instance, copper-replete). The efficiency (E) of real-time PCR was determined for each primer set using a dilution series of the same cDNA and ranged between 1 and 0.97. The results presented are the averages of technical triplicates for two independent experiments. Primers used for amplification of miR397, miR857, and ACT2 are shown in Table 1. For laccases with predicted target sites for miRNAs, forward and reverse gene-specific primers were designed to flank the predicted cleavage sites (Table 1). For other laccases, gene-specific primers were designed to span the 3′-terminal intron and extend into the 3′-UTR downstream of the stop codon as described by McCaig et al. (22) (Table 1).
_miRNA Target Validation_—Target validation using a 5′-rapid amplification of cDNA ends (5′-RACE) assay was done using the GeneRacer kit (Invitrogen) as described (41–43). Total RNA was isolated from minus copper-grown tissue using the TRIzol reagent (Invitrogen), ligated to an adaptor, converted to cDNA, and subjected to PCR using the GeneRacer 5′ primer and a gene-specific reverse primer. Amplified products were subjected to another round of PCR using the GeneRacer 5′-nested primer and the same gene specific primer (Table 1). The PCR products were gel-purified and cloned using the TOPO-TA cloning kit (Invitrogen). A minimum of 12 clones were sequenced for each PCR product.
_Statistical Analysis_—Statistical analysis was performed using the Jump-in software package (SAS Institute, Cary, NC).
RESULTS
_Effects of Copper Feeding on Growth, Photosynthesis, and Copper Protein Accumulation_—To analyze expression in response to copper, we grew plants hydroponically under three copper regimes. Seeds from plants grown on well fertilized soil with normal copper levels were used. All seedlings were first germinated on MS agar media with 0.025 μm CuSO4, a copper concentration that is sufficient to support efficient germination. After 10 days on agar, the seedlings were transferred to a hydroponic setup with three different concentrations of copper added to the culture medium. To induce deficiency, no CuSO4 was added; plants under these conditions must utilize the copper present in the seeds plus copper acquired during the germination stage on agar plus any residual copper leached into hydroponic solutions from glassware or other containers. For copper-limited growth the culture medium was supplemented with 5 nm CuSO4, whereas 50 nm CuSO4 was used for copper-replete growth. It should be noted that copper is less bioavailable in agar-based media compared with the hydroponic culture medium. Therefore, 25 nm CuSO4 provided in agar media is close to deficiency, and Cu,Zn-SOD are not expressed under these conditions on agar, whereas in hydroponics this concentration would be sufficient for near maximal CSD1 and CSD2 expression.
PC protein levels and Cu,Zn-SOD and FSD1 protein and transcript levels are good indicators of the copper feeding status of plants (17). To get an indication of the copper status of the plants early in the rosette stage and after just 2 weeks on hydroponics, shoots were harvested for expression analyses (Fig. 1, A and_B_). After 2 weeks a clear effect was already seen of the treatments on copper protein expression. Arabidopsis has two genes that encode for plastocyanin, PC2 and PC1 (10). Both PC isoforms are detected by our antibody in seedlings on all three regimes, but the protein increased gradually with increasing copper concentrations (Fig. 1_A_). Although PC1 and PC2 are very similar in sequence (83% identity) and mass, the proteins can be distinguished by their electrophoretic mobility on denaturing gels (Ref. 10; see alsoFig. 4_A_). PC1, the isoform with a faster migration, was less affected by copper than was PC2, the more abundant isoform with a slower migration. We used the coding sequence of the more abundant PC2 as a probe for PC transcript detection. However, with the high sequence conservation between both PC genes, this probe will detect both PC1 and PC2 transcripts under our hybridization conditions. Although the level of PC polypeptide, especially PC2, was reduced on low copper, the transcript levels did not vary with copper concentration (Fig. 1_B_). In contrast, the protein levels of CSD2 were largely determined by the transcript levels (Fig. 1, A and_B_), in agreement with earlier observations (16,18). In plants supplied with no copper, the CSD2 protein was not detected. At sufficient copper supply (50 nm) the protein level of CSD2 reached the maximum. Elemental analyses by inductively coupled plasma-atomic emission spectrometry indicated that at this rosette stage, the copper level was not at the detection limit when no copper was added to the medium and increased significantly with copper addition from 0.61 μg/g dry weight at 5 nm copper to 6.2 μg/g dry weight at 50 nm copper. At the same time the levels of iron, zinc, and manganese did not vary significantly with the treatments (data not shown). These results indicate that the treatments already affected the copper status of the Arabidopsis plants at the rosette stage.
FIGURE 1.
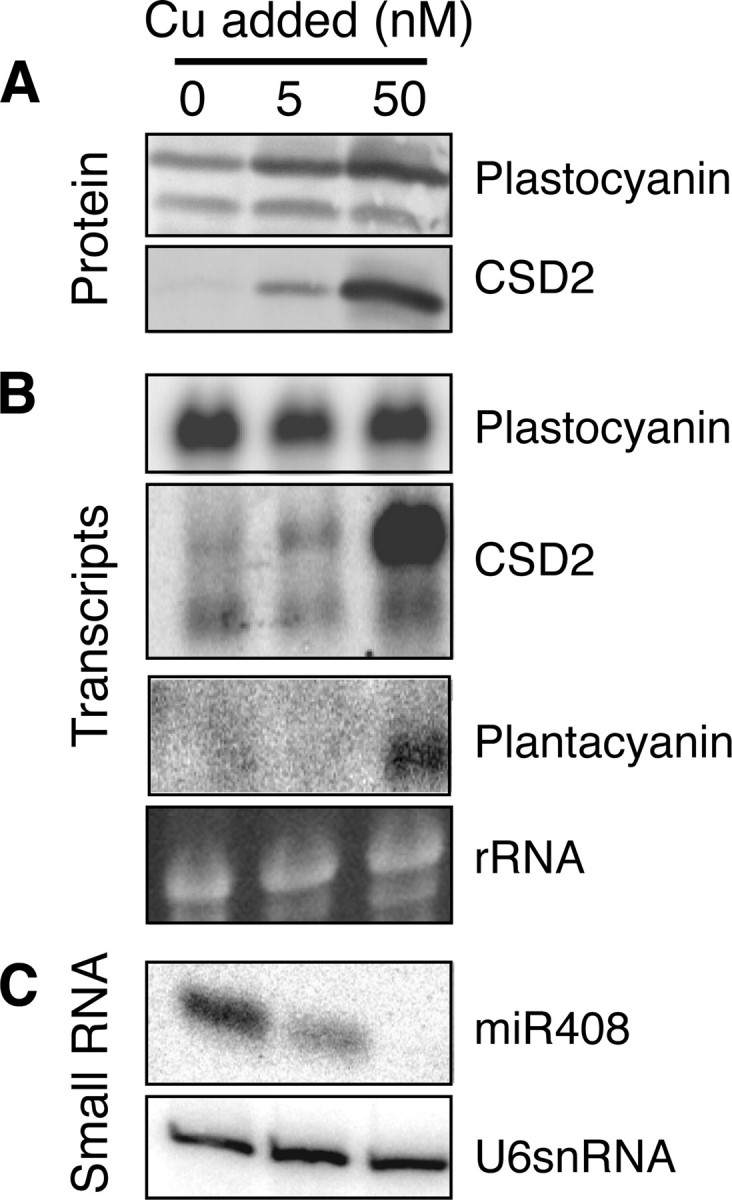
Expression analyses of copper proteins in young plantlets. A, immunoblot analysis. Total proteins (20 μg/lane) were extracted from seedlings grown hydroponically for 2 weeks at the indicated copper concentrations and fractionated by 15% SDS-PAGE. Each protein was detected by immunoblotting using a specific antibody. B and C, Northern analysis. 10 μg of total RNA was separated by electrophoresis, transferred to Hybond N+ membranes, and probed with 32P-labeled gene-specific probes.
FIGURE 4.

Expression analyses of plastocyanin and superoxide dismutases in hydroponically grown Arabidopsis plants at different copper concentration. A, immuno-detection of plastocyanin isoforms in wild type (WT) plants and in pc1 and pc2 mutants as well as a PC2 over-expressor (O/E). The mutants and over-producer were described before (10). Molecular masses are indicated on the left. B, Western blot analysis. Total soluble proteins (20 μg/lane) were extracted from different tissues (leaf, stem, root, and flower) of Arabidopsis plants grown hydroponically at different copper conditions and fractionated by 15% SDS-PAGE. Each protein was detected by immunoblotting using antibodies specific for the indicated proteins. C, Northern blot analysis. 10 μg of total RNA was separated by electrophoresis, transferred to Hybond N+ membranes, and probed with 32P-labeled gene-specific probes. -Cu, copper-deficient; 5 nm; copper-limited; 50 nm, copper-sufficient. D, immunoblot detection of components of the photosynthetic machinery in leaf tissue. The same leaf samples as in panel B were used and probed with the indicated specific antibodies. Antibodies for cytochrome f and PsaA/B (66), cytochrome b6 (67), PsaD (68), small subunit of Rubisco (69), and the loading control chloroplastic RRF (70) have been described. Specific antibodies for the D1 subunit of PSII and subunit A of ATP synthase were generous gifts from Alice Barkan (University of Oregon, Eugene, OR) and Anna Sokolenko (Ludwig-Maximilians University, München, Germany), respectively. Antibody for the large subunit of Rubisco was purchased from Agrisera (Agrisera, Vannas, Sweden).
After 5 weeks in hydroponics, plants had bolted and grown to a mature size with stems and flowers. At this stage the plants that had not received copper since germination showed clear symptoms of copper deficiency. Compared with copper-limited and copper-replete plants the deficient plants showed a reduction in biomass, a delay in bolting, and accelerated senescence. The copper-deficient condition produced visible chlorotic symptoms on leaves which appeared first at the tips of young leaves and then extended downward along the leaf margins (Fig. 2_A_). The leaves were also twisted and developed necrotic lesions (Fig. 2_A_). The plants supplied with 5 or 50 nm copper did not develop any of these symptoms.
FIGURE 2.

Effects of copper treatments in mature plants. A, visible symptoms in plants. Images of 5-week-old plants (upper) and of detached leaves at different developmental stages show the copper-deficiency symptoms (lower). B–D, content of copper, iron, and manganese. Metal ion accumulation (μg/g dry weight) in different tissues of_Arabidopsis_ plants grown in hydroponic cultures at different copper concentrations. Data shown represent the mean ± S.D.
We analyzed transition metal contents of separate tissues using inductively coupled plasma-atomic emission spectrometry (Fig. 2, B–D). Copper was increased significantly in all tested tissues with copper addition (Fig. 2_B_). Under replete conditions, the highest copper levels were observed in green tissues (leaf and stem), and the lowest level was observed in root tissues. In contrast, in deficient and copper-limited conditions, the concentration of copper in roots was less affected compared with other plant parts in particular the flowers, which had a much reduced copper content. No large changes in iron content were observed as a result of copper feeding (Fig. 2_C_). At 50 nm copper, a slight decrease in iron content (on average 1.5-fold lower compared with deficiency) was observed in stem, root, and flower tissues, but at the same time a slight iron increase was observed in leaf tissues (1.3-fold compared with deficiency). A high amount of iron was observed in root tissues (>100-fold more compared with other tissues) even though they were washed with 1 mm EDTA. Probably, much of this root-associated iron is extracellular, and the high accumulation may result from the hydroponic growth condition. The content of other metals, manganese (Fig. 2_D_), calcium, magnesium, zinc, and phosphorus (data not shown), was not influenced by external copper conditions.
To analyze how copper feeding affected photosynthesis in mature plants, we performed a quenching analysis (Fig. 3) and determined the light intensity dependence of four chlorophyll fluorescence parameters that are indicative of photosynthetic performance. The efficiency of photosystem II (PSII) antennae, Fv/Fm, was not significantly different between treatments for dark-adapted plants, suggesting that the intactness of PSII is not affected by copper feeding (not shown). However, during actinic illumination plants with copper deficiency showed decreased relaxation of fluorescence indicative of a defect in photosynthetic electron transport. The effect was more pronounced at higher light intensities (Fig. 3_A_). Saturating pulses were used to calculate chlorophyll fluorescence parameters that give a quantitative estimate of photosynthetic performance in the light. The PSII electron transport rate was drastically reduced in the copper-deficient condition (Fig. 3_B_). The electron transport rate of deficient plants was about half that under copper-limited or -sufficient conditions and was saturated at a much lower light intensity. Non-photochemical quenching, a measure of photoprotective feedback deexcitation of excess light energy, which depends on the generation of a ΔpH across the thylakoid membrane (44), was also significantly reduced under copper-deficient conditions (Fig. 3_C_). Interestingly, non-photochemical quenching was the only chlorophyll fluorescence parameter that indicated a significant difference between copper-limited and copper-replete plants (Fig. 3_C_). The 1-qP parameter gives an indication of the oxidation state of the quinone pool (45). Under copper-deficient conditions,1-qP indicates a more reduced state of the quinone pool at all light intensities compared with plants grown under limited and sufficient copper conditions (5 and 50 nm copper) (Fig. 3_D_). These observations are consistent with a lack of PC function in copper-deficient plants but not in copper limited plants. Similar symptoms were observed for_paa1_ and paa2 mutants that have defects in copper delivery to PC in Arabidopsis chloroplasts (3,16). After switching off the actinic light, the photosynthetic antennae did not relax in copper-deficient plants (Fig. 3_A_), suggesting that they did not tolerate the high light.
FIGURE 3.
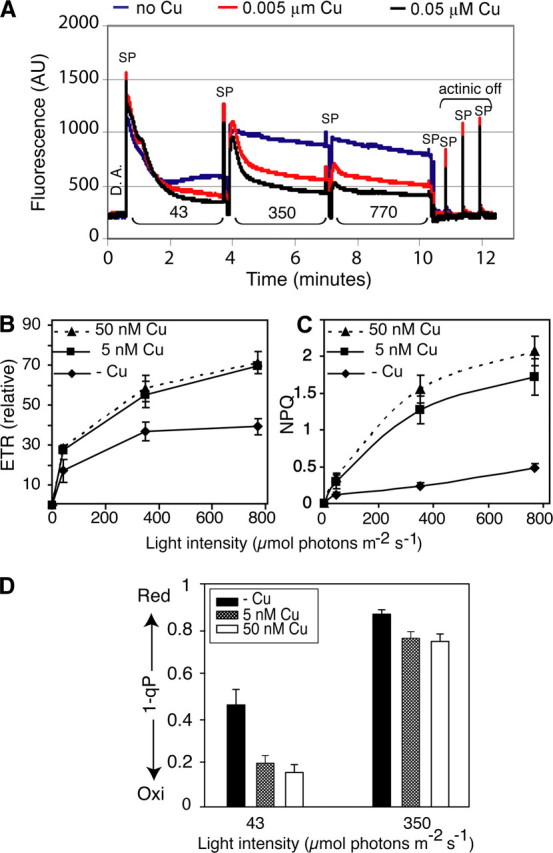
Chlorophyll fluorescence analysis. A, chlorophyll fluorescence traces from detached rosette leaves. Dark-adapted rosette leaves were exposed to a saturating light pulse (SP) (2050 μmol of photons m-2 s-1) to estimate Fv/Fm (PSII antennae efficiency). Light-adapted parameters were determined at the indicated actinic light intensities of 43, 350, and 770 μmol photons m-2 s-1 using saturating pulses (SP). A far-red illuminating pulse was initiated after each saturating pulse to establish initial fluorescence (_Fo_′). Actinic light was switched off, and relaxation of the photosystem was recorded. DA, dark adapted; AU, arbitrary units. B–D, light intensity dependence of chlorophyll fluorescence parameters. B, the relative electron transport rate (ETR) at the indicated light intensities (43, 350, and 770 μmol of photons m-2 s-1) was calculated according to Maxwell and Johnson (39). C, light intensity of non-photochemical quenching (NPQ). D, redox state level of the primary quinone-type electron acceptor, QA, of PSII was determined by a chlorophyll fluorescence parameter, 1-qP. Each point represents the mean ± S.D. (n = 5).
Plastocyanin and CSD2 protein and transcript levels as well as CSD1 and FSD1 protein levels were analyzed in different tissues (leaf, stem, root, and flower) of the mature plants to give an idea of copper feeding at the molecular level. Because our PC antibody detects three bands in mature tissue, we used previously described knock out mutants for PC1 and PC2 as well as a PC2 over-producer (10) to identify individual bands (Fig. 4_A_). This analysis indicates that the upper band corresponds to PC2, and the lower band represents PC1. The weaker band that is visible in mature plants at an intermediate position between PC2 and PC1 is unrelated. As expected, PC protein and transcript was only detected in green tissues. In root tissues, neither PC transcripts nor polypeptides were detected (Fig. 4, B and_C_). PC protein levels increased gradually with increasing copper concentrations. Compared with seedlings, the PC level was more affected by low copper in mature plants, especially in the flowers. Interestingly, PC2 is more affected than PC1 by the abundance of copper. Although the level of PC polypeptide increased with copper feeding, the transcript was not significantly changed in response to copper (Fig. 4_C_). CSD1 and CSD2 could be detected in all tissues as long as sufficient copper was present. In plants supplied with no copper or limited copper (5 nm), CSD1 and CSD2 proteins were not or were barely detectable, whereas FSD1 showed high accumulation in all tested tissues. At high copper supply (50 nm) the protein level of FSD1 was diminished.
Overall, the results presented in Figs.2,3,4 indicate that copper omission causes severe copper deficiency and underscore the importance of copper for photosynthetic efficiency. On the other hand, plants treated with 5 and 50 nm copper were physiologically comparable even though Western analysis indicated that PC protein levels were reduced in copper-limited_versus_ copper-replete plants. The comparison of the copper-limited and copper-replete plants suggests that a small amount of PC (Fig. 4_B_) is enough for efficient photosynthesis (Fig. 3) and that more PC protein accumulation depends on the presence of the copper cofactor (Fig. 4_B_). Compared with PC, the effect of copper limitation on CSD2 and CSD1 expression is much more severe (Fig. 4_B_). Under limitation and impending deficiency, the delivery of residual copper seems to be prioritized to PC over Cu,Zn-SODs, of which the expression is reduced, even in roots where no PC is expressed. The CSD1 and CSD2 proteins are apparently dispensable under these conditions.
The reduction in electron transport efficiency in mature leaves of plants grown on low copper (Fig. 3) could be explained by a loss of PC function (Fig. 4_B_). To test if copper also affects the abundance of other components of the photosynthetic apparatus in leaves, we analyzed the abundance of proteins in Photosystem-I, Photosystem-II, the cytochrome-b6f complex, ATP synthase, and Rubisco by immunoblot analysis of the same samples (Fig. 4_D_). This analysis shows that the effect of copper feeding is specific to PC and SOD proteins and none of the other components of the photosynthetic machinery are affected.
miR408, miR397, and miR857 Target Transcripts for Copper-Containing Proteins_—_miR408 and miR397 are miRNAs that were discovered in Arabidopsis, rice, and poplar and are also conserved in other flowering plants (31,32,34,35,46). miR857 was recently discovered in Arabidopsis and is not conserved in other flowering plants (36). In_Arabidopsis, miR408_ is a one-gene family localized to chromosome II and predicted to target the coding sequences of plantacyanin, LAC3, LAC12, and the 5′-UTR of LAC13 (Fig. 5). The miR397 family consists of two genes,miR397a and miR397b (both localized to chromosome IV), and is predicted to target the fifth exon of LAC2, LAC4, and LAC17 (Fig. 5). The sequence of mature miR397a and miR397b are only different in one nucleotide. miR857 is a single gene localized to chromosome IV and predicted to target the first exon of LAC7 (Fig. 5). A 5′-RACE analysis was done to detect cleavage events at predicted sites in transcripts and, thus, directly link miRNAs to their mRNA targets. The 5′-RACE assays were done using specific primer sets with RNA isolated from plants grown on low copper. Sequence analyses were done on the 5′-RACE products that correspond to the transcripts, which are predicted targets for the miRNAs. As summarized in Fig. 5, most targets could be validated since cleavage products were observed close to the nucleotide that is opposite nucleotide 10 of the small RNA, counting from the 5′ end (Fig. 5). In LAC17 only 1 of 16 sequenced clones was cleaved in this region, at a position corresponding to nucleotide 13 of the small RNA.
FIGURE 5.

Experimental validation of the predicted mRNA targets for miRNAs (miR408, miR397, and miR857). The mRNA cleavage sites were determined by modified 5′ RNA ligase-mediated RACE. The_gray boxes_ represent the exons, and the horizontal lines represent introns. White boxes represent 5′-UTRs (if known), and white arrows represent 3′-UTRs (if known). The mRNA sequences and complementary miRNA sequences are shown. Vertical arrows indicate the 5′ termini of miRNA-guided cleavage products, as identified by 5′-RACE, with the frequency of clones shown. Watson-Crick pairing (vertical dashes) and G:U wobble pairing are indicated. Horizontal arrows indicate primers used for qRT-PCR.
miR408, miR397, and miR857 Expression Is Regulated in Response to Copper Availability_—It has been shown that miR398, which targets Cu,Zn-SODs and Cox5b-1, is regulated in response to copper (18). miR408, miR397, and miR857 target transcripts for other copper-containing proteins. Therefore, we were interested to test if these miRNAs and, as a consequence, their targets are also regulated in response to copper availability. Northern blotting using a miR408 probe indicated that the transcript was accumulated on low copper media both in young plants (Fig. 1_C_) and mature plants (Fig. 6_A_). In copper-replete plants almost no miR408 was observed. In the younger plants a difference in miR408 accumulation was observed between copper-deficient and copper-limited plants. However, in mature plants_miR408 accumulated to comparable levels for copper-deficient and copper-limited plants. The higher expression of miR408 in mature copper-limited plants compared with the 2-week seedlings grown for 2 weeks on hydroponics may indicate a reduced copper level in the mature plants under these conditions.
FIGURE 6.

Expression analysis of miR408 and predicted targets. A, Northern blot analysis of miR408 and U6snRNA. 20 μg of total RNA from different tissues was separated by electrophoresis, transferred to Hybond N+ membrane, and probed with complementary sequences of_miR408_ that were end-labeled with [γ-32P]ATP. The U6snRNA probe was used as an internal control for Normalization. B, Northern blot analysis of plantacyanin. 10 μg of total RNA was separated by electrophoresis, transferred to Hybond N+ membranes, and probed with32P-labeled plantacyanin PCR product. A 18 S rRNA Northern blot is shown as an internal control for loading. The intensity of bands was quantified and normalized with the internal control. C–E, quantitative real-time PCR expression levels of LAC3, LAC12, and LAC13. DNase-treated total RNA was reverse-transcribed into cDNA and used as a template for qRT-PCR. Expression levels are expressed as 40-ΔCT, where ΔCT is the difference in quantitative real-time PCR threshold cycle number (CT value) between the studied gene and the reference gene (ACT2). The number 40 was chosen because the PCR run stops after 40 cycles. A value of 40 indicates that the expression is equal to that of ACT2. The average CT value for_ACT2_ in all runs is 17.55 (±1.39). The results are the mean ± S.D. for technical triplicates of two independent experiments. On the_right side_ of the graphs a log scale is given to allow visual comparison of relative expression levels.
The other two miRNAs, miR397 and miR857, were analyzed by quantitative real-time PCR (qRT-PCR) because they could not be detected by Northern blotting. For miR397, we used primers that can amplify both_miR397a_ and miR397b precursors since the precursors are identical in the 5′ and 3′ termini (Table 1). The qRT-PCR analyses (Figs. 7_A_ and8_A_) revealed that_miR397_ and miR857 were highly accumulated in all tested tissues of the mature plants that are copper-deficient or supplied with limited copper and were at very low levels in tissues from copper-replete plants. In response to low copper the transcript levels of miR397 and_miR857_ were more strongly increased in stem and root tissues (1000–8000-fold) compared with leaf and flower tissues (200–250-fold) (Figs.7_A_ and8_A_). miR397 and miR857 expression was also strongly induced in young plants and seedlings grown on low copper (results not shown). In summary, miR408, miR397, and miR857 are ubiquitously expressed in all tested tissues in mature plants as well as in seedlings and are negatively regulated by copper availability. Similar induction by low copper was previously observed for miR398 (18).
FIGURE 7.

Quantitative real-time PCR expression levels of miR397 precursor (A), LAC2 (B), LAC4 (C), and LAC17 (D) in different tissues grown at deficient (-Cu), limited (5 nm), and sufficient (50 nm) copper conditions. Expression levels are given as described in the legends toFig. 6, C–E.
FIGURE 8.
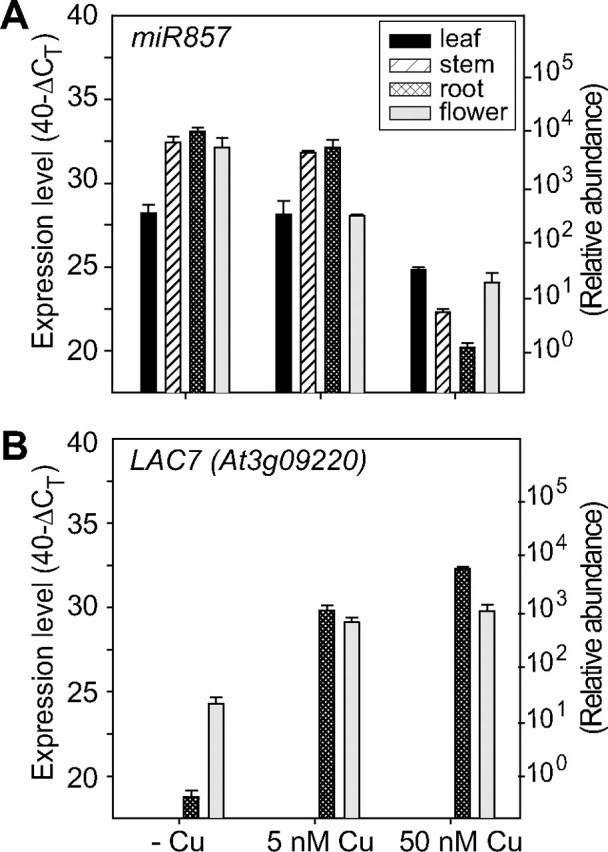
Quantitative real-time PCR expression levels of miR857 precursor (A) and its target LAC7 (B) in different tissues grown at deficient _(_-Cu), limited (5 nm), and sufficient (50 nm) copper conditions. Expression levels are given as described in the legends toFig. 6, C–E.
Plantacyanin and Laccase Gene Expression Is Negatively Correlated with miRNAs Expression_—Negative correlations between miRNAs and their target mRNAs have been observed for many genes as shown for miR398 and its targets, CSD1 and CSD2 (18,47). A bioinformatics analysis of the Arabidopsis genome and target validation analysis (Fig. 5) have suggested that_miR408 targets the mRNA of plantacyanin, LAC3, LAC12, and LAC13, whereas the miR397 family targets LAC2, LAC4, and LAC17 (32), and miR857 targets LAC7 (36). In February 2008 no other laccases were predicted as targets for miRNAs in the ASRP data base (asrp.cgrb.oregonstate.edu/db/search_sRNA_seq.html). There are 17 annotated laccase genes in the Arabidopsis genome. The coding sequences of these genes are highly conserved, and a number of them are only expressed at low levels and are difficult to be detected and distinguished by Northern blotting (22). Therefore, quantitative real-time PCR using gene-specific primers was employed to analyze the expression of the laccase genes, whereas Northern blotting was used for the expression analysis of plantacyanin. In real-time PCR, the number of cycles required to reach a threshold CT was compared with a reference transcript, and this information is effectively presented in Figs.6,7,8,9,10. The CT is inversely proportional to the logarithm of the amount of the template present at the start of a PCR (48). To allow a comparison of relative expression levels of transcripts, we added a log scale on the right of the parts of Figs.6,7,8,9,10 with qRT-PCR data.
FIGURE 9.

Quantitative real-time PCR expression levels of LAC5 (A), LAC8 (B), LAC11 (C), and LAC15 (D)in different tissues grown at deficient (-Cu), limited (5 nm), and sufficient (50 nm) copper conditions. Expression levels are given as described in the legends toFig. 6, C–E.
FIGURE 10.

Effect of the hen1-1 mutation. Upper panel, immunoblot analysis of PC, CSD1, CSD2, and FeSOD. Hsp70 was use as a loading control. Lower panel, quantitative real-time PCR expression levels of LAC5, LAC8, LAC11, and LAC15 in wild type (WT) and miRNA maturation mutant (hen1-1) seedlings grown on synthetic MS agar plates with no added copper (-Cu) or with sufficient copper (5 μ_m Cu_) for 3 weeks. The whole seedling (root and shoot) was collected and used for total RNA preparation. 1 μg of total RNA was treated with DNase and reverse-transcribed into cDNA. The cDNA was used as a template for qRT-PCR directly after dilution. Expression levels are given as described in the legends to Fig. 6,C–E. The average CT value for_ACT2_ in all PCR runs is 16.5 ± 0.24. The results are the mean ± S.D. for technical triplicates of two independent experiments.
Although miR408 was down-regulated by copper supply (Fig. 5_A_), the transcripts of the miR408 target genes plantacyanin, LAC3, LAC12, and LAC13 were all found to be accumulated when the copper concentration in the growth medium was increased. The highest expression of plantacyanin, LAC3, LAC12, and LAC13 was seen in plants grown at 50 nm copper, the concentration at which the miR408 expression was lowest (Fig. 1_C_ andFig. 6_A_). Tissue-specific differential expression patterns were observed for the_miR408_ targets. When copper supply was sufficient, plantacyanin was expressed particularly in the roots and flowers of mature plants, and it was also detected in shoots of younger plants. However, in mature plants plantacyanin transcript levels were relatively low in leaves and stems. Similar to plantacyanin, the transcripts of LAC3 and LAC13 were much more abundant in roots compared with other tissues. The transcripts of these genes were increased between 2- and 10-fold with copper supply. With sufficient copper, an accumulation of the transcript for LAC12 was observed in all tested plant parts. However, copper limitation and deficiency affected LAC12 particularly in the leaves (Fig. 6_D_). In contrast, the effect of copper on LAC12 and LAC13 expression in flowers was very small (Fig. 6, D and E).
The expression of LAC2, LAC4, and LAC17, all predicted targets for_miR397_, was also inversely correlated with the expression pattern of_miR397_ (Fig. 7). Their expression is induced in the presence of sufficient copper supply. The transcripts of these copper proteins were also differentially accumulated in the tested tissues with sufficient copper supply. Overall, the expression of LAC2, LAC4, and LAC17 genes in leaves is very low compared with other tissues (the CT is reached <10 cycles later in leaf compared with other tissues at all tested conditions). Therefore, compared with other tissues, leaves contain about 1000× less transcript. LAC2 and LAC17 are highly expressed in stem, root, and flower tissues and showed only moderate induction by copper supply (6–36-fold for LAC2 and 4–16-fold increase for LAC17) (Fig. 7, B and_D_). Similarly, LAC4 was particularly abundant in stems and flowers. In roots the expression of LAC4 is strongly regulated by copper supply with a >20,000-fold increase on sufficient copper compared with deficiency.
LAC7 is targeted by miR857 (Fig. 5). Expression analysis (Fig. 8_B_) indicated that LAC7 is expressed only in roots and flowers and that its expression level increases with increasing copper in the growth medium (Fig. 8_B_). The high accumulation of the LAC7 transcript at sufficient copper supply in roots and flower tissues corresponds to a reduction in the miR857 transcript (Fig. 8_A_). In conclusion, the results presented in Figs.6,7,8 clearly show an inverse correlation between miRNAs (miR408, miR397, and miR957) and the mRNA levels of their targets in Arabidopsis.
To gain insight into the regulation of other laccases that are not predicted as targets for known miRNAs in the ASRP data base, we analyzed the expression of some other members of laccase gene family (LAC5, LAC6, LAC8, LAC11, LAC15, and LAC16) in the same RNA samples using qRT-PCR. Because the coding sequence of laccases is conserved, we used primers that span the 3′-terminal intron and extend into the 3′-UTR (Table 1). No amplification products were detected for LAC6 and LAC16 in any of the tested tissues (data not shown), suggesting that perhaps these laccases are expressed at very low levels under these conditions. The other laccase genes can be grouped in two groups based on their expression in different tissues. The laccases LAC5, LAC11, and LAC15 are ubiquitously expressed, and their transcripts levels were moderately affected by copper availability in the growth medium (Fig. 9, A, C, and_D_). The strongest induction was observed for LAC15 with a 5–60-fold higher expression at 50 nm copper compared with the no copper condition. LAC8 is expressed mainly in roots, whereas lower transcript levels were seen in flowers (Fig. 9_B_). The transcript of LAC8 is dramatically affected by copper in the growth medium. These observations indicate that at least some laccases without predicted miRNAs are regulated in response to copper supply.
To investigate if small RNAs mediate the response to copper for these laccases, we employed the miRNA processing mutant, hen1-1. The Hua Enhancer (HEN1) protein is responsible for the methylation of miRNA/miRNA* duplexes which are loaded onto the RISC complex to degrade target RNAs (19,49). hen1 mutants exhibit reduced abundance of miRNAs, a wide array of developmental defects, including reduced leaf size, altered leaf shape, and reduced plant height (50,51). Because the_hen1-1_ mutant has a poor growth rate and proved difficult to grow in a hydroponic setup to maturity, we analyzed the expression in seedlings grown on synthetic MS agar media without added copper or with 5 μm copper added, which is sufficient to down-regulate the expression of_miR398_ and does not give toxicity symptoms (18). Under the growth conditions that were used we observed little effect on PC levels, whereas CSD1, CSD2, and Fe-SOD protein levels were regulated by copper as expected in the wild type (Fig 10,upper panels). The hen1 mutant over-accumulated CSD1 and CSD2, especially on low copper. The protein levels of PC and Fe-SOD were not altered in the hen1 mutant relative to the wild type. The expression of FeSOD, which is a very good indicator of copper status and which is not targeted by a miRNA, indicates that copper homeostasis is not drastically altered in the hen1 mutant under these experimental conditions. The transcript accumulation of LAC5, LAC8, and LAC15 was clearly regulated by copper supply in the wild type (Fig 10, lower panel). In contrast, the transcript of LAC11 was not affected by copper in the seedlings. For LAC11 and LAC15 transcripts the effect of the hen1-1 mutation was very small. The available data indicate that LAC11 expression is constitutive with limited regulation by copper. Interestingly, the transcripts of LAC5 and LAC8 were accumulated independent of copper supply in the hen1-1 mutant and to higher levels when compared with the wild type. Thus, LAC5 and LAC8 expression was de-regulated in the hen1-1 mutant, which suggests that a miRNA regulates the accumulation of these two transcripts in wild type plants.
DISCUSSION
Several microRNAs, miR397, miR398, miR408, and miR857, are predicted to target copper proteins (Refs.31,32,34–36, and 52 andFig. 5). The targets include Cu,Zn-SODs, a subunit of cytochrome-c oxidase, plantacyanin, and the laccase gene family. Previously we reported that miR398 is regulated predominantly in response to low copper and that miR398 up-regulation results in reduced expression of the copper enzymes CSD1 and CSD2. Here we report that also miR397, miR408, and miR857 are accumulated when copper is limiting and disappear under conditions when copper is sufficient (Fig. 6_A_,7_A_, and8_A_). On the other hand, the transcripts of their predicted target genes are regulated in a reciprocal manner (Figs. 6,7,8). Furthermore, we analyzed the expression of the miR398 targets CSD1 and CSD2 in mature plants and found that transcripts of these enzymes are present in all plant parts as long as copper is present (Fig. 4). Plastocyanin is expressed in green tissue, and the protein level is affected by copper. However, PC transcript levels are not down-regulated on low copper in marked contrast to the transcripts for CSD1, CSD2, plantacyanin, and most tested laccases. A direct link was already established between miR398 and its targets. Now such a link was made for miR397, miR408, and miR857 and their predicted targets in two ways. First, for several mRNA targets, cleavage products were identified that corresponded to positions where the miRNA was predicted to direct cleavage (Fig. 5). Second, in response to copper, miR397, miR408, and miR857 show expression patterns that are reciprocal at least in the majority of the tissues that were analyzed with their predicted targets. Interestingly, the spatial expression patterns for the copper-regulated miRNAs indicate that they are present throughout the plant. This is especially evident for_miR408_, for which the mature miRNA was detected and found to be abundant in young plants and all tested parts of mature plants as long as copper was low (Figs.1_C_ and6_A_). For_miR397_ and miR857 where we measured the precursors, abundant expression was again found in all plant parts on low copper albeit expression in leaves seemed a little lower particularly for miR587, which targets a laccase (LAC7), that we did not detect in leaves or stems (Fig.7_A_ and8_A_).
The spatial expression pattern for plantacyanin, a major target of_miR408_, has been analyzed by promoter-GUS fusions, and the promoter was found to be particularly active in the root and flowers (30). This expression pattern nicely matches the expression of plantacyanin found in our studies in the presence of copper. Data on the promoter activities of the laccase genes are not available. Previously, the expression of the laccase gene family had been studied by conventional RT-PCR (22). Overall, the spatial expression patterns that we found for the laccases nicely match the expression reported by McCaig et al. (22). However, whereas McCaig_et al._ (22) found LAC12 to be restricted to stems, we found LAC12 expression to be more ubiquitous. The difference may be due to the use of a more quantitative real-time PCR method. The available data suggest that the observed patterns of plantacyanin and laccase transcript accumulation can be the result of a combination of tissue-specific promoter activity combined with miRNA-mediated regulation by copper availability. The drastic regulation of miRNAs in response to copper seems sufficient to fully explain the response to copper of the target genes. However, we cannot at this point exclude a contribution of the promoters of plantacyanin and laccases in response to copper.
The laccases form a multigene family in all plants studied, and in_Arabidopsis_ it comprises 17 members (22,53). In total, seven members of the laccase family were predicted as targets for miR408, miR397, and miR857. Although the nucleic acid sequence of laccases is highly conserved in the Arabidopsis genome, the miRNA-target sequences are divergent among different laccases (data not shown). Searching of the_Arabidopsis_ ASRP data base for small RNAs that are identical or similar to sequences in a predicted gene revealed that none of the other laccases are predicted targets for presently known miRNAs in the data base. Nevertheless, other members of the family showed a similar regulation pattern (Fig. 9). Disruption of the regulation of LAC5 and LAC8 in the miRNA biogenesis mutant (hen1-1) suggests that other miRNAs might exist that target other laccase mRNAs. In part this regulation could be in response to copper. Further experiments are required to resolve the regulation of these laccases.
Why do plants down-regulate certain copper proteins using this miRNA mechanism? We hypothesize that higher plants prioritize the delivery of copper to PC and other essential copper proteins by down-regulation of nonessential or replaceable copper-containing proteins. This could be an essential part of the copper homeostasis mechanism that allows plants to cope with variable copper supply and that, therefore, broadens the range in which plants can thrive. CSD1, CSD2, and CoX5b-1 a subunit of cytochrome c oxidase, are down-regulated by miR398 under limited copper supply (18). miR408, miR397, and miR857 together regulate plantacyanin and a number of laccases. Additional laccases may be regulated by, thus far, unidentified small RNAs. Differential regulation of laccases in different tissues by miRNAs in response to copper may well contribute to the economy of copper use in plants. Notably, many but not all laccases were copper-regulated. The ubiquitous expression of LAC11 in all tissues even at limited copper supply suggests that this laccase might have a housekeeping function (Fig. 9). Furthermore, in flowers, sometimes a weak negative correlation was seen between miRNA levels and the abundance of the target laccase transcript. This was particularly evident for transcripts of LAC12 and LAC13, which changed only little in response to copper in flowers despite the large difference in miR408 abundance (Fig. 6). However, these two laccases were found to be copper-regulated in other tissues. The reason for the apparent altered sensitivity of some of the laccase transcripts to their cognate miRNA in certain tissues is not clear at this point. Flowers are composed of multiple cell types, and not all cells in flowers are connected by plasmodesmata. Therefore, we cannot exclude that spatial differences exist between miRNA expression patterns within the flower.
Copper enters the plant cell via a family of high affinity copper transporter proteins (COPT) (54). Inside the cell copper is targeted to different compartments via small copper chaperones to be used as a cofactor for various copper proteins. Once taken up into the root, copper, like other minerals, is loaded into the xylem sap where it is translocated to different tissues. Because of their sessile lifestyle, plants have evolved various responses to cope with copper fluctuation in the local soil. The first strategy is to improve copper acquisition by increased expression of high affinity root copper transporters. The expression of COPT1 and COPT2 is negatively regulated by copper (for review, see Ref.14). CCH, a copper chaperone in Arabidopsis, is also up-regulated in response to copper limitation and down-regulated by adding copper to the medium (55). copper acquisition also involves copper recycling. CCH and AtCCS mRNAs accumulate to higher levels after the start of leaf senescence, suggesting that these copper chaperones play roles in recycling copper from senescing leaves (15,55,56). The second strategy is to use proteins that do not depend on copper as a cofactor and that can perform similar or overlapping functions. The reciprocal regulation of Cu,Zn-SODs and FSD1 in Arabidopsis exemplifies this strategy in plants. Under low copper conditions, FSD1 mRNA, protein, and activity levels dramatically increase, whereas CSD1 and CSD2 are barely detectable (Fig. 1). The third mechanism is to prioritize the use of copper in essential versus dispensable pathways.
PC is indispensable in higher plants, and therefore, copper delivery to PC should be a priority. Arabidopsis mutants with insertions in both PC genes are seedling-lethal (10). No miRNA was predicted to target the PC transcript in Arabidopsis, and the level of PC mRNA does not depend on the copper concentration, although the protein level accumulated with increasing copper in the medium (Fig. 4). The available data suggest that PC accumulation in Arabidopsis depends on the level of translation or protein stability. In paa1 and paa2 mutants, defective in copper delivery to the lumen of the thylakoids, lower PC protein levels were observed, and most of that PC polypeptide was in the apo form (16). We propose that the availability of copper in the thylakoid lumen determines PC accumulation as the apo form is likely susceptible to breakdown. Indeed, it has been shown in_Chlamydomonas_ that apoplastocyanin, without its cofactor, is a target for proteolytic breakdown (57). Plastocyanin is not only essential, in plants it is also one of the most abundant copper-containing proteins. In Arabidopsis, direct measurements indicated that a third of the copper in green plant cells is present in the chloroplast (3), and about half of that is in the thylakoids, presumably in plastocyanin. Western blot experiments have indicated that the expression of CSD1 and CSD2 is comparable with PC in copper-replete plants.3 This would mean that about half the copper in green tissues is found in these three proteins, and it would mean that CSD1 and CSD2 are sizeable sinks for copper. Thus, Cu,Zn-SOD down-regulation on low copper would indeed contribute to maintaining a copper pool for PC. However, because much copper is still likely to be bound by proteins other than PC and the Cu,Zn-SODs, it would make sense to down-regulate additional copper proteins as is done via miR397, miR408, and miR857. The observation that the copper-related miRNAs are up-regulated already in a condition where symptoms of deficiency are still absent and where PC function in electron transport is not compromised supports the idea that these miRNAs are utilized in a response to impending deficiency.
Whereas in higher plants PC is essential, this is not the case in all photosynthetic organisms as some algae and cyanobacteria can functionally replace PC by expressing cytochrome-c6. Plants do not have this functional homologue (10). In_Chlamydomonas_, copper deficiency induces proteolysis of PC (57). In the Cyanobacteria_Synechocystis_ and Anabaena, the PC gene responds to copper at the level of mRNA through transcription initiation (58,59). Thus, copper protein regulation in response to copper seems to be a general phenomenon even though the targets and mechanisms may be different.
Other miRNAs whose expression is regulated by nutrient availability have been described in the literature. miR395 regulates sulfate assimilation and allocation by targeting the APS enzyme and a sulfate transporter, SULTR2;1 (31,32,60). miR399 is induced in response to phosphate starvation. During P-starvation,miR399 down-regulates its target transcript, which encodes a ubiquitin-conjugating E2 enzyme that in turn is required for the turnover of a phosphate transporter (61,62). Interestingly, in grafting experiments, miR399 was shown to be a phloem-mobile long-distance signal for the regulation of Pi homeostasis, suggesting a role of miRNAs in systemic nutrient homeostasis (63). Recently a miRNA that is predicted to target a Zn transporter of Arabidopsis thaliana 1 (ZAT1) was found (36).
The observations on miRNA-mediated regulation of sulfur and phosphate homeostasis raise additional questions when we look at miRNA-mediated copper homeostasis. First of all, the presence of miR399 in the phloem of P-starved plants suggests that by analogy copper homeostasis could also have a systemic component. In this context it is highly interesting that_miR408_ was detected in the phloem of copper starved Brassica napus plants (64). Second, whereas the miRNAs involved in sulfur and phosphate homeostasis target the machinery responsible for assimilation, in the case of copper homeostasis the miRNAs target copper proteins. Furthermore, it is striking that this mechanism only seems to be used for copper and not for other trace elements such as iron and manganese. Perhaps because copper is known to bind very tightly to its target polypeptides, these sinks must be eliminated if possible when copper is limiting. Furthermore, it may be a factor that, relative to other metal ions, copper metabolism evolved late in the history of life after oxygen became abundant (65), and therefore, perhaps many copper enzymes are as a consequence less essential.
Acknowledgments
We thank Christopher M. Cohu for help in the hydroponic setup, chlorophyll fluorescence measurements, and constructive discussion.
*
This work was supported by United States National Science Foundation Grant NSF-IBN-0418993 (to M. P.). The costs of publication of this article were defrayed in part by the payment of page charges. This article must therefore be hereby marked “_advertisement_” in accordance with 18 U.S.C. Section 1734 solely to indicate this fact.
Footnotes
2
The abbreviations used are: PC, plastocyanin; SOD, superoxide dismutase; miRNA, microRNA; UTR, untranslated region; 5′-RACE, 5′-rapid amplification of cDNA ends; qRT, quantitative real-time PCR; COPT, copper transporter protein; PSII, photosystem II.
3
S. Abdel-Ghany and M. Pilon, unpublished results.
References
- 1.Marschner, H. (1995) Mineral Nutrition of Higher Plants, pp. 333-347, Academic Press, Inc., London
- 2.Henriques, F. S. (1989) Plant Physiol. 135 453-458 [Google Scholar]
- 3.Shikanai, T., Muller-Moule, P., Munekage, Y., Niyogi, K. K., and Pilon, M. (2003) Plant Cell 15 1333-1346 [DOI] [PMC free article] [PubMed] [Google Scholar]
- 4.Barón, M., López-Gorgé, J., Lachica, M., and Sadmann, G. (1992) Physiol. Plant. 84 1-5 [Google Scholar]
- 5.Baszynski, T., Ruszkowska, M., Król, M., Tukendorf, A., and Wolinska, D. (1978) Z. Pflanzenphysiol. 89 207-216 [Google Scholar]
- 6.Murphy, A., and Taiz, L. (1995) Plant Physiol. 108 29-38 [DOI] [PMC free article] [PubMed] [Google Scholar]
- 7.Pätsikkä, E., Kairavuo, M., Sersen, F., Aro, E.-M., and Tyystjärvi, E. (2002) Plant Physiol. 129 1359-1367 [DOI] [PMC free article] [PubMed] [Google Scholar]
- 8.Kieselbach, T., Hagman, A., Andersson, B., and Schroder, W. P. (1998) J. Biol. Chem. 273 6710-6716 [DOI] [PubMed] [Google Scholar]
- 9.Schubert, M., Petersson, U. A., Haas, B. J., Funk, C., Schroder, W. P., and Kieselbach, T. (2002) J. Biol. Chem. 277 8354-8365 [DOI] [PubMed] [Google Scholar]
- 10.Weigel, M., Varotto, C., Pesaresi, P., Finazzi, G., Rappaport, F., Salamini, F., and Leister, D. (2003) J. Biol. Chem. 278 31286-31289 [DOI] [PubMed] [Google Scholar]
- 11.Asada, K. (1999) Annu. Rev. Plant Physiol. Plant Mol. Biol. 50 601-639 [DOI] [PubMed] [Google Scholar]
- 12.Kliebenstein, D. J., Monde, R. A., and Last, R. L. (1998) Plant Physiol. 118 637-650 [DOI] [PMC free article] [PubMed] [Google Scholar]
- 13.Pilon, M., Abdel-Ghany, S. E., Cohu, C. M., Gogolin, K. A., and Ye, H. (2006) Curr. Opin. Plant Biol. 9 256-263 [DOI] [PubMed] [Google Scholar]
- 14.Puig, S., Andres-Colas, N., Garcia-Molina, A., and Penarrubia, L. (2007) Plant Cell Environ. 30 271-290 [DOI] [PubMed] [Google Scholar]
- 15.Abdel-Ghany, S. E., Burkhead, J. L., Gogolin, K. A., Andres-Colas, N., Bodecker, J. R., Puig, S., Penarrubia, L., and Pilon, M. (2005) FEBS Lett. 579 2307-2312 [DOI] [PubMed] [Google Scholar]
- 16.Abdel-Ghany, S. E., Muller-Moule, P., Niyogi, K. K., Pilon, M., and Shikanai, T. (2005) Plant Cell 17 1233-1251 [DOI] [PMC free article] [PubMed] [Google Scholar]
- 17.Cohu, C. M., and Pilon, M. (2007) Physiol. Plant 129 747-755 [Google Scholar]
- 18.Yamasaki, H., Abdel-Ghany, S. E., Cohu, C. M., Kobayashi, Y., Shikanai, T., and Pilon, M. (2007) J. Biol. Chem. 282 16369-16378 [DOI] [PubMed] [Google Scholar]
- 19.Jones-Rhoades, M. W., Bartel, D. P., and Bartel, B. (2006) Annu. Rev. Plant Biol. 57 19-53 [DOI] [PubMed] [Google Scholar]
- 20.LaFayette, P. R., Eriksson, K. E., and Dean, J. F. (1999) Plant Mol. Biol. 40 23-35 [DOI] [PubMed] [Google Scholar]
- 21.Sato, Y., Bao, W. L., Sederoff, R., and Whetten, R. (2001) J. Plant Res. 114 147-155 [Google Scholar]
- 22.McCaig, B. C., Meagher, R. B., and Dean, J. F. D. (2005) Planta 221 619-636 [DOI] [PubMed] [Google Scholar]
- 23.Bao, W., O'Malley, D., Whetten, R., and Sederoff, R. (1993) Science 260 636-638 [DOI] [PubMed] [Google Scholar]
- 24.Dean, J. F., and Eriksson, K. E. (1994) Holzforschung 48 21-33 [Google Scholar]
- 25.Ranocha, P., Chabannes, M., Chamayou, S., Danoun, S., Jauneau, A., Boudet, A.-M., and Goffner, D. (2002) Plant Physiol. 129 145-155 [DOI] [PMC free article] [PubMed] [Google Scholar]
- 26.Sterjiades, R., Dean, J. F. D., and Eriksson, K.-E. L. (1992) Plant Physiol. 99 1162-1168 [DOI] [PMC free article] [PubMed] [Google Scholar]
- 27.Hoopes, J. T., and Dean, J. F. D. (2004) Plant Physiol. Biochem. 42 27-33 [DOI] [PubMed] [Google Scholar]
- 28.Liang, M., Davis, E., Gardner, D., Cai, X., and Wu, Y. (2006) Planta 224 1185-1196 [DOI] [PubMed] [Google Scholar]
- 29.Ryden, L. G., and Hunt, L. T. (1993) J. Mol. Evol. 36 41-56 [DOI] [PubMed] [Google Scholar]
- 30.Dong, J., Kim, S. T., and Lord, E. M. (2005) Plant Physiol. 138 778-789 [DOI] [PMC free article] [PubMed] [Google Scholar]
- 31.Bonnet, E., Wuyts, J., Rouze, P., and Van de Peer, Y. (2004) Proc. Natl. Acad. Sci. U. S. A. 101 11511-11516 [DOI] [PMC free article] [PubMed] [Google Scholar]
- 32.Jones-Rhoades, M. W., and Bartel, D. P. (2004) Mol. Cell 14 787-799 [DOI] [PubMed] [Google Scholar]
- 33.Lu, S. F., Sun, Y. H., Shi, R., Clark, C., Li, L. G., and Chiang, V. L. (2005) Plant Cell 17 2186-2203 [DOI] [PMC free article] [PubMed] [Google Scholar]
- 34.Sunkar, R., Girke, T., Jain, P. K., and Zhu, J. K. (2005) Plant Cell 17 1397-1411 [DOI] [PMC free article] [PubMed] [Google Scholar]
- 35.Sunkar, R., and Zhu, J. K. (2004) Plant Cell 16 2001-2019 [DOI] [PMC free article] [PubMed] [Google Scholar]
- 36.Fahlgren, N., Howell, M. D., Kasschau, K. D., Chapman, E. J., Sullivan, C. M., Cumbie, J. S., Givan, S. A., Law, T. F., Grant, S. R., Dangl, J. L., and Carrington, J. C. (2007) PLoS ONE 2 e219. [DOI] [PMC free article] [PubMed] [Google Scholar]
- 37.Murashige, T., and Skoog, F. (1962) Physiol. Plant 15 473-497 [Google Scholar]
- 38.Hoagland, D. R., and Arnon, D. I. (1938) The Water Culture Method for Growing Plants without Soil, pp. 347-553, College of Agriculture Experimental Station Circular, University of California
- 39.Maxwell, K., and Johnson, G. N. (2000) J. Exp. Bot. 51 659-668 [DOI] [PubMed] [Google Scholar]
- 40.Bradford, M. (1976) Anal. Biochem. 72 248-254 [DOI] [PubMed] [Google Scholar]
- 41.Allen, E., Xie, Z., Gustafson, A. M., and Carrington, J. C. (2005) Cell 121 207-221 [DOI] [PubMed] [Google Scholar]
- 42.Allen, E., Xie, Z., Gustafson, A. M., Sung, G. H., Spatafora, J. W., and Carrington, J. C. (2004) Nat. Genet. 36 1282-1290 [DOI] [PubMed] [Google Scholar]
- 43.Kasschau, K. D., Xie, Z., Allen, E., Llave, C., Chapman, E. J., Krizan, K. A., and Carrington, J. C. (2003) Dev. Cell 4 205-217 [DOI] [PubMed] [Google Scholar]
- 44.Muller, P., Li, X.-P., and Niyogi, K. K. (2001) Plant Physiol. 125 1558-1566 [DOI] [PMC free article] [PubMed] [Google Scholar]
- 45.Schreiber, U., Schliwa, U., and Bilger, W. (1986) Photosynth. Res. 10 51-62 [DOI] [PubMed] [Google Scholar]
- 46.Axtell, M. J., and Bartel, D. P. (2005) Plant Cell 17 1658-1673 [DOI] [PMC free article] [PubMed] [Google Scholar]
- 47.Sunkar, R., Kapoor, A., and Zhu, J.-K. (2006) Plant Cell 18 2051-2065 [DOI] [PMC free article] [PubMed] [Google Scholar]
- 48.Czechowski, T., Bari, R. P., Stitt, M., Scheible, W.-R., and Udvardi, M. K. (2004) Plant J. 38 366-379 [DOI] [PubMed] [Google Scholar]
- 49.Baumberger, N., and Baulcombe, D. C. (2005) Proc. Natl. Acad. Sci. U. S. A. 102 11928-11933 [DOI] [PMC free article] [PubMed] [Google Scholar]
- 50.Park, W., Li, J., Song, R., Messing, J., and Chen, X. (2002) Curr. Biol. 12 1484-1495 [DOI] [PMC free article] [PubMed] [Google Scholar]
- 51.Chen, X., Liu, J., Cheng, Y., and Jia, D. (2002) Development 129 1085-1094 [DOI] [PMC free article] [PubMed] [Google Scholar]
- 52.Lu, C., Tej, S. S., Luo, S., Haudenschild, C. D., Meyers, B. C., and Green, P. J. (2005) Science 309 1567-1569 [DOI] [PubMed] [Google Scholar]
- 53.Cai, X., Davis, E. J., Ballif, J., Liang, M., Bushman, E., Haroldsen, V., Torabinejad, J., and Wu, Y. (2006) J. Exp. Bot. 57 2563-2569 [DOI] [PubMed] [Google Scholar]
- 54.Sancenón, V., Puig, S., Mira, H., Thiele, D. J., and Peñarrubia, L. (2003) Plant Mol. Biol. 51 577-587 [DOI] [PubMed] [Google Scholar]
- 55.Himelblau, E., Mira, H., Lin, S. J., Culotta, V. C., Penarrubia, L., and Amasino, R. M. (1998) Plant Physiol. 117 1227-1234 [DOI] [PMC free article] [PubMed] [Google Scholar]
- 56.Miller, J. D., Arteca, R. N., and Pell, E. J. (1999) Plant Physiol. 120 1015-1024 [DOI] [PMC free article] [PubMed] [Google Scholar]
- 57.Li, H. H., and Merchant, S. (1995) J. Biol. Chem. 270 23504-23510 [DOI] [PubMed] [Google Scholar]
- 58.Bovy, A., de Vrieze, G., Borrias, M., and Weisbeek, P., (1992) Mol. Microbiol. 11 1506-1513 [DOI] [PubMed] [Google Scholar]
- 59.Zhang, L., McSpadden, B., Pakrasi, H. B., and Whitmarsh, J. (1992) J. Biol. Chem. 267 19054-19059 [PubMed] [Google Scholar]
- 60.Chiou, T.-J. (2007) Plant Cell Environ. 30 323-332 [DOI] [PubMed] [Google Scholar]
- 61.Chiou, T. J., Aung, K., Lin, S. I., Wu, C. C., Chiang, S. F., and Su, C. L. (2006) Plant Cell 18 412-421 [DOI] [PMC free article] [PubMed] [Google Scholar]
- 62.Fujii, H., Chiou, T.-J., Lin, S.-I., Aung, K., and Zhu, J.-K. (2005) Curr. Biol. 15 2038-2043 [DOI] [PubMed] [Google Scholar]
- 63.Pant, B. D., Buhtz, A., Kehr, J., and Scheible, W. R. (2007) Plant J. 53 731-738 [DOI] [PMC free article] [PubMed] [Google Scholar]
- 64.Buhtz, A., Springer, F., Chappell, L., Baulcombe, D. C., and Kehr, J. (2008) Plant J. 53 939-949 [DOI] [PubMed] [Google Scholar]
- 65.Ridge, P., Zhang, Y., and Gladyshev, V. (2008) PLoS ONE 3 e1378. [DOI] [PMC free article] [PubMed] [Google Scholar]
- 66.Andersson, U., Heddad, M., and Adamska, I. (2003) Plant Physiol. 132 811-820 [DOI] [PMC free article] [PubMed] [Google Scholar]
- 67.Alt, J., Westhoff, P., Sears, B. B., Nelson, N., Hurt, E., Hauska, G., and Herrmann, R. G. (1983) EMBO J. 2 979-986 [DOI] [PMC free article] [PubMed] [Google Scholar]
- 68.Knoetzel, J., Mant, A., Haldrup, A., Jensen, P. E., and Scheller, H. V. (2002) FEBS Lett. 510 145-148 [DOI] [PubMed] [Google Scholar]
- 69.Philippar, K., Geis, T., Ilkavets, I., Oster, U., Schwenkert, S., Meurer, J., and Soll, J. (2007) Proc. Natl. Acad. Sci. U. S. A. 104 678-683 [DOI] [PMC free article] [PubMed] [Google Scholar]
- 70.Rolland, N., Janosi, L., Block, M. A., Shuda, M., Teyssier, E., Miege, C., Cheniclet, C., Carde, J.-P., Kaji, A., and Joyard, J. (1999) Proc. Natl. Acad. Sci. U. S. A. 96 5464-5469 [DOI] [PMC free article] [PubMed] [Google Scholar]