Rod-Shaped Monocytes Patrol the Brain Vasculature and Give Rise to Perivascular Macrophages under the Influence of Proinflammatory Cytokines and Angiopoietin-2 (original) (raw)
Abstract
The nervous system is constantly infiltrated by blood-derived sentinels known as perivascular macrophages. Their immediate precursors have not yet been identified in situ and the mechanism that governs their recruitment is mostly unknown. Here, we provide evidence that CD68+GR1− monocytes can give rise to perivascular macrophages in mice suffering from endotoxemia. After adhesion to the endothelium, these monocytes start to crawl, adopt a rod-shaped morphology when passing through capillaries, and can manifest the ability to proliferate and form a long cytoplasmic protuberance. They are attracted in greater numbers during endotoxemia by a combination of vasoregulatory molecules, including TNF (tumor necrosis factor), interleukin-1β, and angiopoietin-2. After a period of several hours, some of them cross the endothelium to expand the population of perivascular macrophages. Depletion of adherent monocytes and perivascular macrophages can be achieved by injection of anti-angiopoietin-2 peptide-Fc fusion protein. This study extends our understanding of the behavior of monocytes at the blood–brain interface and provides a way to block their infiltration into the nervous tissue under inflammatory conditions.
Keywords: neuroinflammation, macrophage, microglia, endothelial, blood–brain barrier, cytokine
Introduction
The CNS contains different populations of monocytic cells, notably microglia and perivascular macrophages. Although these cells have a common origin, they differ in terms of morphology, anatomical location, molecular phenotype, and function. As their name suggests, perivascular macrophages are situated in the perivascular space, between the basal lamina and glia limitans (Graeber et al., 1989; Vallières and Sawchenko, 2003). They have an elongated or ameboid morphology depending on the caliber of the vessel on which they reside (Vallières and Sawchenko, 2003). In contrast, microglia are highly ramified and distributed almost evenly throughout the parenchyma. Immunophenotypically, perivascular macrophages are distinguished from microglia by the presence of high levels of CD163 and CD45 on their surface (Graeber et al., 1989; Sedgwick et al., 1991). They are believed to be active phagocytes involved in immune surveillance and antigen presentation, as suggested by their ability to take up foreign particles and to express MHC (major histocompatibility complex) class II and costimulatory molecules (Williams et al., 2001). In contrast, microglia are considered “resting” cells that need to be activated to manifest their full potential. This functional difference may explain why perivascular macrophages are continuously replenished by circulating monocytes, whereas microglia turn over very slowly, if at all, under normal conditions (Matsumoto and Fujiwara, 1987; Hickey and Kimura, 1988; Hickey et al., 1992; Lassmann et al., 1993; Bechmann et al., 2001a,b; Vallières and Sawchenko, 2003). Nevertheless, a significant number of microglia can be replaced by monocytes in response to injury or disease (Popovich and Hickey, 2001; Priller et al., 2001; McMahon et al., 2002; Kokovay and Cunningham, 2005; Ladeby et al., 2005; Schilling et al., 2005; Simard et al., 2006; Remington et al., 2007). Note that perivascular macrophages should not be confused with pericytes, which do not express CD45 and are embedded within the basal lamina (Guillemin and Brew, 2004).
Although microglia and perivascular macrophages serve to protect the nervous tissue, they can be detrimental in certain circumstances. For example, they play effector and regulatory roles in the pathogenesis of multiple sclerosis by presenting antigens to T-lymphocytes and secreting proinflammatory and cytotoxic molecules (Platten and Steinman, 2005). Moreover, they can provide a route of entry for viruses such as HIV (human immunodeficiency virus), leading to encephalitis and neurological complications (González-Scarano and Martín-García, 2005). Unfortunately, there is no way at present to selectively block the traffic of monocytes across the blood–brain barrier for therapeutic purposes, but this possibility may emerge from a better understanding of the mechanisms that govern adhesion of monocytes to the cerebral vasculature, their migration across the endothelium, and their maturation to macrophages. To study such processes, it would be useful to be able to identify in situ the immediate precursors of cerebral macrophages to allow direct examination, which is currently not possible.
Using bone marrow chimeric mice, we previously identified a small population of rod-shaped leukocytes firmly attached to the luminal surface of cerebral capillaries (Vallières and Sawchenko, 2003). To our knowledge, this population of leukocytes has never been described previously. The only information available about their phenotype is that they express the hematopoietic cell marker CD45, but not the macrophage marker Iba1. Here, we provide evidence that these cells comprise the precursors of perivascular macrophages, and that their recruitment in the brain is enhanced during endotoxemia by a molecular cascade involving classical proinflammatory cytokines and the vascular destabilization factor angiopoietin-2 (Angpt2). In the adult, the latter is generally expressed in pathological conditions by endothelial cells and acts in an autocrine manner by antagonizing the Angpt1–Tie2 signaling pathway (Fiedler and Augustin, 2006).
Materials and Methods
Animals.
C57BL/6 mice, purchased from Charles River Laboratories, were acclimated for at least 1 week before use. C57BL/6 mice deficient in tumor necrosis factor (TNF) and/or interleukin-1β (IL-1β), or expressing green fluorescent protein (GFP) under the control of the chicken β-actin promoter, were generated from breeders originally obtained from The Jackson Laboratory. Genotypes were confirmed by PCR as described previously (Turrin and Rivest, 2006). All experiments were performed on males aged 2–3 months in accordance with the guidelines of the Canadian Council on Animal Care.
Generation of chimeric mice.
Mice were exposed to 10 Gy of ionizing radiation and injected with 15 × 106 bone marrow cells obtained from syngeneic GFP mice as described previously (Villeneuve et al., 2005). They were allowed to recover for at least 1 month before being used for experimentation.
Intraperitoneal injection of lipopolysaccharide.
Lipopolysaccharide (LPS) from Escherichia coli O55:B5 (Sigma-Aldrich) was dissolved in pyrogen-free saline and injected intraperitoneally at a dose of 1 mg/kg. Control mice were treated identically, except that LPS was substituted by saline.
Intracerebral injection of TNF.
Mice were anesthetized and immobilized in a stereotaxic frame. A midline incision was made on the scalp, followed by a circular craniotomy over the right hemisphere, 1.7 mm lateral and 1 mm rostral from bregma. After removal of the dura mater, a 28 gauge stainless-steel cannula (Plastics One) connected to a 5 μl Hamilton syringe by polyethylene tubing was advanced into the caudoputamen at a depth of 3.5 mm from the skull surface. One microliter of pyrogen-free saline containing 100 ng of recombinant mouse TNF (R&D Systems) was injected over 2 min using a micropump. After injection, the syringe was left in place for 2 min before being withdrawn slowly. Control mice were treated identically, except that TNF was omitted.
Intracerebroventricular injection of L1-10.
Mice were anesthetized and immobilized in a stereotaxic frame. A midline incision was made on the scalp, followed by a circular craniotomy over the right hemisphere, 1 mm lateral from bregma. After removal of the dura mater, a 30 gauge stainless-steel cannula (Brain Infusion Kit 3; Alzet) connected to an osmotic minipump (model 2001; Alzet) by polyvinylchloride tubing was advanced into the lateral ventricle at a depth of 3 mm from the skull surface and fixed with dental cement. The minipump, filled with PBS containing 4.16 mg/ml L1-10 (kindly provided by Amgen) and primed as recommended by the manufacturer, was implanted subcutaneously in the midscapular region. The delivery rate was 1 μl/h or ∼4 mg/kg/d. Control mice were treated identically, except that L1-10 was omitted.
Intravenous injection of L1-10.
Twelve hours before and after LPS injection, mice were injected via tail vein with 4 mg/kg L1-10 diluted in PBS. Control mice were treated identically, except that L1-10 was substituted by PBS.
Bromodeoxyuridine labeling.
Bromodeoxyuridine (BrdU) (Sigma-Aldrich) was dissolved in pyrogen-free saline at a concentration of 10 mg/ml. Mice were injected intraperitoneally three times with BrdU (100 mg/kg) at 2 h intervals and killed 2 h after the last injection.
Histological preparation.
For all histological analyses except in situ hybridization, mice were transcardially perfused with 10 ml of saline, followed by ice-cold 4% paraformaldehyde in phosphate buffer, pH 7.4, over 10 min. The brains were removed, postfixed for 4 h at 4°C, and then cryoprotected overnight in 50 mm potassium PBS supplemented with 20% sucrose. Series of sections through the forebrain were cut at 40 μm using a freezing microtome, collected in cryoprotectant (30% ethylene glycol, 20% glycerol, 50 mm sodium phosphate buffer, pH 7.4), and stored at −20°C until analysis. For in situ hybridization, the following modifications were applied: (1) the fixative was dissolved in borate buffer, pH 9.5, instead of phosphate buffer, (2) the brains were postfixed for 48 h before overnight cryoprotection in the same fixative supplemented with 20% sucrose, and (3) sections were cut at 30 μm.
Immunostaining.
Immunohistochemistry and immunofluorescence were performed as described previously (Vallières and Sawchenko, 2003) using the following primary antibodies: rat anti-BrdU (1:5000; Accurate Chemical), rat anti-CD11b (1:1000; BD Biosciences), rat anti-CD3ε (1:500; Serotec), rat anti-CD31 (1:1000; BD Biosciences), rat anti-CD45 (1:1000; BD Biosciences), rat anti-CD68 (1:2500; Serotec), goat anti-CD163 (1:1500; Santa Cruz), rat anti-F4/80 (1:500; BD Biosciences), rabbit anti-GFAP (1:1000; Millipore Bioscience Research Reagents), rabbit anti-GFP (1:2000; Millipore Bioscience Research Reagents), rat anti-GR1 (1:1500; Caltag Laboratories), rabbit anti-Iba1 (1:2000; Wako Chemicals), and goat anti-stabilin-1 (1:3500; Santa Cruz). Fluorescent sections were counterstained for 1 min with 2 μg/ml diamidinophenylindole (DAPI).
In situ hybridization.
Brain sections were analyzed for TNF, IL-1β, or Angpt2 mRNA by radioisotopic in situ hybridization as described previously (Nadeau and Rivest, 2003; Villeneuve et al., 2005, 2008). Combined in situ hybridization and immunohistochemistry was performed according to a previously described protocol (Bouchard et al., 2007).
Stereological analyses.
For all the analyses described below, systematically sampled sections (every 10th section) were examined in a blinded manner using a Stereo Investigator system (MicroBrightField) combined with a Nikon E800 microscope.
Immunostained cells were counted by the optical fractionator method. The cerebral cortex (from approximately bregma 1.2 mm to −0.8 mm inclusively) was traced using a 10× objective and sampled using a 60× Plan Apochromat oil objective (numerical aperture, 1.4). The counting parameters were as follows: distance between counting frames, 300 × 300 μm (CD45+ cells) or 250 × 250 μm (GFP+ cells); frame size, 100 × 100 μm (CD45+ cells) or 140 × 140 μm (GFP+ cells); frame thickness, 10 μm; guard zone thickness, ≥2 μm. Cells were counted if their body was at least partially within the three-dimensional counting frame and did not touch the exclusion lines. In general, at least 100 cells were counted per animal. Each count was converted to cell density taking into account the counting parameters and section thickness.
Cells positive for Angpt2 mRNA by in situ hybridization were counted using the fractionator method. The cerebral cortex (from approximately bregma 1.2 mm to −0.8 mm inclusively) was traced using a 4× objective and sampled using a 40× Plan Apochromat objective. The counting parameters were as follows: distance between counting frames, 450 × 450 μm; frame size, 100 × 100 μm. Cells were counted if the hybridization signal (cluster of emulsion grains) was at least partially within the two-dimensional counting frame and did not touch the exclusion lines.
The volume occupied by Angpt2 mRNA+ cells was estimated by the Cavalieri method. Using a 4× Plan Apochromat objective, a point grid of 150 × 150 μm was overlaid on each section, and the points that fell within the region of interest were counted. The counts were converted to volume estimates taking into account sampling frequency, magnification, grid size, and section thickness.
Bright-field imaging.
Photomicrographs were taken using a Retiga EX monochrome camera mounted on a Nikon E800 microscope. The images were adjusted for contrast, brightness, and sharpness using Photoshop 7 (Adobe Systems).
Confocal microscopy.
Confocal images were acquired using an Olympus Fluoview microscope (BX61) by sequential scanning using a _z_-separation of 0.1 μm. For each fluorochrome, the upper and lower thresholds were set using the range indicator to minimize data loss. The proportion of GFP+ cells expressing a given marker was estimated by systematically scanning at least 100 cells per animal.
Three-dimensional reconstruction.
Animated three-dimensional reconstructions of leukocytes were generated from confocal image stacks using Imaris software, version 4.5 (Bitplane). After contrast and brightness adjustment, the stacks were volume rendered using the IsoSurface function of the Surpass module. A semitransparent shade was applied to the cytoplasm (GFP staining), whereas an opaque glossy shade was used for the nucleus (DAPI staining). The objects were exposed to three light sources and animated with a rotation angle of 360°. The final montages were assembled in Keynote 3.0.2 (Apple).
Intravital microscopy.
Chimeric mice were anesthetized 6 h after LPS injection with a mixture of xylazine and ketamine (10:200 mg/kg). After a craniotomy in the right parietal bone, the dura mater was carefully removed to expose pial vessels. GFP+ leukocytes were imaged every 10 s for ∼1 h using an Olympus BX51WI spinning disk confocal microscope with a 20× water-immersion objective (numeric aperture, 0.95) and Volocity 4 software (Improvision). The mouse was maintained at 36 ± 1°C, and the brain surface was kept moist with artificial CSF (132 mm NaCl, 2.95 mm KCl, 1.71 mm CaCl2, 0.64 mm MgCl2, 24.6 mm NaHCO3, 3.71 mm dextrose, 6.7 mm urea; pH 7.35; 37°C; bubbled with a mixture of 10% O2, 6% CO2, and 84% N2).
Organotypic brain slice culture.
Chimeric mice were perfused 6 h after LPS injection with ice-cold dissection buffer (200 mm sucrose, 2 mm KCl, 3 mm MgCl2, 1 mm CaCl2, 26 mm NaHCO3, 1.25 mm NaH2PO4, 10 mm d-glucose; osmolarity adjusted to 298–300 mOsmol/L with mannitol; bubbled with a mixture of 95% O2 and 5% CO2). The brains were quickly collected in dissection buffer and cut into 300-μm-thick coronal sections using a Leica vibratome. Sections were placed onto four-chamber slides (Lab-Tek), glued with MSI-EpidermGlu (Medisav Services), and maintained in survival medium (DMEM supplemented with 25% horse serum, 25% HBSS, 100 U/ml penicillin, 100 μg/ml streptomycin) at 37°C in the presence of 5% CO2. GFP+ cells were imaged every 5 min for ∼9 h using a Nikon TE2000U microscope and MetaMorph 6.3 software (Molecular Devices).
Astrocyte isolation.
Cerebral cortices of embryonic day 18 mouse embryos were dissected and digested for 15 min at 37°C in HBSS containing 0.05% trypsin. The resulting suspension was washed in HBSS supplemented with 10% heat-inactivated FBS, centrifuged at 1200 rpm for 5 min, filtered through a 75 μm nylon mesh, and centrifuged again at 1500 rpm for 10 min. Cells were cultured in T75 flasks (approximately five cortices per flask) in DMEM supplemented with 10% FBS, 100 U/ml penicillin, 100 μg/ml streptomycin, and 1× G5 supplement (Invitrogen). At confluence (∼7 d), the flasks were vigorously shaken by hand for 15 s and rinsed to remove nonastrocytic cells (this purification step was performed three times). Purified astrocytes were grown until confluence (∼7 d) before being used as described below.
Cell culture.
Primary astrocytes and bEnd.3 cerebral endothelial cells (American Type Culture Collection) were seeded at 1 × 10⁶ cells/well in six-well plates and grown for 24 h in the medium described above with or without G5 supplement, respectively. The medium was then replaced with fresh medium supplemented or not with 10 or 100 ng/ml recombinant mouse TNF (R&D Systems), 10 μg/ml goat anti-TNF antibody (R&D Systems), and/or 1 μg/ml LPS. Cells were cultured for 6 h in these conditions and then lysed for RNA isolation.
Flow cytometry.
Mouse peripheral blood leukocytes were isolated by centrifugation of heparinized blood in Ficoll. Bone marrow cells collected by flushing femurs with PBS were used as controls. To estimate the proportion of myeloid cells in proliferation in these samples, cells were blocked for 5 min with 5 μg/ml anti-CD16/CD32 antibody (BD Biosciences) and stained for 30 min on ice with a FITC-conjugated anti-CD11b antibody (clone M1/70; BD Biosciences). The cells were fixed for 30 min with 70% ethanol, stained for 30 min with a solution containing 50 μg/ml propidium iodide and 1.4 mg/ml RNase A, and then analyzed with a FACSCalibur flow cytometer and CellQuest Pro software (BD Biosciences).
RNA isolation.
Total RNA was isolated from cell cultures and mouse forebrains using the GenElute Mammalian Total RNA Miniprep Kit (Sigma-Aldrich) or TRI Reagent (Sigma-Aldrich), respectively. RNA integrity and yield were assessed by capillary electrophoresis using the Bioanalyzer 2100 (Agilent Technologies).
Microarray analysis.
Total RNA (12 ng) was converted to cDNA, which was amplified and transcribed to produce biotinylated cRNA using the Small Sample Labeling Protocol, version 2 (Affymetrix). cRNA (15 μg) was fragmented and hybridized to Affymetrix Mouse Genome 430 2.0 arrays for 16 h at 45°C with constant rotation at 60 rpm. The arrays were washed and stained with streptavidin-phycoerythrin (10 μg/ml) and biotinylated goat anti-streptavidin (3 mg/ml) using the Affymetrix Fluidics Station 400 (protocol EukGE-WS2Av5), and then read using the Affymetrix GeneChip Scanner 3000. The data were analyzed with the statistical software R (version 2.3.1) and add-on packages from the Bioconductor project (version 1.8). Briefly, after assessing array quality using the AffyPLM and AffyQCReport packages, hybridization signals were background-corrected, normalized, and summarized with the GCRMA package. To identify differentially expressed genes, empirical Bayes moderated t statistics were computed with the LIMMA package, adjusting the corresponding p values using the Benjamini and Hochberg method to control the false discovery rate at 5%. Annotations were obtained from the Affymetrix web site.
Real-time quantitative PCR.
cDNA was generated from 2 μg of total RNA using random primer hexamers and Superscript II (Invitrogen). Real-time PCR was conducted in a final volume of 15 μl containing 1× Universal PCR Master Mix (Applied Biosystems), 2 μl of cDNA, 250 nm Amplifluor Uniprimer probe (Millipore Bioscience Research Reagents), 10 nm _Z_-tailed forward primer (Angpt2, 5′-ACTGAACCTGACCGTACAGTCACAATGACAAGGCCGTG-3′; TNF, 5′-ACTGAACCTGACCGTACAAAATTCGAGTGACAAGCCTGTAGC-3′; 18S rRNA, 5′-ACTGAACCTGACCGTACATGCATGTCTAAGTACGCACGG-3′), and 100 nm untailed reverse primer (Angpt2, 5′-TCCCTGGATACTGGCTGCC-3′; TNF, 5′-CCTCCACTTGGTGGTTTGCT-3′; 18S rRNA, 5′-AATGAGCCATTCGCAGTTTCA-3′). The amplification was performed using an ABI PRISM 7900 Sequence Detector (Applied Biosystems) under the following conditions: 2 min at 50°C, 4 min at 95°C, followed by 55 cycles of 15 s at 95°C and 30 s at 55°C. Ribosomal 18S RNA was used to normalize each sample.
Standard PCR.
The presence of Angpt2 mRNA in bEnd.3 cells and astrocytes was confirmed by standard PCR using the JumpStart DNA polymerase (Sigma-Aldrich) and the following primers: 5′-GCTTCGGGAGCCCTCTGGGAGA-3′ and 5′-TCTGCTGGCCGGATCATCATGG-3′. The amplification conditions consisted of an initial denaturation step (94°C; 1 min), followed by 35 cycles of denaturation (94°C; 30 s), annealing (67°C; 30 s), and extension (72°C; 1 min), and a final extension step (72°C; 2 min). The amplicon (451 bp) was analyzed by agarose gel electrophoresis and sequenced to confirm its identity.
Statistical analysis.
Data are expressed as mean ± SEM. Means were compared using the unpaired Student's t test, one-way ANOVA, or two-way ANOVA. The Tukey–Kramer test was used for post hoc multiple comparisons. Relationships between variables were assessed by Pearson correlation. All these analyses were performed with JMP software (SAS Institute) using an α level of 0.05.
Results
Phenotype of rod-shaped leukocytes
To phenotype rod-shaped leukocytes found in cerebral capillaries, we used brain sections from chimeric mice in which ∼92% of the CD11b+ leukocytes expressed GFP, as determined by flow cytometry. These sections were stained for various surface markers either by immunofluorescence, when possible, or by immunohistochemistry, when higher sensitivity was required. By confocal microscopy, we observed that a majority of GFP+ rod-shaped leukocytes expressed the myeloid marker CD11b and the monocytic marker CD68, whereas a minority expressed the granulocytic marker GR1 (Fig. 1a–c). The nucleus of the CD68+ cells was monolobed, whereas that of the GR1+ cells was multilobed (Fig. 1d,e; supplemental Movie 1, available at www.jneurosci.org as supplemental material). In light microscopy, we detected the presence of rod-shaped leukocytes expressing the monocytic markers F4/80, CD163, and stabilin-1 (Fig. 1f–h). The latter two have been shown to be predominantly expressed by perivascular macrophages and not or weakly by microglia (Graeber et al., 1989; Bédard et al., 2007). No cell positive for the lymphocyte marker CD3 was detected. Overall, these results indicate that the population of rod-shaped leukocytes is a mixture of monocytes and granulocytes. These cells were comparable with the round leukocytes also found attached to the brain vasculature (supplemental Fig. 1 and Movie 2, available at www.jneurosci.org as supplemental material), except for their morphology and the fact that they were twice as numerous, as reported previously (Vallières and Sawchenko, 2003).
Figure 1.

Phenotype of rod-shaped leukocytes attached to the luminal surface of cerebral capillaries. a–c, Confocal images showing GFP+ leukocytes (green; arrows) immunostained for CD11b, CD68, or GR1 (red) in the brain of a chimeric mouse. These cells exhibited a polarized shape typical of migrating cells. Arrowhead, Microglia. Scale bar: a–c, 5 μm. d, Monocyte with a DAPI-stained monolobed nucleus (red, false color) that was positive for CD68 (data not shown). See supplemental Movie 1, left panel (available at www.jneurosci.org as supplemental material), for a three-dimensional reconstruction of this cell. Scale bar: d, e, 1 μm. e, Granulocyte with a multilobed nucleus that was positive for GR1 (data not shown). See supplemental Movie 1, right panel (available at www.jneurosci.org as supplemental material), for a three-dimensional reconstruction. f–h, Light micrographs of leukocytes stained for F4/80, CD163, or stabilin-1 by immunohistochemistry. Scale bar: f–h, 10 μm.
Increase in rod-shaped leukocytes during endotoxemia
To examine whether the number of rod-shaped leukocytes increased during inflammation, we injected normal (nonirradiated) mice intraperitoneally with bacterial LPS, an endotoxin commonly used experimentally to induce a systemic inflammatory response that involves the activation of cerebral macrophages (Rivest, 2003). Brain sections from mice killed at different time points were stained for CD45 to reveal all immune cells. Those located in the vasculature were easily distinguished from other immune cells of the brain by their typical morphology and their higher levels of CD45 (Fig. 2a,b). Using unbiased stereological methods, we estimated that the number of rod-shaped leukocytes was approximately four times higher in the cerebral cortex of mice killed 6 or 12 h after LPS injection compared with saline-treated mice (Fig. 2c). A proportional increase in the number of round leukocytes was observed (Fig. 2c,d). To determine the ratio of CD68+ monocytes to GR1+ granulocytes, we repeated this experiment using chimeric mice. We found that this ratio was ∼3:1 and that it did not vary significantly on treatment (Table 1).
Figure 2.

LPS increases the number of adherent leukocytes in the brain vasculature. a, b, Rod-shaped or round leukocyte immunostained for CD45 in the brain of a normal mouse. Scale bar: a, b, 5 μm. c, Stereological analysis revealed an increased number of CD45+ adherent leukocytes in the cerebral cortex of mice killed 6 or 12 h after intraperitoneal injection of LPS (1 mg/kg). *Significantly different from LPS 1 h (ANOVA, p ≤ 0.0035). Error bars indicate SEM. d, A positive correlation was found between the number of rod-shaped leukocytes and that of round leukocytes (Pearson's correlation, p < 0.0001, r = 0.87). Each data point represents a mouse treated with LPS or saline.
Table 1.
Phenotypic characterization of GFP+ leukocytes found in the cerebral vasculature of chimeric mice injected intraperitoneally with LPS or saline (n = 3 per group)
| Cell subpopulation | CD68+ (%) | GR1+ (%) | ||||
|---|---|---|---|---|---|---|
| Saline | LPS, 6 h | LPS, 24 h | Saline | LPS, 6 h | LPS, 24 h | |
| Round leukocytes | 76 ± 0.7 | 74 ± 0.7 | 79 ± 0.7 | 25 ± 1.9 | 37 ± 1.9 | 23 ± 1.9 |
| Rod-shaped leukocytes | 75 ± 1.1 | 70 ± 1.1 | 74 ± 1.1 | 24 ± 2.4 | 24 ± 2.4 | 22 ± 2.4 |
Proliferation of rod-shaped leukocytes
As we previously reported (Vallières and Sawchenko, 2003), we observed a small proportion of rod-shaped leukocytes, generally located at capillary branch points, that were apparently in division (Fig. 3a–c). This subpopulation included CD68+ monocytes and GR1+ granulocytes. To definitively demonstrate that these cells have the potential to proliferate, we injected chimeric mice with BrdU to label cells in the S-phase of the cell cycle. Confocal microscopic analysis revealed the presence of rod-shaped leukocytes that had incorporated BrdU (Fig. 3d,e), confirming that these cells can proliferate while in the vasculature and contrasting with the quiescent state of circulating (nonadherent) peripheral blood leukocytes (supplemental Fig. 2, available at www.jneurosci.org as supplemental material). We therefore asked whether the proliferation of rod-shaped leukocytes increased during endotoxemia. To answer this question, we evaluated the percentage of CD45+ rod-shaped cells that were in the process of division in the cerebral cortex of mice killed 6 h after injection of LPS or saline into the peritoneum (Fig. 3f). We found that this percentage was almost twice higher in LPS-treated mice (Fig. 3g), suggesting that the number of rod-shaped leukocytes is controlled not only at the level of adhesion but also, to some extent, at the level of proliferation.
Figure 3.

LPS increases the proliferation of rod-shaped leukocytes. a, Confocal images showing a GFP+ rod-shaped leukocyte (green; arrow) that was dividing inside the cerebral vasculature (red) in a chimeric mouse. Scale bar, 10 μm. b, c, Dividing leukocytes exhibiting nuclei (red, false color) in telophase. Scale bars, 5 μm. d, e, Leukocytes that were labeled with BrdU (red) during the S-phase of the cell cycle. Scale bars, 5 μm. f, Light micrograph of a dividing leukocyte stained for CD45 by immunohistochemistry. Scale bar, 5 μm. g, Stereological analysis revealed an increase in the number of dividing rod-shaped leukocytes in the cerebral cortex 6 h after intraperitoneal LPS injection. *Student's t test, p < 0.0001. Error bars indicate SEM.
Migration of rod-shaped leukocytes
Most rod-shaped leukocytes exhibited morphological features typical of migrating cells, such as a leading edge (front of the cell) and uropod (rear of the cell) (Fig. 1). To confirm the migratory ability of these cells, we first attempted to visualize them in LPS-treated chimeras by intravital microscopy. However, although we observed round and ameboid leukocytes near the brain surface crawling in postcapillary vessels at a velocity of 1.7 ± 0.2 mm/min (supplemental Movie 3, available at www.jneurosci.org as supplemental material), we were unable to see rod-shaped leukocytes, probably because they are relatively low in number and usually located too deep in the capillary network of the cortex to be detected with a spinning disk confocal microscope. As an alternative, we examined organotypic brain slice cultures by time-lapse microscopy. This approach allowed us to observe rod-shaped leukocytes in the process of migration despite the absence of blood flow (supplemental Movie 4, available at www.jneurosci.org as supplemental material). This result, together with the observation that most rod-shaped leukocytes have a polarized morphology, suggests that these cells do not stay in place after adhesion, but move by crawling on the endothelial surface.
Infiltration of rod-shaped leukocytes
Rod-shaped leukocytes could patrol the cerebral vasculature to be ready to intervene quickly when and where needed by entering the parenchyma and differentiating into macrophages. To examine this possibility, we first sought evidence for the ability of rod-shaped leukocytes to cross the blood–brain barrier in chimeric mice suffering from endotoxemia. One day after LPS injection, we observed GFP+ rod-shaped leukocytes that seemed to be in the process of transmigration (Fig. 4a,b), whereas others were clearly inside the parenchyma and exhibited a polarized morphology typical of migrating cells (Fig. 4c). In contrast, no round leukocytes were found in the parenchyma. All the infiltrated rod-shaped leukocytes had a monolobed nucleus indicative of monocytic lineage. These cells shared many characteristics with perivascular macrophages, including an elongated morphology (Fig. 4d–f) and the expression of GFP, CD11b, CD68, CD163, and stabilin-1 (supplemental Fig. 3, available at www.jneurosci.org as supplemental material). As reported previously (Vallières and Sawchenko, 2003), the only differences observed between rod-shaped monocytes and perivascular macrophages were that the latter expressed Iba1 and had a more elongated and irregular cytoplasm. In this regard, it is interesting to note that some rod-shaped monocytes (approximately one per section) manifested the ability to extend a long cytoplasmic process while inside the vasculature (Fig. 4g). These cells, as those located in the parenchyma, were only observed 24 h after LPS injection and not at the other time points examined (6 h and 3 d) or in a steady state.
Figure 4.

Rod-shaped monocytes can cross the cerebral endothelium and extend cytoplasmic processes. a, b, Confocal images of GFP+ monocytes (green; arrows) that seemed to be in the process of migrating through the endothelium (red). Scale bars: a, 5 μm; b–g, 10 μm. c, Two monocytes, one (arrow) that was located in a capillary and the other (arrowhead) in the parenchyma. Note that the latter had a polarized shape typical of migrating cells, with a leading edge (bottom) and uropod (top). d–f, Monocyte-derived perivascular macrophages exhibiting an elongated cell body with cytoplasmic processes. Note the typical shape of the nucleus in f. g, Monocyte that extended a long cytoplasmic process in a capillary.
After entering the brain, rod-shaped monocytes presumably have two options: to differentiate into microglia or perivascular macrophages. Accordingly, if the traffic of rod-shaped monocytes across the endothelium is accelerated during endotoxemia, we should expect an increase in the formation of either one or both of these cell types. To examine this possibility, we counted the number of GFP+ cells of different subsets (round cells, rod-shaped cells, elongated perivascular macrophages associated with capillaries, and microglia) (Fig. 5a–d) in the cerebral cortex of chimeric mice killed 1 or 3 d after intraperitoneal LPS injection. Stereological analysis revealed an increase (67%) in GFP+ perivascular macrophages, but only at 3 d after injection (Fig. 5e). In comparison, the number of intravascular leukocytes was increased at both time points, whereas that of microglia was unchanged (Fig. 5e). Together, these results suggest that the formation of perivascular macrophages is accelerated in response to endotoxemia, at least in part, via the recruitment of rod-shaped monocytes.
Figure 5.

LPS induces a delayed increase in the recruitment of perivascular macrophages. a–d, Different types of bone marrow-derived cells stained for GFP by immunohistochemistry in brain sections from chimeric mice. Scale bar: a–d, 10 μm. e, Stereological analysis revealed increased numbers of adherent leukocytes and perivascular macrophages expressing GFP in the cerebral cortex of mice killed 1 or 3 d after intraperitoneal LPS injection (n = 9 per group). *Two-way ANOVA: treatment effect, p < 0.0001; time effect, _p_ > 0.05; interaction, p > 0.05. **Two-way ANOVA: treatment effect, p = 0.014; time effect, p < 0.0001; interaction, p = 0.0037. Error bars indicate SEM.
Regulation of rod-shaped leukocytes by TNF and IL-1β
Many of the central effects of LPS are mediated by proinflammatory cytokines, in particular TNF and IL-1β (Rivest, 2003). These molecules reach the brain via the bloodstream and are also synthesized locally by glial cells. To determine the importance of these two cytokines in controlling the number of rod-shaped leukocytes, we injected LPS to mice deficient or not in TNF and/or IL-1β and collected their brains 6 h later for histological analysis. As previously reported (Nadeau and Rivest, 1999; Quan et al., 1999), LPS strongly induced the expression of both cytokines in the brains of wild-type mice, predominantly along the leptomeninges and some blood vessels (Fig. 6a,b). By examining brain sections stained for CD45, we found that the number of rod-shaped leukocytes was ∼62% lower in all the knock-outs compared with LPS-treated wild-types (Fig. 6c). As expected from the results presented in Figure 5, a proportional decrease in round leukocytes was detected (Fig. 6c,d), but no difference in the number of capillary-associated perivascular macrophages (wild types, 1088 ± 92; double knock-outs, 1063 ± 92; Student's t test, p = 0.85). The effect of LPS was not totally abolished in the knock-outs, because the number of rod-shaped leukocytes was about twice that found in saline-treated wild types (Fig. 6c). Furthermore, no difference was detected between the single and double knock-outs (Fig. 6c), indicating that TNF and IL-1β are both essential for an optimal response to LPS, but do not act in an additive or synergistic manner.
Figure 6.
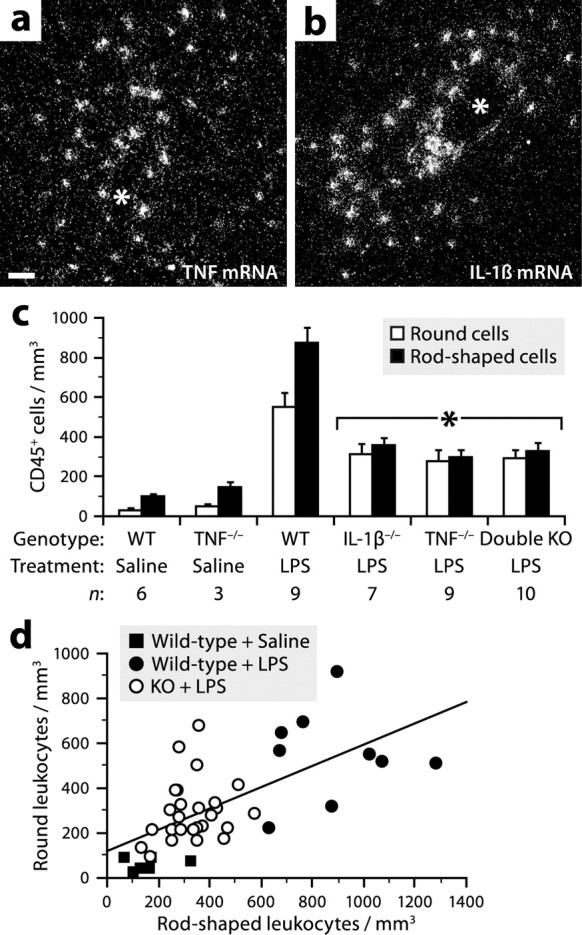
TNF and IL-1β partially mediate the effect of LPS on the adhesion of leukocytes to the cerebral vasculature. a, b, Dark-field micrographs showing in situ hybridization signals for TNF or IL-1β mRNA in the cerebral cortex of a mouse killed 6 h after intraperitoneal LPS injection (1 mg/kg). Scale bar: a, b, 50 μm. The asterisk (*) indicates blood vessel lumen. c, Stereological analysis revealed reduced numbers of CD45+ adherent leukocytes in the cerebral cortex of mice deficient in TNF and/or IL-1β 6 h after LPS injection. *Significantly different from LPS-treated wild types (WT) (ANOVA, p ≤ 0.0030). Error bars indicate SEM. d, A positive correlation was found between the number of rod-shaped leukocytes and that of round leukocytes (Pearson's correlation, p < 0.0001, r = 0.65). Each data point represents a wild-type or knock-out mouse treated with LPS or saline.
Angpt2 expression during endotoxemia
Proinflammatory molecules promote leukocyte adhesion and transmigration by inducing vascular changes (Muller, 2003; Imhof and Aurrand-Lions, 2004). To identify endothelial factors induced in the brain during endotoxemia and potentially involved in the recruitment of rod-shaped leukocytes, we analyzed RNA samples extracted from the brains of mice killed 6 h after LPS injection, using oligonucleotide microarrays interrogating >39,000 transcripts. To narrow our search, we retained only upregulated genes with a value of p < 0.05 and classified as extracellular or plasma membrane-associated by the Gene Ontology Consortium. Among the 76 remaining genes (supplemental Table 1, available at www.jneurosci.org as supplemental material), many were known to be inducible in endothelial cells, including cytokine receptors (e.g., TNF receptor 1, IL-1 receptor 1), adhesion molecules (e.g., ICAM1, VCAM1), and the angiogenic factor Angpt2. The latter was particularly interesting to us, because we had previously found reduced numbers of hematogenous macrophages in brain tumors after neutralization of Angpt2 (Villeneuve et al., 2008), suggesting a role for this endothelial molecule in macrophage recruitment.
To confirm that LPS can induce Angpt2 expression, brain sections from mice killed at different time points after intraperitoneal injection of LPS or saline were analyzed for the presence of Angpt2 mRNA by radioisotopic in situ hybridization. Virtually no signal was detected under normal conditions and 1 h after LPS injection (data not shown). In contrast, strong signals were observed throughout the brain from 3 to 12 h, with a maximum number at 6 h (Fig. 7a–c,e). There was no detectable signal after 24 h (Fig. 7d). Consistent with these results, real-time PCR analysis revealed a 3.4-fold increase in the levels of Angpt2 mRNA in the brains of mice killed 6 h after LPS injection compared with saline-treated mice, but no difference in mice killed after 24 h (Fig. 7f).
Figure 7.
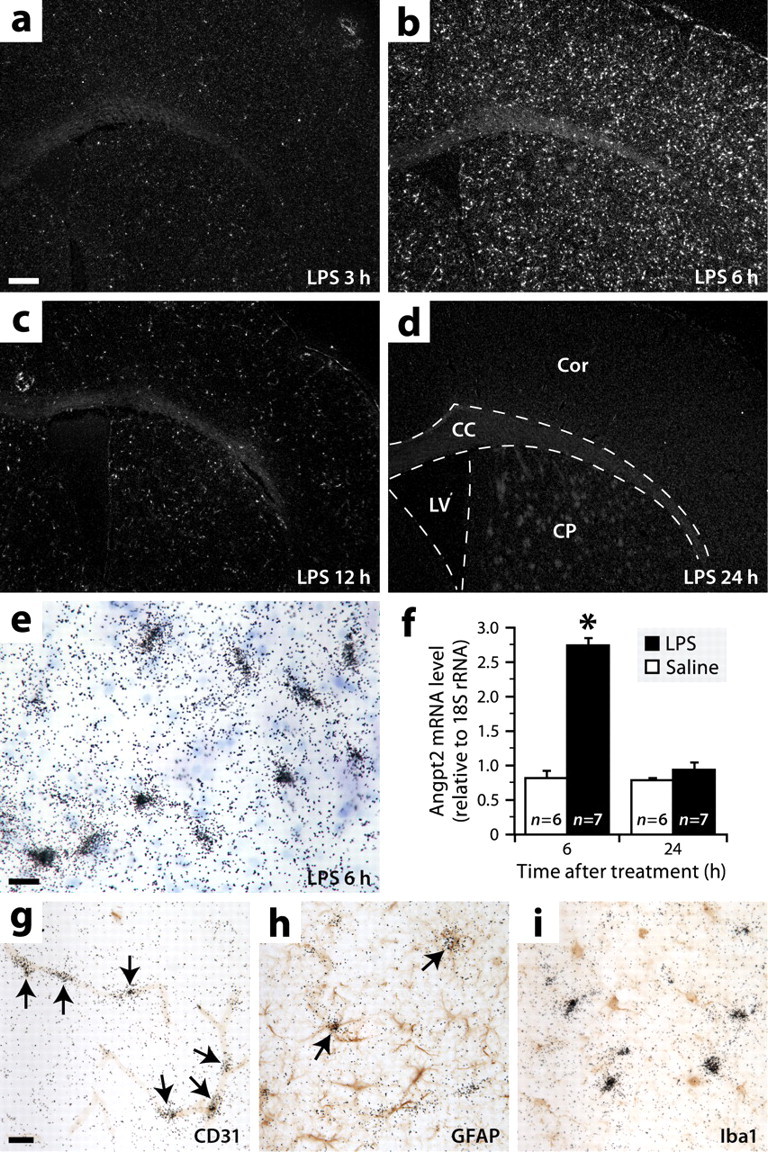
Angpt2 is expressed throughout the brain during endotoxemia, mainly by endothelial cells and rarely by astrocytes. a–d, Dark-field micrographs showing in situ hybridization signals for Angpt2 mRNA in brain sections of mice killed at different times after intraperitoneal LPS injection. Abbreviations: CC, Corpus callosum; Cor, cerebral cortex; CP, caudoputamen; LV, lateral ventricle. Scale bar: a–d, 250 μm. e, Bright-field image showing hybridization signals (black grains) for Angpt2 mRNA at higher magnification. Blue, Thionin counterstaining. Scale bar, 20 μm. f, Increased levels of Angpt2 mRNA were detected by real-time PCR in the brains of mice killed 6 h after LPS injection. Data are expressed as a ratio to 18S rRNA *Significantly different from the other groups (two-way ANOVA: treatment effect, p < 0.0001; time effect, p < 0.0001; interaction, p < 0.0001). Error bars indicate SEM. g–i, Double labelings for Angpt2 mRNA (black grains; in situ hybridization) and different cell-specific markers (red-brown; immunoperoxidase staining). The arrows indicate double-labeled cells. Scale bar: g–i, 20 μm.
To determine the identity of Angpt2-expressing cells, adjacent sections were double labeled for Angpt2 mRNA and different cell type-specific markers by combined in situ hybridization and immunohistochemistry. We found that the hybridization signals were in a vast majority colocalized with the endothelial marker CD31 (Fig. 7g) and very rarely (approximately three per section) with the astrocytic marker GFAP (Fig. 7h). No colocalization was observed with the macrophage marker Iba1 (Fig. 7i). Overall, these results indicate that Angpt2 is expressed during endotoxemia in a transient manner almost exclusively by the endothelium.
Regulation of Angpt2 expression by TNF
To determine whether TNF and IL-1β mediate the effect of LPS on Angpt2 expression, we used in situ hybridization to analyze the brains of mice deficient or not in either one or both of these cytokines and killed 6 h after LPS injection (Fig. 8a,b). We found a 43% decrease in the number of Angpt2 mRNA+ cells in the cerebral cortex of TNF-deficient mice compared with wild-type mice (Fig. 8c). A similar decrease was observed in mice lacking both TNF and IL-1β, but not in mice lacking only IL-1β (Fig. 8c). These results suggest that TNF, but not IL-1β, mediates in part the effect of LPS on Angpt2 expression.
Figure 8.

TNF regulates Angpt2 expression in vivo. a, b, Dark-field micrographs showing in situ hybridization signals for Angpt2 mRNA in the brain of a wild-type or TNF-deficient mouse killed 6 h after intraperitoneal LPS administration. Scale bar: a, b, d, e, 250 μm. c, Stereological analysis revealed reduced numbers of Angpt2 mRNA+ cells in the cerebral cortex of mice deficient in TNF killed 6 h after LPS injection. *Significantly different from wild type (WT) and IL-1β knock-out (KO) mice (ANOVA, p = 0.0012). Error bars indicate SEM. d, e, Hybridization signals for Angpt2 mRNA in brain sections of mice killed 6 h after injection of TNF (100 ng) or saline into the right caudoputamen. Abbreviations: CC, Corpus callosum; Cor, cerebral cortex; CP, caudoputamen; LV, lateral ventricle. f, As estimated by the Cavalieri method, the volume occupied by Angpt2 mRNA+ cells in TNF-injected mice was 6.5 times that in control mice at 6 h after injection. *Significantly different from the other groups (two-way ANOVA: treatment effect, p = 0.0008; time effect, p = 0.0018; interaction, p = 0.010). Error bars indicate SEM.
To confirm the ability of TNF to induce Angpt2 expression, brain sections from mice killed 3 or 6 h after intracerebral injection of TNF or saline were analyzed by in situ hybridization. Strong signals were found only around the needle track in control mice (Fig. 8d), but in a large proportion of the ipsilateral hemisphere in TNF-treated animals (Fig. 8e). More specifically, stereological analysis revealed that the volume occupied by Angpt2 mRNA+ cells was 6.5 times larger in mice killed 6 h after TNF injection compared with saline-treated mice (Fig. 8f).
To study the regulation of Angpt2 expression in vitro, we cultured mouse cerebral endothelial cells for 6 h in the presence of TNF, LPS, and/or anti-TNF antibody. Real-time PCR analysis revealed that TNF and LPS induced a more than twofold increase in the levels of Angpt2 mRNA (Fig. 9a). The induction by TNF, but not by LPS, was blocked in the presence of anti-TNF antibody (Fig. 9a), confirming the specificity of the result. For comparison, we also analyzed astrocytes and found that these cells also expressed Angpt2 mRNA in basal culture conditions (Fig. 9b,c). In contrast to what we found in endothelial cells, the levels of Angpt2 mRNA in astrocytes were decreased after exposure to TNF or LPS (Fig. 9b). Moreover, not only did coincubation with anti-TNF antibody block the effect of TNF, but it also blocked that of LPS. Overall, these results indicate that Angpt2 expression is regulated differentially by LPS depending on the cell type: it is induced in endothelial cells by a mechanism that can be independent of TNF, whereas it is inhibited in astrocytes by a TNF-dependent mechanism. In agreement with this, we measured a 264-fold increase in the levels of TNF mRNA in LPS-treated astrocytes compared with saline-treated astrocytes, but no significant expression of TNF in endothelial cells (Fig. 9d). Note that the detection of TNF mRNA in astrocytes was not attributable to contaminating cells because the cultures were >99% pure, as estimated by GFAP staining (Fig. 9e).
Figure 9.

TNF regulates Angpt2 expression in vitro. a, b, Quantification of Angpt2 mRNA by real-time PCR in bEnd.3 cerebral endothelial cells or primary astrocytes cultured for 6 h in the presence of LPS (1 μg/ml), TNF (10 or 100 ng/ml), and/or anti-TNF antibody (10 μg/ml). *Significantly different from control [ANOVA, p < 0.0001 (a) or = 0.0072 (b)]. Error bars indicate SEM. c, Confirmation of the presence of Angpt2 mRNA in bEnd.3 cells and astrocytes, cultured in normal conditions, by standard PCR and agarose gel electrophoresis. Right column, DNA ladder. d, Quantification of TNF mRNA by real-time PCR in bEnd.3 cells and astrocytes cultured for 6 h with or without LPS. *Significantly different from PBS (Student's t test, p < 0.0001). Error bars indicate SEM. e, Confocal image of astrocytes in primary culture immunostained for GFAP (red). Blue, DAPI-stained nuclei. Scale bar, 20 μm.
Regulation of rod-shaped leukocytes by Angpt2
To investigate the role of Angpt2 in the recruitment of rod-shaped leukocytes, we performed two experiments in which mice were treated with an anti-Angpt2 peptide-Fc fusion protein called L1-10, whose properties have been reported in previous studies (Oliner et al., 2004; Villeneuve et al., 2008). In the first experiment, normal mice were implanted with an intracerebral cannula, through which L1-10 or PBS was infused for a week, and then challenged for 6 h with LPS. In this approach, we assumed that L1-10 would neutralize Angpt2 derived from both sides of the blood–brain barrier after diffusion through the parenchyma and absorption into the plasma. Stereological analysis revealed that the number of CD45+ intravascular leukocytes was decreased by 44% in mice receiving L1-10 (Fig. 10a).
Figure 10.

Angpt2 mediates the effect of LPS on the adhesion of leukocytes to the cerebral vasculature and the recruitment of perivascular macrophages. a, Stereological analysis revealed a reduced number of adherent leukocytes, but not of perivascular macrophages (Student's t test, p = 0.64), in the cerebral cortex of nonchimeric mice infused intracerebroventricularly with L1-10 and killed 6 h after LPS injection. *Student's t test, p ≤ 0.002. b, c, The number of adherent leukocytes and perivascular macrophages was reduced in the cerebral cortex of chimeric mice injected intravenously with L1-10 and killed 3 d after LPS administration. *Student's t test, p ≤ 0.02. **Student's t test, p ≤ 0.0006. Error bars indicate SEM.
In the second experiment, chimeric mice were injected intravenously with L1-10 12 h before and after LPS injection and then killed 3 d later. This approach was used to examine not only the effect of L1-10 on leukocyte adhesion when administrated via a different route but also its effect on the formation of perivascular macrophages. We found a 40% decrease of GFP+ intravascular leukocytes and a 51% decrease of GFP+ perivascular macrophages associated with capillaries in mice treated with L1-10, but no difference in GFP+ microglia (Fig. 10b). Similar results were obtained by counting the number of CD45+ cells (Fig. 10c). Therefore, the results of these two experiments demonstrate that LPS increases the population of perivascular macrophages via the recruitment of circulating monocytes by a mechanism involving Angpt2. Note that this molecule influences the adhesion of leukocytes and not their proliferation, because no intergroup difference in the proportion of dividing rod-shaped leukocytes was observed in both experiments (intracerebral injection of PBS or L1-10, 12.3 ± 0.6 vs 10.7 ± 0.6; intravenous injection of PBS or L1-10, 11.6 ± 1.5 vs 12.7 ± 1.5; Student's t test, p > 0.05).
Discussion
The role of perivascular macrophages in the CNS is becoming increasingly clear, but little is known about their immediate precursors and the mechanisms that regulate their development. The results of the present study lead us to conclude that perivascular macrophages derive from CD68+GR1− rod-shaped monocytes that crawl on the endothelium. As illustrated in Figure 11, these cells are attracted in greater numbers during endotoxemia by a TNF/Angpt2-dependent mechanism. While still in the vasculature, they can manifest the astonishing ability to self-renew and extend a relatively long cytoplasmic process, whose function is perhaps to monitor the environment. After a period of several hours, some of these cells cross the endothelium and differentiate into perivascular macrophages. These observations extend our understanding of the behavior of monocytes at the blood–brain interface and of the molecular mechanisms that control their recruitment during inflammation. The immune response described here may be important not only in infection but also in other conditions in which proinflammatory cytokines are produced, such as injury, degenerative disease, and cancer.
Figure 11.

Monocyte activity at the blood–brain interface. 1, Activated by inflammatory stimuli (e.g., LPS), monocytic cells release proinflammatory cytokines such as TNF. This can occur in the brain or in peripheral tissues. 2, TNF acts on the cerebral microvasculature by inducing the expression of Angpt2, which permits vascular changes that promote the adhesion of CD68+GR1− monocytes. 3, 4, When firmly attached, these cells adopt a rod-shaped morphology and crawl on the endothelium. 5, Most frequently at capillary branch points, they can divide into two daughter cells that continue to crawl in opposite directions. 6, While monitoring the environment, they can extend a long cytoplasmic process whose function is unknown. 7, Where needed, some of them cross the blood–brain barrier by a process of diapedesis. 8, 9, After infiltration, they search for a vacant niche in which they ultimately differentiate into perivascular macrophages. Although CD68+GR1− monocytes do not give rise to microglia in response to endotoxemia, it remains to be investigated whether they can do so in other inflammatory conditions.
Originally considered as a homogeneous population, circulating monocytes are now divided into two subsets: the so-called “inflammatory” (type 1) monocytes, which are selectively recruited into inflamed tissues, and the “resident” (type 2) monocytes, which home to most normal tissues (Geissmann et al., 2003; Sunderkötter et al., 2004). These cells are respectively GR1+CCR2+CX3CR1low and GR1−CCR2−CX3CR1high. In the brain, the ability of type 1 monocytes to differentiate into microglia after injury has recently been demonstrated (Mildner et al., 2007), but the fate of type 2 monocytes was still unknown. Here, we show that monocytes crawling on the cerebral endothelium are all of type 2 (GR1−) and can give rise to perivascular macrophages. Our results are consistent with the findings of Geissmann and colleagues, who reported that monocytes crawling in the skin vasculature are predominantly of type 2 (Auffray et al., 2007), and that type 1 monocytes, transfused in normal mice, become almost undetectable in the brain and most other tissues as early as 1 d after transfer, in contrast to type 2 monocytes (Geissmann et al., 2003).
Our observation that type 2 monocytes are selectively and rapidly recruited in response to classical inflammatory stimuli (LPS, TNF, IL-1β) is somehow surprising in light of previous studies showing preferential recruitment of type 1 monocytes into inflamed sites [e.g., adjuvant-treated skin, infected peritoneum, injured myocardium, atherosclerotic plaques (Jutila et al., 1988; Chan et al., 1998; Geissmann et al., 2003; Sunderkötter et al., 2004; Robben et al., 2005; Le Borgne et al., 2006; Nahrendorf et al., 2007; Tacke et al., 2007)]. However, they are in agreement with the recent finding that extravasation of type 2 monocytes into the peritoneum precedes that of type 1 monocytes after infection with Listeria monocytogenes (Auffray et al., 2007). The apparent discrepancy between our results and the former studies is probably attributable to the different nature of the tissues and inflammatory models used. In future work, it will be interesting to examine whether type 1 monocytes can be seen crawling in the cerebral vasculature in chronic conditions, because these monocytes are relatively immature cells, newly released into the bloodstream, and their proportion increases during monocytosis (Sunderkötter et al., 2004). Because it is clear that type 2 monocytes respond to inflammatory stimuli, we recommend the use of the terminology “type 1/type 2” rather than “inflammatory/resident” to avoid potential confusion.
Together, our in vivo and in vitro data indicate that LPS increases the number of crawling monocytes in the cerebral vasculature by inducing Angpt2 expression in endothelial cells, both directly and indirectly via TNF. Although the molecular cascade induced by Angpt2 remains to be fully elucidated, recent evidence suggests that it culminates in the expression of integrin ligands (e.g., ICAM1, VCAM1) on the endothelial surface (Fiedler et al., 2006). One possibility is that Angpt2 blocks the interaction between Tie2 and ABIN-2, an inhibitor of the NF-κB (nuclear factor-κB) pathway, thereby allowing the expression of inflammatory molecules (Hughes et al., 2003). This hypothesis would be in accordance with the observation that Angpt2 is unable to induce the expression of adhesion molecules by itself, but cooperates with TNF (Fiedler et al., 2006). In addition to this autocrine effect, it is possible that Angpt2 acts directly on certain monocytes, as suggested by the detection of Tie2 on a subpopulation of monocytes (De Palma et al., 2005; Murdoch et al., 2007).
Contrary to the general belief that monocytes circulating in the blood are noncycling (Geissmann et al., 2003), we found that these cells can undergo division after adhesion to capillaries, suggesting that endothelial cells provide a proliferative signal to monocytes as they do for other cell types [e.g., neural stem cells (Shen et al., 2004)]. This possibility is supported by the observation that cultured endothelial cells can stimulate the proliferation of monocytes in a contact-dependent manner (Antonov et al., 1997; Pakala and Benedict, 1999). It is tempting to speculate that this signal may be more abundant at capillary branch points, where the majority of dividing monocytes were observed, as in the case of glioma cells (Farin et al., 2006). A technically difficult question to answer is to what extent proliferation contributes to the renewal and expansion of the monocytic population. Considering the need for continuous release of monocytes from the bone marrow, it is likely that monocytes can only undergo a few divisions. This limited proliferative capacity could be an evolutionary adaptation to protect the organism from disorders of phagocytic function.
To our knowledge, this study is the first to show that the population of perivascular macrophages can be expanded in response to immune challenge. This expansion results from the recruitment of circulating monocytes, although the proliferation of preexisting macrophages could also contribute, as suggested by our previous observation that these cells can incorporate BrdU (Vallières and Sawchenko, 2003). However, we believe that proliferation of perivascular macrophages is minor in the model studied here, because these cells were generally not distributed in clusters, as expected if they proliferated, but were rather scattered individually. The infiltration of monocytes into the perivascular space is not a consequence of irradiation, as suggested for microglia (Mildner et al., 2007), because it has been shown that monocytes, labeled ex vivo and injected into the circulation of normal mice, can give rise to perivascular macrophages (Bechmann et al., 2001a). The reason for this infiltration is unclear, but we speculate that it serves to replace phagocytic cells cleared by apoptosis, replace antigen-presenting cells that migrate to draining lymph nodes, and/or increase the number of sentinels in prevision of a future immune attack.
Although it is widely believed that the main source of Angpt2 is the endothelium, we have made the intriguing observation that astrocytes can produce this molecule in vivo and in vitro. This is not so surprising considering that astrocytes contribute to the formation and maintenance of the blood–brain barrier by interacting with endothelial cells, physically and via soluble mediators such as Angpt1 (Lee et al., 2003; Abbott et al., 2006; Iadecola and Nedergaard, 2007). It is conceivable that astrocytes could also destabilize the brain vasculature by releasing Angpt2; however, the conditions in which this would occur remain to be identified, because we found that Angpt2 expression in astrocytes is negligible in endotoxemic mice and even repressed in culture after exposure to LPS or TNF.
During endotoxemia, it is well known that TNF is released into the blood from peripheral tissues and produced locally in the brain by glial cells (Rivest, 2003). Our experiments aiming at testing the effect of TNF on Angpt2 expression were not designed to distinguish the effect of blood-derived TNF versus that of brain-derived TNF. Considering that LPS induced TNF expression predominantly along the leptomeninges and some cerebral blood vessels and not everywhere throughout the brain, we suggest that TNF from both sides of the blood–brain barrier contribute to the induction of Angpt2 expression during endotoxemia (Fig. 11). However, the relative importance of blood-derived TNF and brain-derived TNF remains to be experimentally determined.
In summary, our study identifies CD68+GR1− rod-shaped monocytes as the immediate precursors of perivascular macrophages and reveals a molecular mechanism acting on the endothelium that controls their recruitment during systemic inflammation. Our observations do not preclude a role for these monocytes in the production of microglia and other populations of cerebral macrophages (i.e., those of the meninges and circumventricular organs). Additional studies will be required to determine whether Angpt2 is involved in other neuroinflammatory conditions and whether its blockade (e.g., with L1-10) could be therapeutically beneficial under certain circumstances.
Footnotes
This work was supported by the Natural Sciences and Engineering Research Council of Canada and the Canadian Institutes for Health Research (CIHR). L.V. received a Career Award from the Rx&D Health Research Foundation and CIHR. J.A.-R. was supported by a CIHR Strategic Training Program Grant in Genomics. We thank Nadia Fortin, Maurice Dufour, and the Gene Quantification Core Laboratory of the Quebec Genomics Center for assistance with animal care, flow cytometry, and real-time PCR, respectively. We thank Amgen for providing L1-10.
References
- Abbott NJ, Rönnbäck L, Hansson E. Astrocyte-endothelial interactions at the blood-brain barrier. Nat Rev Neurosci. 2006;7:41–53. doi: 10.1038/nrn1824. [DOI] [PubMed] [Google Scholar]
- Antonov AS, Munn DH, Kolodgie FD, Virmani R, Gerrity RG. Aortic endothelial cells regulate proliferation of human monocytes in vitro via a mechanism synergistic with macrophage colony-stimulating factor. Convergence at the cyclin E/p27(Kip1) regulatory checkpoint. J Clin Invest. 1997;99:2867–2876. doi: 10.1172/JCI119480. [DOI] [PMC free article] [PubMed] [Google Scholar]
- Auffray C, Fogg D, Garfa M, Elain G, Join-Lambert O, Kayal S, Sarnacki S, Cumano A, Lauvau G, Geissmann F. Monitoring of blood vessels and tissues by a population of monocytes with patrolling behavior. Science. 2007;317:666–670. doi: 10.1126/science.1142883. [DOI] [PubMed] [Google Scholar]
- Bechmann I, Kwidzinski E, Kovac AD, Simbürger E, Horvath T, Gimsa U, Dirnagl U, Priller J, Nitsch R. Turnover of rat brain perivascular cells. Exp Neurol. 2001a;168:242–249. doi: 10.1006/exnr.2000.7618. [DOI] [PubMed] [Google Scholar]
- Bechmann I, Priller J, Kovac A, Böntert M, Wehner T, Klett FF, Bohsung J, Stuschke M, Dirnagl U, Nitsch R. Immune surveillance of mouse brain perivascular spaces by blood-borne macrophages. Eur J Neurosci. 2001b;14:1651–1658. doi: 10.1046/j.0953-816x.2001.01793.x. [DOI] [PubMed] [Google Scholar]
- Bédard A, Tremblay P, Chernomoretz A, Vallières L. Identification of genes preferentially expressed by microglia and upregulated during cuprizone-induced inflammation. Glia. 2007;55:777–789. doi: 10.1002/glia.20477. [DOI] [PubMed] [Google Scholar]
- Bouchard C, Pagé J, Bédard A, Tremblay P, Vallières L. G protein-coupled receptor 84, a microglia-associated protein expressed in neuroinflammatory conditions. Glia. 2007;55:790–800. doi: 10.1002/glia.20506. [DOI] [PubMed] [Google Scholar]
- Chan J, Leenen PJ, Bertoncello I, Nishikawa SI, Hamilton JA. Macrophage lineage cells in inflammation: characterization by colony-stimulating factor-1 (CSF-1) receptor (c-Fms), ER-MP58, and ER-MP20 (Ly-6C) expression. Blood. 1998;92:1423–1431. [PubMed] [Google Scholar]
- De Palma M, Venneri MA, Galli R, Sergi Sergi L, Politi LS, Sampaolesi M, Naldini L. Tie2 identifies a hematopoietic lineage of proangiogenic monocytes required for tumor vessel formation and a mesenchymal population of pericyte progenitors. Cancer Cell. 2005;8:211–226. doi: 10.1016/j.ccr.2005.08.002. [DOI] [PubMed] [Google Scholar]
- Farin A, Suzuki SO, Weiker M, Goldman JE, Bruce JN, Canoll P. Transplanted glioma cells migrate and proliferate on host brain vasculature: a dynamic analysis. Glia. 2006;53:799–808. doi: 10.1002/glia.20334. [DOI] [PubMed] [Google Scholar]
- Fiedler U, Augustin HG. Angiopoietins: a link between angiogenesis and inflammation. Trends Immunol. 2006;27:552–558. doi: 10.1016/j.it.2006.10.004. [DOI] [PubMed] [Google Scholar]
- Fiedler U, Reiss Y, Scharpfenecker M, Grunow V, Koidl S, Thurston G, Gale NW, Witzenrath M, Rosseau S, Suttorp N, Sobke A, Herrmann M, Preissner KT, Vajkoczy P, Augustin HG. Angiopoietin-2 sensitizes endothelial cells to TNF-alpha and has a crucial role in the induction of inflammation. Nat Med. 2006;12:235–239. doi: 10.1038/nm1351. [DOI] [PubMed] [Google Scholar]
- Geissmann F, Jung S, Littman DR. Blood monocytes consist of two principal subsets with distinct migratory properties. Immunity. 2003;19:71–82. doi: 10.1016/s1074-7613(03)00174-2. [DOI] [PubMed] [Google Scholar]
- González-Scarano F, Martín-García J. The neuropathogenesis of AIDS. Nat Rev Immunol. 2005;5:69–81. doi: 10.1038/nri1527. [DOI] [PubMed] [Google Scholar]
- Graeber MB, Streit WJ, Kreutzberg GW. Identity of ED2-positive perivascular cells in rat brain. J Neurosci Res. 1989;22:103–106. doi: 10.1002/jnr.490220114. [DOI] [PubMed] [Google Scholar]
- Guillemin GJ, Brew BJ. Microglia, macrophages, perivascular macrophages, and pericytes: a review of function and identification. J Leukoc Biol. 2004;75:388–397. doi: 10.1189/jlb.0303114. [DOI] [PubMed] [Google Scholar]
- Hickey WF, Kimura H. Perivascular microglial cells of the CNS are bone marrow-derived and present antigen in vivo. Science. 1988;239:290–292. doi: 10.1126/science.3276004. [DOI] [PubMed] [Google Scholar]
- Hickey WF, Vass K, Lassmann H. Bone marrow-derived elements in the central nervous system: an immunohistochemical and ultrastructural survey of rat chimeras. J Neuropathol Exp Neurol. 1992;51:246–256. doi: 10.1097/00005072-199205000-00002. [DOI] [PubMed] [Google Scholar]
- Hughes DP, Marron MB, Brindle NP. The antiinflammatory endothelial tyrosine kinase Tie2 interacts with a novel nuclear factor-kappaB inhibitor ABIN-2. Circ Res. 2003;92:630–636. doi: 10.1161/01.RES.0000063422.38690.DC. [DOI] [PubMed] [Google Scholar]
- Iadecola C, Nedergaard M. Glial regulation of the cerebral microvasculature. Nat Neurosci. 2007;10:1369–1376. doi: 10.1038/nn2003. [DOI] [PubMed] [Google Scholar]
- Imhof BA, Aurrand-Lions M. Adhesion mechanisms regulating the migration of monocytes. Nat Rev Immunol. 2004;4:432–444. doi: 10.1038/nri1375. [DOI] [PubMed] [Google Scholar]
- Jutila MA, Kroese FG, Jutila KL, Stall AM, Fiering S, Herzenberg LA, Berg EL, Butcher EC. Ly-6C is a monocyte/macrophage and endothelial cell differentiation antigen regulated by interferon-gamma. Eur J Immunol. 1988;18:1819–1826. doi: 10.1002/eji.1830181125. [DOI] [PubMed] [Google Scholar]
- Kokovay E, Cunningham LA. Bone marrow-derived microglia contribute to the neuroinflammatory response and express iNOS in the MPTP mouse model of Parkinson's disease. Neurobiol Dis. 2005;19:471–478. doi: 10.1016/j.nbd.2005.01.023. [DOI] [PubMed] [Google Scholar]
- Ladeby R, Wirenfeldt M, Dalmau I, Gregersen R, García-Ovejero D, Babcock A, Owens T, Finsen B. Proliferating resident microglia express the stem cell antigen CD34 in response to acute neural injury. Glia. 2005;50:121–131. doi: 10.1002/glia.20159. [DOI] [PubMed] [Google Scholar]
- Lassmann H, Schmied M, Vass K, Hickey WF. Bone marrow derived elements and resident microglia in brain inflammation. Glia. 1993;7:19–24. doi: 10.1002/glia.440070106. [DOI] [PubMed] [Google Scholar]
- Le Borgne M, Etchart N, Goubier A, Lira SA, Sirard JC, van Rooijen N, Caux C, Aït-Yahia S, Vicari A, Kaiserlian D, Dubois B. Dendritic cells rapidly recruited into epithelial tissues via CCR6/CCL20 are responsible for CD8+ T cell crosspriming in vivo. Immunity. 2006;24:191–201. doi: 10.1016/j.immuni.2006.01.005. [DOI] [PubMed] [Google Scholar]
- Lee SW, Kim WJ, Choi YK, Song HS, Son MJ, Gelman IH, Kim YJ, Kim KW. SSeCKS regulates angiogenesis and tight junction formation in blood-brain barrier. Nat Med. 2003;9:900–906. doi: 10.1038/nm889. [DOI] [PubMed] [Google Scholar]
- Matsumoto Y, Fujiwara M. Absence of donor-type major histocompatibility complex class I antigen-bearing microglia in the rat central nervous system of radiation bone marrow chimeras. J Neuroimmunol. 1987;17:71–82. doi: 10.1016/0165-5728(87)90032-4. [DOI] [PubMed] [Google Scholar]
- McMahon EJ, Suzuki K, Matsushima GK. Peripheral macrophage recruitment in cuprizone-induced CNS demyelination despite an intact blood-brain barrier. J Neuroimmunol. 2002;130:32–45. doi: 10.1016/s0165-5728(02)00205-9. [DOI] [PubMed] [Google Scholar]
- Mildner A, Schmidt H, Nitsche M, Merkler D, Hanisch UK, Mack M, Heikenwalder M, Brück W, Priller J, Prinz M. Microglia in the adult brain arise from Ly-6C(hi)CCR2(+) monocytes only under defined host conditions. Nat Neurosci. 2007;10:1544–1553. doi: 10.1038/nn2015. [DOI] [PubMed] [Google Scholar]
- Muller WA. Leukocyte-endothelial-cell interactions in leukocyte transmigration and the inflammatory response. Trends Immunol. 2003;24:327–334. doi: 10.1016/s1471-4906(03)00117-0. [DOI] [PubMed] [Google Scholar]
- Murdoch C, Tazzyman S, Webster S, Lewis CE. Expression of Tie-2 by human monocytes and their responses to angiopoietin-2. J Immunol. 2007;178:7405–7411. doi: 10.4049/jimmunol.178.11.7405. [DOI] [PubMed] [Google Scholar]
- Nadeau S, Rivest S. Regulation of the gene encoding tumor necrosis factor alpha (TNF-alpha) in the rat brain and pituitary in response in different models of systemic immune challenge. J Neuropathol Exp Neurol. 1999;58:61–77. doi: 10.1097/00005072-199901000-00008. [DOI] [PubMed] [Google Scholar]
- Nadeau S, Rivest S. Glucocorticoids play a fundamental role in protecting the brain during innate immune response. J Neurosci. 2003;23:5536–5544. doi: 10.1523/JNEUROSCI.23-13-05536.2003. [DOI] [PMC free article] [PubMed] [Google Scholar]
- Nahrendorf M, Swirski FK, Aikawa E, Stangenberg L, Wurdinger T, Figueiredo JL, Libby P, Weissleder R, Pittet MJ. The healing myocardium sequentially mobilizes two monocyte subsets with divergent and complementary functions. J Exp Med. 2007;204:3037–3047. doi: 10.1084/jem.20070885. [DOI] [PMC free article] [PubMed] [Google Scholar]
- Oliner J, Min H, Leal J, Yu D, Rao S, You E, Tang X, Kim H, Meyer S, Han SJ, Hawkins N, Rosenfeld R, Davy E, Graham K, Jacobsen F, Stevenson S, Ho J, Chen Q, Hartmann T, Michaels M, et al. Suppression of angiogenesis and tumor growth by selective inhibition of angiopoietin-2. Cancer Cell. 2004;6:507–516. doi: 10.1016/j.ccr.2004.09.030. [DOI] [PubMed] [Google Scholar]
- Pakala R, Benedict CR. Endothelial cells regulate the proliferation of monocytes in vitro. Atherosclerosis. 1999;147:25–32. doi: 10.1016/s0021-9150(99)00144-6. [DOI] [PubMed] [Google Scholar]
- Platten M, Steinman L. Multiple sclerosis: trapped in deadly glue. Nat Med. 2005;11:252–253. doi: 10.1038/nm0305-252. [DOI] [PubMed] [Google Scholar]
- Popovich PG, Hickey WF. Bone marrow chimeric rats reveal the unique distribution of resident and recruited macrophages in the contused rat spinal cord. J Neuropathol Exp Neurol. 2001;60:676–685. doi: 10.1093/jnen/60.7.676. [DOI] [PubMed] [Google Scholar]
- Priller J, Flügel A, Wehner T, Boentert M, Haas CA, Prinz M, Fernández-Klett F, Prass K, Bechmann I, de Boer BA, Frotscher M, Kreutzberg GW, Persons DA, Dirnagl U. Targeting gene-modified hematopoietic cells to the central nervous system: use of green fluorescent protein uncovers microglial engraftment. Nat Med. 2001;7:1356–1361. doi: 10.1038/nm1201-1356. [DOI] [PubMed] [Google Scholar]
- Quan N, Stern EL, Whiteside MB, Herkenham M. Induction of pro-inflammatory cytokine mRNAs in the brain after peripheral injection of subseptic doses of lipopolysaccharide in the rat. J Neuroimmunol. 1999;93:72–80. doi: 10.1016/s0165-5728(98)00193-3. [DOI] [PubMed] [Google Scholar]
- Remington LT, Babcock AA, Zehntner SP, Owens T. Microglial recruitment, activation, and proliferation in response to primary demyelination. Am J Pathol. 2007;170:1713–1724. doi: 10.2353/ajpath.2007.060783. [DOI] [PMC free article] [PubMed] [Google Scholar]
- Rivest S. Molecular insights on the cerebral innate immune system. Brain Behav Immun. 2003;17:13–19. doi: 10.1016/s0889-1591(02)00055-7. [DOI] [PubMed] [Google Scholar]
- Robben PM, LaRegina M, Kuziel WA, Sibley LD. Recruitment of Gr-1+ monocytes is essential for control of acute toxoplasmosis. J Exp Med. 2005;201:1761–1769. doi: 10.1084/jem.20050054. [DOI] [PMC free article] [PubMed] [Google Scholar]
- Schilling M, Besselmann M, Müller M, Strecker JK, Ringelstein EB, Kiefer R. Predominant phagocytic activity of resident microglia over hematogenous macrophages following transient focal cerebral ischemia: an investigation using green fluorescent protein transgenic bone marrow chimeric mice. Exp Neurol. 2005;196:290–297. doi: 10.1016/j.expneurol.2005.08.004. [DOI] [PubMed] [Google Scholar]
- Sedgwick JD, Schwender S, Imrich H, Dörries R, Butcher GW, ter Meulen V. Isolation and direct characterization of resident microglial cells from the normal and inflamed central nervous system. Proc Natl Acad Sci U S A. 1991;88:7438–7442. doi: 10.1073/pnas.88.16.7438. [DOI] [PMC free article] [PubMed] [Google Scholar]
- Shen Q, Goderie SK, Jin L, Karanth N, Sun Y, Abramova N, Vincent P, Pumiglia K, Temple S. Endothelial cells stimulate self-renewal and expand neurogenesis of neural stem cells. Science. 2004;304:1338–1340. doi: 10.1126/science.1095505. [DOI] [PubMed] [Google Scholar]
- Simard AR, Soulet D, Gowing G, Julien JP, Rivest S. Bone marrow-derived microglia play a critical role in restricting senile plaque formation in Alzheimer's disease. Neuron. 2006;49:489–502. doi: 10.1016/j.neuron.2006.01.022. [DOI] [PubMed] [Google Scholar]
- Sunderkötter C, Nikolic T, Dillon MJ, Van Rooijen N, Stehling M, Drevets DA, Leenen PJ. Subpopulations of mouse blood monocytes differ in maturation stage and inflammatory response. J Immunol. 2004;172:4410–4417. doi: 10.4049/jimmunol.172.7.4410. [DOI] [PubMed] [Google Scholar]
- Tacke F, Alvarez D, Kaplan TJ, Jakubzick C, Spanbroek R, Llodra J, Garin A, Liu J, Mack M, van Rooijen N, Lira SA, Habenicht AJ, Randolph GJ. Monocyte subsets differentially employ CCR2, CCR5, and CX3CR1 to accumulate within atherosclerotic plaques. J Clin Invest. 2007;117:185–194. doi: 10.1172/JCI28549. [DOI] [PMC free article] [PubMed] [Google Scholar]
- Turrin NP, Rivest S. Tumor necrosis factor alpha but not interleukin 1β mediates neuroprotection in response to acute nitric oxide excitotoxicity. J Neurosci. 2006;26:143–151. doi: 10.1523/JNEUROSCI.4032-05.2006. [DOI] [PMC free article] [PubMed] [Google Scholar]
- Vallières L, Sawchenko PE. Bone marrow-derived cells that populate the adult mouse brain preserve their hematopoietic identity. J Neurosci. 2003;23:5197–5207. doi: 10.1523/JNEUROSCI.23-12-05197.2003. [DOI] [PMC free article] [PubMed] [Google Scholar]
- Villeneuve J, Tremblay P, Vallières L. Tumor necrosis factor reduces brain tumor growth by enhancing macrophage recruitment and microcyst formation. Cancer Res. 2005;65:3928–3936. doi: 10.1158/0008-5472.CAN-04-3612. [DOI] [PubMed] [Google Scholar]
- Villeneuve J, Galarneau H, Beaudet MJ, Tremblay P, Chernomoretz A, Vallières L. Reduced glioma growth following dexamethasone or anti-angiopoietin 2 treatment. Brain Pathol. 2008;18:401–414. doi: 10.1111/j.1750-3639.2008.00139.x. [DOI] [PMC free article] [PubMed] [Google Scholar]
- Williams K, Alvarez X, Lackner AA. Central nervous system perivascular cells are immunoregulatory cells that connect the CNS with the peripheral immune system. Glia. 2001;36:156–164. doi: 10.1002/glia.1105. [DOI] [PubMed] [Google Scholar]