A Unified Approach to Genotype Imputation and Haplotype-Phase Inference for Large Data Sets of Trios and Unrelated Individuals (original) (raw)
Abstract
We present methods for imputing data for ungenotyped markers and for inferring haplotype phase in large data sets of unrelated individuals and parent-offspring trios. Our methods make use of known haplotype phase when it is available, and our methods are computationally efficient so that the full information in large reference panels with thousands of individuals is utilized. We demonstrate that substantial gains in imputation accuracy accrue with increasingly large reference panel sizes, particularly when imputing low-frequency variants, and that unphased reference panels can provide highly accurate genotype imputation. We place our methodology in a unified framework that enables the simultaneous use of unphased and phased data from trios and unrelated individuals in a single analysis. For unrelated individuals, our imputation methods produce well-calibrated posterior genotype probabilities and highly accurate allele-frequency estimates. For trios, our haplotype-inference method is four orders of magnitude faster than the gold-standard PHASE program and has excellent accuracy. Our methods enable genotype imputation to be performed with unphased trio or unrelated reference panels, thus accounting for haplotype-phase uncertainty in the reference panel. We present a useful measure of imputation accuracy, allelic R2, and show that this measure can be estimated accurately from posterior genotype probabilities. Our methods are implemented in version 3.0 of the BEAGLE software package.
Introduction
Genotype imputation and haplotype-phase inference are important approaches for improving the power of genome-wide association (GWA) studies.1 Imputation has resulted in the detection of additional associations, particularly when combining data from multiple studies genotyped on different platforms.2–5 Haplotype-based association testing with phased haplotype data can also detect additional associations.6 Imputation can be used for identifying association between known, ungenotyped genetic variants and a trait. In contrast, haplotype-based association testing is not limited to testing known genetic variants, but the interpretation of haplotype-based association analysis is typically more difficult.
Imputation can be used for inferring genotypes at markers that have not been genotyped in one's sample. This is possible by using patterns of haplotypic variation seen in another data set (the reference panel) that includes the larger set of markers. There are a variety of existing methods for imputation or testing of ungenotyped markers.7–12 Until now, the reference panels used for imputation have been small, which has limited imputation accuracy. However, much larger reference panels are now, or will soon be, available for many populations because of large-scale sequencing and genotyping projects (e.g., HapMap phase 3 and the 1000 genomes project; see Web Resources). We show that larger reference panels substantially increase imputation accuracy, particularly for low-frequency variants. Our previous work has shown that the performance of the haplotype-frequency models that support imputation can depend on reference panel size.13 Methods that perform exceptionally well for small data sets may have suboptimal performance for large data sets, particularly when computational constraints limit the complexity of the haplotype-frequency model. Existing imputation methods have been tested and used with small reference panels of 60 phased individuals. New imputation methods are needed that can accommodate large reference panels and combinations of unrelated and parent-offspring data.
We present new methods for imputation of ungenotyped markers in which the sample and reference panel contain data for parent-offspring trios, parent-offspring pairs, and unrelated individuals. Our methods use a haplotype-frequency model that is computationally efficient and that can make full use of the information in large reference panels.13 We have implemented our methods in a software package, BEAGLE. We show that BEAGLE scales easily to large reference panels with thousands of individuals, whereas IMPUTE,7 one of the best-performing methods for reference panels with 60 phased individuals from the HapMap,14 does not scale well to larger reference panels.
Our current work also extends our haplotype-phase-inference methods for unrelated individuals to large trio data sets. Trios contain additional information on haplotype phase compared to unrelated individuals, in the form of constraints imposed by the rules of Mendelian inheritance. Thus, using specific trio-phasing methods leads to extremely accurate estimates of haplotype phase.15 Our trio-phasing method is four orders of magnitude faster than the gold-standard PHASE program and has excellent accuracy.
We also present extensive results of data analyses, investigating not only the performance of our methodology, but also examining questions of wider interest. In particular, we demonstrate the power advantages of large reference panels for association testing, even when the reference panels are unphased.
Researchers must be able to assess the accuracy of imputed genotypes when the true genotype is unknown, so that poorly imputed markers can be identified prior to downstream analysis. To this end, we introduce a measure of imputation accuracy, allelic R2, the squared correlation between the allele dosage with the highest posterior probability and the true allele dosage. We discuss the advantages of the allelic R2 measure, and we show that it can be estimated from the posterior genotype probabilities (see Appendix 1).
Material and Methods
Hidden Markov Model
We present a unified framework for inferring haplotype phase and missing data that is applicable to a general class of hidden Markov models (HMMs), which we call haplotype HMMs (see Appendix 2 and Rabiner16). In Appendix 2, we show that haplotype HMMs can be generalized in an obvious way for producing HMMs for genotype data for individuals, parent-offspring pairs (one parent and one child), and parent-offspring trios (two parents and one child). Analysis of haplotype HMMs can be used for inferring haplotypes and imputing missing genotypes for individuals, parent-offspring pairs, and parent-offspring trios conditional upon the observed genotype data. For example, with parent-offspring trios, the haplotype HMM provides a model of haplotype frequencies for the four independent haplotypes in a parent-offspring trio. The four independent haplotypes are the transmitted and untransmitted haplotypes from each parent, and each set of four haplotypes corresponds to a possible trio phasing. The observed genotype data for a trio constrain the possible trio phasings for each trio. These constraints are incorporated in the emission probabilities for the HMM.
In Appendix 3, we present our methods for building a haplotype HMM from phased genotype data. Haplotypes from any combination of individual or parent-offspring trios (with or without an ungenotyped parent) can be used for building the model, if haplotypes shared by parent and child are counted as a single haplotype. Individuals, parent-offspring pairs, and parent-offspring trios contribute two, three, and four independent haplotypes, respectively. We use an iterative algorithm for fitting a haplotype HMM to genotype data that alternates between model building and sampling. In the model-building step, current estimates of phased haplotypes are used for building a new haplotype HMM. In the sampling step, new haplotypes are sampled for each individual, parent-offspring pair, or parent-offspring trio conditional upon the genotype data and the current haplotype HMM. The iterative algorithm begins with model building. Estimated phased haplotypes for the initial iteration are obtained by imputing missing genotypes at random according to allele frequencies and randomly phasing heterozygous genotypes. With our methods, typically ten iterations of the model-building and sampling steps are sufficient to obtain a very accurate haplotype HMM.
We found that we were able to greatly improve the performance of our method by including haplotype weights and adjusting these weights during the first few iterations of the algorithm. Each haplotype is assigned a unit weight when building the model when there is sporadic missing data (see Appendix 3). When imputing ungenotyped markers in a sample with a reference panel, we assign reference panel haplotypes a weight of 1, and we down-weight the haplotypes in the sample during the model-building phase for the first five iterations of the algorithm. If there are N haplotypes in the sample, we assign each haplotype a weight of 1/N for the first two iterations and a weight of 1/N(6-k)/4 for iterations k = 3, 4, and 5. For iterations ≥6, all haplotypes in the sample and reference panel are assigned weight of 1. This weighting scheme forces the initial estimates of haplotype phase and missing data in the sample to be primarily determined by the reference panel data. Our experiments with simulated data indicate that if down-weights are not used, hundreds of iterations are required to achieve the imputation accuracy obtained when using down-weights with ten iterations (data not shown).
Our methods also permit one to sample multiple haplotypes for each individual, parent-offspring pair, and parent-offspring trio and to use the multiple sampled haplotypes when building the haplotype HMM. When multiple sampled haplotypes are used, the multiple sampling is accounted for by down-weighting each haplotype. For example, if k haplotype pairs are sampled for an unrelated individual, each haplotype is given weight w/k, where w is the weight per haplotype when only one haplotype pair is sampled for the individual.
When imputing diallelic markers with alleles A and B in unrelated individuals, we calculate posterior genotype probabilities by summing the probabilities of the HMM states that correspond to the AA, AB, and BB genotypes. The imputed posterior genotype probabilities can be used in downstream analyses. We have found that averaging the posterior genotype probabilities over multiple iterations of the algorithm increases the imputation accuracy. When imputing missing ungenotyped markers with a reference panel, we average posterior genotype probabilities obtained from iterations ≥6.
Our methods for haplotype-phase inference and genotype imputation are implemented in BEAGLE 3.0. BEAGLE produces most likely haplotypes and sampled haplotypes for each individual with all missing data imputed. When imputing genotypes in samples of unrelated individuals, BEAGLE produces posterior genotype probabilities for imputed genotypes. BEAGLE 3.0 also includes an option for reducing memory usage with a two-level “checkpoint” algorithm.17,18 Checkpoint algorithms store probabilities in HMM calculations for a subset of markers (called checkpoints) and then recalculate probabilities from the checkpoints as needed. Using BEAGLE's optional checkpoint algorithm increases running time by a factor of less than two and reduces memory usage during HMM sampling from O(M) to order O(sqrt[_M_]), where M is the number of markers.
All analyses in this study were performed with BEAGLE 3.0 with default parameter settings (i.e., four samples per individual and ten iterations). Computing runs were performed on a Linux server with eight dual-core AMD Opteron 8220 SE processors (running at 2.8 GHz, with a 1 MB cache, and using a 64-bit architecture) and a total of 64 GB of RAM. All reported computational times were obtained by adding user and system times from the Linux “time” command, and they thus are equivalent to those that would be obtained with only a single CPU core.
Real Data Sets
We used unphased trio data from HapMap release 21 for 30 trios of Utah residents with ancestry from northern and western Europe (CEU panel) and 30 trios of Yoruba sampled from Ibadan Nigeria (YRI panel).14 If a marker exhibited a Mendelian inconsistency in the unphased HapMap data for a trio, the genotypes for that marker were set to missing in both the parents and the child for that trio. We assessed the accuracy of our methods for inferring haplotype phase and missing data in parent-offspring trios by applying our methods to unphased HapMap CEU and YRI data and comparing our results with the HapMap's published phasing for these data generated with the PHASE program.19 We also used the HapMap CEU data to compare the accuracy of genotype imputation with a phased reference panel, an unphased unrelated reference panel, and an unphased trio reference panel.
We used genotype data from the Affymetrix GeneChip Human Mapping 500K Array (the Affymetrix 500K chip) generated by the Wellcome Trust Case Control Consortium (WTCCC).20 The WTCCC study included approximately 2000 cases for each of seven diseases (bipolar disorder, coronary artery disease, Crohn's disease, hypertension, rheumatoid arthritis, type 1 diabetes, and type 2 diabetes) and approximately 3000 shared controls. The shared controls were comprised of 1500 individuals selected from a UK sample of blood donors and 1500 individuals from the 1958 British Birth Cohort.21 We also used genotype data generated by the Wellcome Trust Sanger Institute with the Illumina Infinium HumanHap550 SNP BeadChip (the Illumina 550K chip) for the 1958 British Birth Cohort samples. Genotypes for the Affymetrix 500K chip were called with Chiamo,20 and genotypes for the Illumina 550K chip were called with Illumina's GenCall software. We excluded all individuals who were excluded by the WTCCC in their primary analysis.20 For the 1958 British Birth Cohort, we limited our analyses to 1388 individuals that had been genotyped on both the Affymetrix and Illumina platforms.
Our previous multilocus analysis of WTCCC data had demonstrated that multilocus analysis can be particularly sensitive to intercohort differences in genotype error rates.6 We excluded all markers that were excluded in the WTCCC's analysis,20 and we imposed additional data-quality filters designed to increase genotype accuracy and to exclude markers with problematic data. Genotypes for the Affymetrix 500K chip were set to missing if the Chiamo posterior probability for the genotype was <0.99. Genotypes for the Illumina 550K chip were set to missing if the GenCall score was <0.6. For members of the 1958 Birth Cohort, genotypes were set to missing if the Affymetrix and Illumina platforms produced conflicting genotypes. Markers were excluded for a cohort if the missing rate was >2% in that cohort or if the Hardy-Weinberg equilibrium p value for the marker was <10−7. We excluded any marker with minor-allele frequency <0.01 in the 1958 British Birth Cohort.
Because the interpretation of the genotype depends on the chromosome strand used to define the alleles, we checked that the chromosome strand was consistent between data sets and changed alleles to their complementary alleles when necessary. Markers were excluded if the genomic position in NCBI Build 35 coordinates in the marker annotation files for the Affymetrix data or for the Illumina data were not consistent with the position given for the marker in the HapMap data set. A decision to change alleles to their complementary alleles was based on three sources of information: observed alleles (A/C/G/T), minor-allele frequency, and linkage disequilibrium correlation patterns within a 100 marker radius. Differences in minor-allele frequency between data sets were considered significant if the difference was >0.2 and if the difference was significant at the 0.01 level. If changing an allele to the complementary allele for a marker in a data set did not resolve the discrepancy between data sets, the marker was excluded from one of the non-HapMap data sets.
For chromosome 1, after data-quality filtering, there were 53,683 markers genotyped on the 1958 British Birth cohort with one or both of the Affymetrix 500K and Illumina 550K chips. A subset of 24,705 of these markers were present on the Illumina 550K chip and in HapMap phase 2 data14 but absent from the Affymetrix 500K chip. This subset of 24,705 markers was masked and imputed in subsamples of the 1958 British Birth Cohort. From the 1388 individuals in the 1958 British Birth Cohort, we selected three random samples of 188, 788, and 1088 individuals. The 24,705 chromosome 1 markers absent from the Affymetrix 500K chip but present on the Illumina 550K chip and in HapMap phase 2 data were masked in each sample. For each sample, the remaining 1200, 600, or 300 individuals (or a subset of these remaining individuals) were used as a reference panel with genotype data from both the Affymetrix 500K and Illumina 550K chip. Although a proportion of Illumina genotypes for the imputed markers will be incorrect, this proportion is expected to be small, and Illumina genotypes are considered to be the true genotype when computing measures of imputation accuracy in this study.
Comparison with IMPUTE
We compared BEAGLE 3.0 with IMPUTE7 version 0.5.0 in terms of imputation accuracy and computational efficiency. We evaluated imputation accuracy by using Chromosome 1 markers imputed in a sample of 188 individuals with reference panels of 60 phased individuals (CEU HapMap), 300 unphased individuals, and 600 unphased individuals. A comparison using larger reference panels was not practical for the full chromosome 1 data because of IMPUTE's much greater computational requirements. Because IMPUTE requires a phased reference panel, the unphased reference panels were phased with BEAGLE13 for use in the IMPUTE analysis. As a result, the accuracy of inferred haplotypes in the reference panel was similar when imputing genotypes with BEAGLE or IMPUTE.
We compared the computational efficiency of BEAGLE and IMPUTE for increasingly large reference panels by using a subset of chromosome 1 data comprising a 5 Mb region with 1356 markers genotyped in the reference sample, of which 746 markers were genotyped in the sample. Computational times were measured when imputing ungenotyped markers in a sample of 188 individuals with reference panels of 300, 600, and 1200 individuals. For BEAGLE, the reference sample was unphased, whereas for IMPUTE, the reference panel was phased (with phase inferred by BEAGLE).
Simulated Data Sets
We evaluated our trio-phasing methods on large sample sizes with realistic, simulated trio data. We generated simulated data by using Cosi22 with parameters calibrated to empirical human data for individuals with European ancestry (CEU) or with ancestry of Yoruba in Ibadan, Nigeria (YRI). Each simulated data set has a recombination rate sampled from a distribution matching the Decode map.23 Three sample sizes were simulated: 30, 300, and 3000 trios. Four parental chromosomes were simulated, and one of the chromosomes of each parent was selected to be transmitted to the offspring. The simulated regions were all of 1 Mb in length. For each data set, we randomly selected markers with minor-allele frequencies of greater than 0.05 to achieve an average marker density of one marker per 6 kb or one marker per 1 kb. One hundred data sets were simulated for each sample size, ethnicity, and marker density.
In each data set, 0.5% of individual genotypes, chosen at random, were set to missing. In addition, 0.5% of trios were set to missing (i.e., the three genotypes for the trio were all set to missing, as might be done when a Mendelian inconsistency is found). These rates of missingness are somewhat different from those seen in the unphased HapMap Phase II data. In the HapMap data, after setting trios with Mendelian inconsistencies to missing, there were 13 single-nucleotide polymorphisms (SNPs) per Mb per trio with the entire trio missing in the CEU panel (19 in the YRI panel), compared to 20 in the 1 SNP per kb simulated data. The rate of sporadic missing data (one or two individuals in the trio missing at the SNP) was 78 SNPs per Mb per trio in the CEU panel (83 in the YRI panel), compared to 20 in the simulated data at the 1 SNP per kb density.
Allelic Association Tests
We investigated the effect of use of imputed genotype data on power to detect disease associations by comparing p values computed with true genotype data with p values computed with imputed posterior genotype probabilities. For this analysis, p values were computed after excluding 300 individuals in the 1958 British Birth Cohort that were used as an unphased reference panel. p values were computed for markers that the WTCCC reported as showing evidence of disease association, excluding any marker that had more than 2% missing data in either of the two control cohorts or the case cohort. p values were computed three ways: with genotype data, with imputed data generated from a phased reference panel of 60 individuals (HapMap CEU), and with imputed data generated from an unphased reference panel with 300 individuals. The data for each marker was imputed after masking that marker in the sample. Standard chi-square, allelic trend, and Fisher Exact tests are not valid when applied to the posterior genotype probabilities for imputed data. Hence, we compared estimated allele dosage in cases and controls with a two-sample t test. For large sample sizes, the central limit theorem ensures that the test statistic has the appropriate null distribution. For genotype data, the allele dosage for each individual was obtained from the observed genotype data. For imputed data, the estimated allele dosage for each individual was obtained from the imputed posterior genotype probabilities. For imputed data, p values were computed with only those individuals who had nonmissing genotype data so that the p values from imputed data and from observed genotype data are derived from the same set of individuals.
Metrics for Trio Phasing
We used four metrics to measure accuracy of trio phasing. The transmission error rate is the proportion of nonmissing parental genotypes with ambiguous phase that were incorrectly phased. The denominator of the transmission error rate is the number of parent genotypes for which the parent is heterozygous and the transmission is ambiguous (because of missing or heterozygote genotypes for the child and other parent). The numerator of the transmission error rate is the number of such parent genotypes for which the phasing is incorrect (i.e., the incorrect allele is recorded as having been transmitted). For example, if both parents and child of a trio have the same heterozygous genotype, the trio will contribute either 0 or 2 parents to the numerator, and 2 parents to the denominator of the transmission error rate.
The missing trio error rate is the proportion of parental alleles in trios with missing data for both parent and child that are incorrectly imputed. The missing trio error rate has as its denominator twice (given that there are two alleles per genotype) the number of parent genotypes for which the parent and child genotypes are missing. The numerator of the missing trio error rate is the number of alleles in such phased parent genotypes that are incorrectly imputed. For example, if the true phased parental genotype is AG, and the imputed phased parental genotype is AA, this would count as one error, whereas if the imputed phased parental genotype is GA, this would count as two errors.
The sporadic missing error rate is the proportion of incorrectly imputed alleles in parents with missing genotype data for themselves and nonmissing genotype data for their child. The sporadic missing error rate has as its denominator twice the number of parent genotypes for which the parent genotype is missing but the child genotype is nonmissing. The numerator for the sporadic missing error rate is the number of alleles in such phased parent genotypes that are incorrectly imputed (as for the missing trio error rate).
We also calculated an error rate per trio per SNP, which is the sum of the numerators of the three types of error (transmission, missing trio, and sporadic missing error rates), divided by the number of trios and by the total number of SNPs.
Metrics for Imputation
We assessed the calibration and precision of estimated posterior genotype probabilities for imputed genotypes. The metrics we describe below are applied at multiple levels: the genotype level (genotype concordance rate), the marker level (allelic R2 and standardized allele frequency), and the study level (allele-frequency correlation). We also use a Wilcoxon signed-rank test to compare accuracy of estimated allele frequencies for pairs of imputed data that were imputed with different reference panels.
Genotype Concordance Rate
The calibration of imputed genotypes was evaluated by calculating the concordance rate between the most likely imputed genotype and the true genotype. For imputed genotypes with posterior probability α, we expect the genotype concordance rate to be approximately α.
Allelic R2
We assessed the accuracy of imputed genotypes in terms of the squared correlation between the allele dosage (number of minor alleles) of the most likely imputed genotype and the allele dosage of the true genotype. We call this quantity the allelic R2. Allelic R2 has several desirable properties that make it an excellent metric for evaluating imputation accuracy. Allelic R2 has a simple interpretation in terms of statistical power, similar to the interpretation of the squared correlation between two diallelic markers.24 Under Hardy-Weinberg equilibrium, if an allele confers risk for a disease, N cases and controls with genotype data for the marker have approximately the same statistical power to detect association as N/r2 cases and controls with imputed data for the marker where r2 is the allelic R2 for the imputed data. Thus, allelic R2 measures the loss of power when the most likely imputed genotypes are used in place of the true genotypes for a marker. Association analyses using posterior imputed genotype probabilities can be more powerful than analysis using most likely imputed genotypes because posterior genotype probabilities contain more information. Consequently, the loss of power measured by allelic R2 is an upper bound on the loss of power when imputed posterior genotype probabilities are used in place of the true genotypes for a marker. Another advantage of allelic R2 is that its interpretation does not depend on allele frequency.
We show that allelic R2 can be estimated from the imputed posterior genotype probabilities without knowledge of the true genotypes (see Appendix 1). The ability to estimate allelic R2 from imputed posterior genotype probabilities is an important feature because the true genotype is generally unknown. The estimated allelic R2 can be used for identifying or excluding markers with poor imputation accuracy prior to downstream analysis.
Another estimate of imputation accuracy is the ratio of the variance of the imputed allele dosage and the variance of the true allele dosage. The variance of the true allele dosage is unknown, but it can be estimated as 2p(1−p) under Hardy-Weinberg equilibrium, where p is the estimated allele frequency. This ratio of variances has also been called _r_2,25 but it does not directly estimate allelic _R_2 and thus is different than the allelic _R_2 estimate presented in Appendix 1.
Standardized Allele-Frequency Error
For each imputed marker, we define the allele-frequency error as the difference between the true allele frequency in the sample and the estimated allele frequency in the sample computed from the posterior genotype probabilities. If the three posterior genotype probabilities for an individual are denoted _p_AA, _p_AB, and _p_BB, then the estimated A allele frequency is found by summing (2_p_AA + _p_AB) over all individuals and dividing by twice the number of individuals. However, allele-frequency error is difficult to interpret unless the true allele frequency and sample size are known. An allele-frequency error of 0.01 is more serious when the allele frequency is 0.01 than when the allele frequency is 0.5. An allele-frequency error of 0.01 is also more serious when the sample size is 10,000 than when the sample size is 100 because the larger sample size gives a much more precise population allele-frequency estimate from genotype data. This motivates us to standardize the allele-frequency error by the standard error of the population allele-frequency estimate from the true genotype data. If pA is the allele frequency in the sample of n individuals from a population in Hardy-Weinberg equilibrium, the standard error of the population allele-frequency estimate is approximately sqrt(_pA_[1 − pA_]/_[_2n_]). If qA is the estimated allele frequency obtained from the imputed posterior genotype probabilities, we define the standardized allele-frequency error to be
|pA−qA|/(pA[1−pA]/[2n])1/2
Thus, a standardized allele-frequency error of z indicates that the error in estimated allele frequency from imputed data is approximately z times the standard deviation of the estimated population allele frequency obtained from the true genotypes.
Allele-Frequency Correlation
The allele-frequency correlation is the correlation over the set of imputed markers between the estimated sample minor-allele frequency from imputed posterior genotype probabilities and the true sample minor-allele frequency. The allele-frequency correlation can be used for comparing imputation accuracy under different scenarios, with different reference panels or different samples.
Wilcoxon Signed-Rank Test
We used a two-sided Wilcoxon signed-rank test to test for differences in imputation accuracy for markers imputed with two different reference panels but the same sample. For each imputed marker m, let Xm be the absolute allele-frequency error using reference panel 1 and let Ym be the absolute allele-frequency error using reference panel 2. The null hypothesis of the Wilcoxon signed-rank test is that the median of Xm − Ym equals 0. Rejecting the null hypothesis implies that there are differences in accuracy of the estimated sample allele frequencies derived from the two reference panels.
Results
Calibration of Posterior Genotype Probabilities
The posterior genotype probabilities produced by our methods are well calibrated. Figure 1 presents the genotype accuracy rate for the imputed genotype with the highest posterior probability. Genotypes were imputed in a sample of 1088 individuals with a phased reference panel of 60 individuals, and imputed genotypes were binned according to their posterior probability. For each bin, the proportion of imputed genotypes concordant with the called genotype was approximately equal to the posterior genotype probability for the bin. Similar results were obtained when imputation was performed with an independent unphased reference panel of 300 individuals (data not shown).
Figure 1.
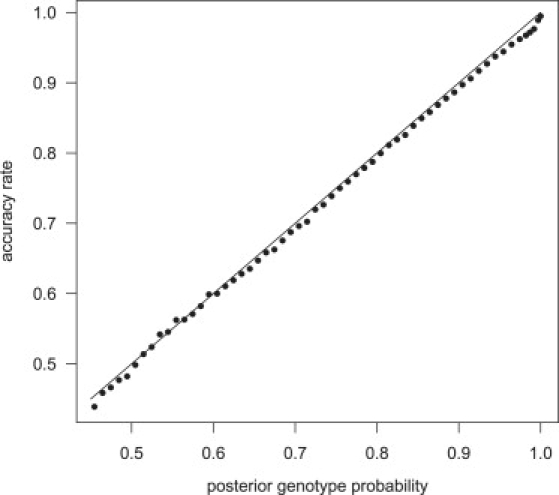
Calibration of Posterior Genotype Probabilities
Genotypes for chromosome 1 markers on the Illumina 550K chip, but not the Affymetrix 500K chip, were imputed with a phased reference panel of 60 individuals (HapMap CEU panel) in a sample of 1088 individuals genotyped on the Affymetrix 500K chip. Imputed genotypes are divided into bins according to their posterior genotype probability. The proportion of imputed genotypes that are consistent with the Illumina genotype are given for each bin. The line is the set of points with equal posterior genotype probability and accuracy rate.
We also found that our estimate of allelic R2, calculated from posterior genotype probabilities (see Appendix 1), had good accuracy. Allelic R2 was estimated for each imputed marker in a sample of 1088 individuals. Markers were imputed with a phased reference panel of 60 individuals (HapMap CEU panel) and imputed with an unphased reference panel of 300 individuals. For the phased reference panel (60 individuals), the correlation was 0.938 between the estimated allelic R2 (estimated without knowledge of the true genotypes) and the actual allelic R2 (calculated from the true genotypes). For the unphased reference panel (300 individuals), the correlation was 0.986 between the estimated and actual allelic R2. When markers were imputed with the phased reference panel of 60 individuals, 62%, 83%, and 91% of imputed of markers had estimated allelic R2 within 0.05, 0.1, and 0.15, respectively, of the actual allelic R2. For the larger unphased reference panel of 300 individuals, the estimates were even more accurate: 87%, 97%, and 99% of markers had estimated allelic R2 within 0.05, 0.1, and 0.15, respectively, of the actual allelic R2. We also investigated the accuracy of the estimated allelic R2 for larger unphased reference panels and for different sample sizes. As expected, we found that using larger unphased reference panels or larger samples increases the accuracy of the estimated allelic R2 (data not shown).
Effect of Reference Panel Size
We next investigated the effect of reference panel size on imputation accuracy. Figure 2 shows the cumulative distribution function of allelic R2 in a sample of 188 individuals for markers imputed with different reference panels: 60 phased individuals (CEU HapMap) and 100, 300, 600, or 1200 unphased individuals. Figure 2 demonstrates that increasing the reference panel size markedly increases imputation accuracy.
Figure 2.
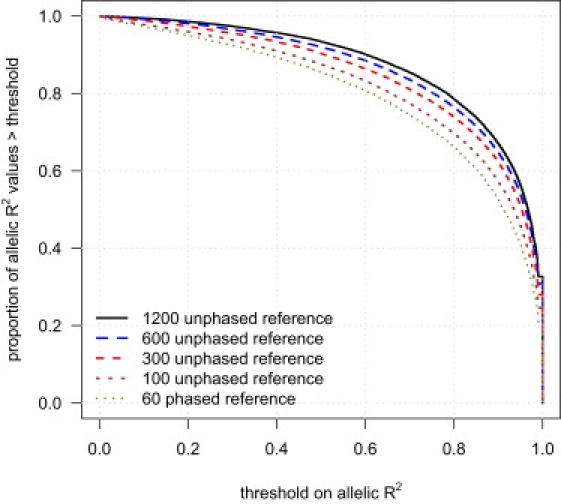
Imputation Accuracy and Reference Panel Sample Size
Genotypes for markers on the Illumina 550K chip, but not the Affymetrix 500K chip, were imputed in a sample of 188 individuals with five different reference panels: 60 phased individuals and 100, 300, 600, and 1200 unphased individuals. For each reference panel, the proportion of imputed markers whose allelic R2 (see Material and Methods) exceeds each threshold is given. The allelic R2 for each imputed marker is calculated with the assumption that the Illumina genotypes are the true genotypes.
Imputation accuracy increases with increased reference panel size across all frequencies, but the increase is greatest for the lowest-frequency markers. Figure 3 shows the median allelic R2 as a function of allele frequency for imputed markers in a sample of 1088 individuals obtained from imputation with reference panels of 60 phased individuals and 300 unphased individuals. The larger, unphased reference panel has markedly higher median allelic R2 than the smaller phased reference panel, with low-frequency markers showing the greatest difference. With a reference panel of 300 unphased individuals, the median allelic R2 was ≥0.92 for all frequency bins. Figure 3 also shows that imputation accuracy tends to increase with the minor-allele frequency of the imputed marker.
Figure 3.
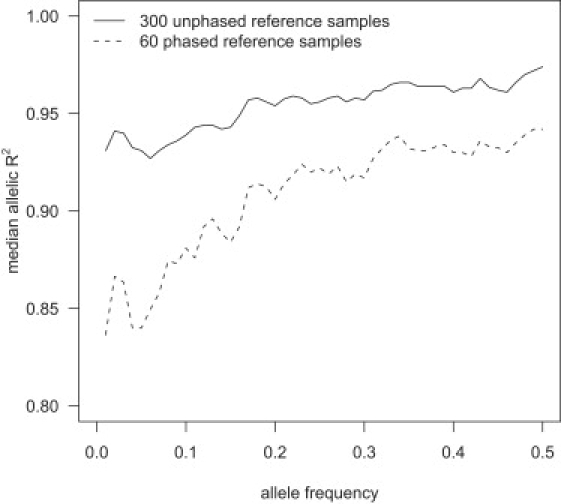
Median Allelic R2 and Minor-Allele Frequency
Genotypes for markers on the Illumina 550K chip, but not the Affymetrix 500K chip, were imputed with two different reference panels in a sample of 1088 individuals genotyped on the Affymetrix 500K chip. For each minor-allele frequency, x = 0.01, 0.02, …, 0.5, the median allelic R2 for imputed markers with minor-allele frequency between x − 0.01 and x + 0.01 is plotted.
The advantage of larger reference panels is also seen with the allele-frequency correlation metric. For reference panels of 60 phased individuals and 100, 300, 600, and 1200 unphased individuals, the allele-frequency correlation increases with reference panel size: 0.9902 (60), 0.9944 (100), 0.9976 (300), 0.9982 (600), and 0.9986 (1200). Similarly, the proportion of imputed markers for which the standardized allele-frequency error is less than 0.25 also increases: 0.51 (60), 0.60 (100), 0.71 (300), 0.75 (600), and 0.78 (1200).
The advantages of improved imputation accuracy are also seen when testing imputed markers for association with a trait. The left panel of Figure 4 shows p values from allelic association tests (see Material and Methods) using WTCCC data for 15 markers that the WTCCC described as showing the strongest association signals in its study,20 that have control frequency >0.10, and that have evidence of association in replication studies (excluding markers in the major histocompatibility complex [MHC]). The right panel of Figure 4 shows p values from allelic association tests for nine markers showing moderate or strong evidence of association (p < 10−5) in the WTCCC study, that had minor-allele frequency <0.10 in controls, and <2% missing data in each case and control cohort.
Figure 4.
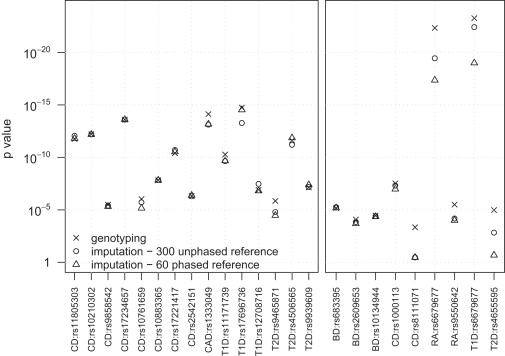
Allelic Test p values for SNPs Associated with Disease in the WTCCC Study
Allelic test p values were computed from data for approximately 2000 cases and approximately 2500 controls genotyped with the Affymetrix 500K chip. Two reference panels were used for imputing data: 300 unphased individuals genotyped on both the Affymetric 500K and Illumina 550K chips and 60 phased individuals from the HapMap CEU panel. For each marker of interest, p values were calculated for the original genotype data and for the imputed data obtained from each reference panel. The imputed data for each marker of interest was obtained after masking the genotype data for the marker in the sample. The allelic test was a two-sample t test of the estimated allele dosage in each individual. Left panel: p values for 15 markers (outside the MHC) that have minor-allele frequency >0.10 in controls, that show the strongest association (p < 5 × 10⁻⁷) on an allelic or genotypic test in the WTCCC study, and that have evidence of association in replication studies. Right panel: p values for nine markers with minor-allele frequency between 0.06 and 0.10 in controls that were reported to show moderate or strong association (p < 10−5) on an allelic or genotypic test in the WTCCC study. One marker (rs6679677) that is associated with two diseases (rheumatoid arthritis and type 1 diabetes) is repeated.
The genotype signal data for all markers in Figure 4 were checked by the WTCCC for confirmation of good genotype clustering.20 p values were calculated with genotype data, with imputed data from a phased reference panel of 60 individuals, and with an unphased reference panel of 300 individuals. In the left panel of Figure 4, there is no clear difference between the two reference panels for the 15 imputed high-frequency markers, unlike the results in Figure 2 for the much larger set of imputed chromosome 1 markers. However, for all nine low-frequency markers in the right panel, p values obtained with a reference panel of 300 unphased individuals were smaller than p values obtained with a reference panel of 60 phased individuals. For six of the nine markers, the p values from the larger reference panel were at least 25% smaller than the p values from the smaller reference panel. All of these markers had minor-allele frequencies >0.06 (but <0.10) in controls. Figure 3 suggests that larger reference panels will have even greater impact on p values for markers with minor-allele frequency <0.06.
For some markers in Figure 4, the p value calculated from imputed data is smaller than the p value calculated from genotype data. This could indicate the presence of genotype error in the original data. However, genotype error rates should be extremely low because of our stringent data-quality filters, and the WTCCC reported good genotype clustering for all of these markers.20 In our view, a more likely explanation for the occasional smaller p value from imputed data is the variability in the estimates of allele dosage from imputed data.
Comparison with IMPUTE
We measured imputation accuracy for BEAGLE 3.0 and IMPUTE 0.5.0 with reference panels of 60, 300, and 600 individuals and a sample of 188 individuals. The difference in accuracy between BEAGLE and IMPUTE decreases as the size of the reference panel increases. The allele-frequency correlations were 0.9902 (BEAGLE) and 0.9917 (IMPUTE) with a reference panel of 60 individuals, 0.99753 (BEAGLE) and 0.99761 (IMPUTE) with a reference panel of 300 individuals, and 0.99824 (BEAGLE) and 0.99822 (IMPUTE) with a reference panel of 600 individuals. The difference in accuracy between IMPUTE and BEAGLE is substantially smaller than the gain in accuracy obtained from using larger reference panels.
We also compared computation times for BEAGLE and IMPUTE when imputing data in a 5 Mb region of chromosome 1 in a sample of 188 individuals with reference panels of 300, 600, and 1200 individuals. Running times for BEAGLE were 2.7 min, 5.5 min, and 12.0 min for reference samples of 300, 600, and 1200 unphased individuals. Running times for IMPUTE were 60.3 min, 220.2 min, and 829.6 min for reference samples of 300, 600, and 1200 phased individuals. IMPUTE's computation times increased relative to BEAGLE's as the reference panel size increases, and for a reference panel of 1200 individuals, IMPUTE's computation time was 69 times longer than BEAGLE's. IMPUTE required 33 Gb of memory to impute data for the 5 Mb region when using a reference panel of 1200 individuals, and BEAGLE required 1 Gb. IMPUTE could be modified to reduce memory usage by using a checkpoint algorithm (see Material and Methods), but this modification would be expected to double IMPUTE's running time.
Computational times for IMPUTE are approximately quadratic in the size of the reference panel and linear in the size of the sample. Computational times for BEAGLE depend on the combined size of the reference panel and the sample. BEAGLE's computation time can be made linear in the size of the sample by dividing the sample into disjoint subsamples and performing imputation separately in each subsample.
Other Factors Affecting Imputation Accuracy
Size of the Sample
The accuracy of estimated allele frequency increases as the size of the sample increases. However, the effect of the sample size on imputation accuracy is much smaller than the effect of the reference panel size on imputation accuracy. Genotypes were imputed in samples of 1088, 544 (1088/2), and 272 (1088/4) individuals. As the sample size increases, the allele-frequency correlation increases, as follows: 0.9981 (272), 0.9985 (544), and 0.9987 (1088). Although the allele-frequency correlation increases with sample size, the proportion of markers with standardized allele-frequency error <0.25 decreases as the sample size increases, as follows: 0.69 (272), 0.64 (544), 0.56 (1088). Thus, as the sample size increases, a larger portion of the error in the population allele-frequency estimate is due to imputation, and a smaller proportion of the error is due to sampling variability in the sample. Similar results were seen with a reference panel of 60 phased individuals (HapMap CEU) and samples of 272, 544, and 1088 individuals.
Population Differences between Sample and Reference Panel
Figure 2 shows that imputation using a reference panel of 60 phased individuals is less accurate than imputation using a reference panel of 100 unphased individuals. Some of this difference in accuracy may be due to population differences between the sample and the reference panel. The reference panel of 60 phased individuals is from the HapMap CEU data, whereas the reference panel of 100 unphased individuals and the sample are both from the 1958 British Birth Cohort. We investigated the effect of these population differences while controlling for differences in markers, haplotype phasing, and reference panel size. We did not control for differences in sporadic missing data and genotype error profiles that exist between the HapMap CEU data and the 1958 British Birth Cohort data. However, we expect differences in missing genotype profiles and genotype error profiles to have a relatively minor effect on imputation accuracy because of the stringent quality-control filtering we applied to the 1958 British Birth Cohort data and the high quality of the HapMap data.
We compared two unphased reference panels of 60 individuals each. One unphased reference panel was the parental data for the 30 CEU HapMap trios obtained by randomly phasing the phased parental data. The other unphased reference panel was 60 individuals from the 1958 British Birth Cohort. Both reference panels were restricted to the markers genotyped on at least one of the Affymetrix or Illumina chips. We used each unphased reference panel to impute markers in the sample of 188 individuals from the 1958 British Birth Cohort. The allele-frequency correlation was 0.9895 with the unphased HapMap CEU reference panel and 0.9903 with the 1958 British Birth Cohort reference panel. For comparison, the allele-frequency correlation with a larger unphased reference panel of 100 individuals from the 1958 British Birth Cohort was 0.9944. This indicates that most of the difference in imputation accuracy seen in Figure 2 between the reference panel of 60 phased individuals (HapMap CEU) and the reference panel of 100 unphased individuals is due to sample size rather than to population differences between the HapMap reference panel and the sample.
Phased versus Unphased Reference Panel
Because the phase of unphased data can be inferred, we expect any difference in imputation accuracy between phased and unphased reference panels will reflect the difference in haplotype-phase accuracy between phasing unrelated individuals and parent-offspring trios. We imputed Illumina markers in 1088 individuals with phased parental data (phased with PHASE19) for the 30 Hapmap CEU trios and with unphased parental data for the 30 HapMap CEU trios. The unphased parental data was obtained by randomly ordering the heterozygote genotypes in the phased parental data. The difference in imputation accuracy was small but statistically significant (Wilcoxon test p < 10−8). The allele-frequency correlation was 0.9908 with unphased parental data and 0.9916 with phased data.
Trio Reference Panel
All applications of imputation to genome-wide association studies that we have seen so far have used phased HapMap data as a reference panel. The inferred haplotypes in the phased HapMap data are extremely accurate because they are obtained from parent-offspring trio data.15 However, one disadvantage of using a phased reference panel is that any uncertainty in the inferred haplotype phase and missing data imputation is ignored. This disadvantage can be overcome by using unphased trio data as a reference panel. We performed imputation in a sample of 1088 individuals with unphased HapMap CEU trio data as a reference panel and compared the imputation accuracy to results obtained with the corresponding phased HapMap data. As expected, imputation using a trio reference panel was slightly more accurate than imputation using a phased reference panel. The difference in imputation accuracy was small but statistically significant (Wilcoxon test p < 10−7). The allele-frequency correlation was 0.9916 with phased parental data and 0.9918 with trio data.
Model Averaging
One way of obtaining an additional small increase in imputation accuracy is to perform imputation multiple times and average the resulting posterior probabilities. We used a reference panel of 30 parent-offspring trios and a sample of 188 individuals. We imputed data four times and used a different seed for generating random numbers in each run. The allele-frequency correlation for the markers on the Illumina chip was 0.9904 for the first run, 0.9909 for the average posterior probabilities from the first two runs, and 0.9911 for the average posterior probabilities for all four runs. The difference in imputation accuracy was statistically significant when comparing results from different numbers of runs (Wilcoxon test p < 10−15).
Dividing the Sample
We investigated the imputation accuracy and computational efficiency when dividing a sample into subsets and imputing data in each set separately. Imputation was performed on the entire sample of 1088 individuals and also on four equal-sized subsamples of 272 individuals. For a reference panel of 60 phased individuals and a sample of 1088 individuals, the allele-frequency correlation was 0.9916 for the entire sample and 0.9923 for the subdivided sample. For a reference panel of 300 unphased individuals, the allele-frequency correlation was 0.9987 for the entire sample and 0.9988 for the subdivided sample. The increase in allele-frequency correlation with the subdivided sample is probably due to the benefits of model averaging, given that the allele-frequency estimates for each subsample are obtained from a different random model. Total computational time for imputing genotypes on the four subsamples was less than the computational time for imputing genotypes on the entire sample. Dividing a sample into subsets and imputing data in each subset separately can decrease total computing time because computing time for our methods scales more than linearly in the size of the combined reference panel and sample. Dividing a sample into subsets also permits imputation in each subset to run in parallel to further reduce the effective computing time.
Trio Phasing
Table 1 shows error rates for phasing trios. Error rates decrease with increasing sample size and with increasing SNP density. There is no clear pattern of difference between CEU and YRI data—for some combinations of marker density and sample size, CEU has lower error rates, whereas for others, YRI has lower error rates. The real data (HapMap Phase 2) has an approximately five times higher error rate than the corresponding simulated data (30 trios at a density of 1 SNP per kb). A possible explanation for this is that for the simulated data, the true genotypes and phase with which imputed genotypes and phase are compared are known without error, whereas for the real HapMap data, there are two significant sources of error. First, there are probably some genotype errors in the HapMap data, so that the imputed genotype and phase may be correct but look incorrect. Second, we do not know the true genotype and phase, but we are comparing our results to those obtained by PHASE (i.e., the HapMap phased data). Thus, whenever our imputation differs from that of PHASE, we record it as an error; however, we have no way to know whether the error is from our method or from PHASE.
Table 1.
Error Rates for Phasing Trios
| Data Source | Number of Trios | SNPs/kb | Ethnicity | Transmission Error Rate | Missing Trio Error Rate | Sporadic Missing Error Rate | Errors per Trio per SNP |
|---|---|---|---|---|---|---|---|
| Simulated with Cosi | 3000 | 6 | CEU | 0.0047 | 0.0080 | 0.0042 | 0.00083 |
| Simulated with Cosi | 3000 | 6 | YRI | 0.0017 | 0.0058 | 0.0031 | 0.00035 |
| Simulated with Cosi | 300 | 6 | CEU | 0.0095 | 0.0130 | 0.0069 | 0.00154 |
| Simulated with Cosi | 300 | 6 | YRI | 0.0116 | 0.0198 | 0.0108 | 0.00179 |
| Simulated with Cosi | 30 | 6 | CEU | 0.0224 | 0.0237 | 0.0125 | 0.00341 |
| Simulated with Cosi | 30 | 6 | YRI | 0.0321 | 0.0420 | 0.0231 | 0.00447 |
| Simulated with Cosi | 3000 | 1 | CEU | 0.0006 | 0.0009 | 0.0005 | 0.00010 |
| Simulated with Cosi | 3000 | 1 | YRI | 0.0003 | 0.0009 | 0.0005 | 0.00006 |
| Simulated with Cosi | 300 | 1 | CEU | 0.0018 | 0.0029 | 0.0015 | 0.00030 |
| Simulated with Cosi | 300 | 1 | YRI | 0.0012 | 0.0028 | 0.0014 | 0.00020 |
| Simulated with Cosi | 30 | 1 | CEU | 0.0061 | 0.0095 | 0.0050 | 0.00102 |
| Simulated with Cosi | 30 | 1 | YRI | 0.0045 | 0.0098 | 0.0051 | 0.00074 |
| HapMap phase II | 30 | ∼1 | CEU | 0.0388 | 0.0351 | 0.0143 | 0.00456 |
| HapMap phase II | 30 | ∼1 | YRI | 0.0188 | 0.0465 | 0.0185 | 0.00357 |
Overall, the error rates in imputed genotypes and phase in trios are extremely low. The error rate per trio per SNP in Table 1 ranges from 0.4% to 0.006%. The transmission error rate (incorrect determination of transmitted allele from a heterozygous parent, where the other parent and the child are heterozygous or missing) in Table 1 ranges from 4% to 0.03%. Thus, although we have not directly compared our trio-phasing results to those from the most accurate competing methods (which was not possible because of the high computing requirements or inability to analyze large data sets of existing software implementing those methods), the error rates are so low that any such comparison would have little practical value.
We attempted to use PHASE v2.1.1 to phase one of our smaller simulated data sets (300 trios with 167 SNPs in simulated YRI). In order to do, we first had to split the data into two components of 83 and 84 markers. The total time for the analysis was 56 hr. In comparison, BEAGLE analyzed these data (without splitting into two components) in 14 s. Our software took a total of 5.5 hr to phase the 3.8 million autosomal markers for the 30 HapMap Phase II CEU trios and 6.3 hr for the 3.7 million autosomal markers for the 30 YRI trios. Phasing times for 3000 simulated trios on 1000 markers (1 SNP per kb) were highly variable, depending on the extent of linkage disequilibrium and missing data patterns, and had a mean time of 122 min.
Discussion
New Methods
The new methods presented here for genotype imputation and haplotype phasing provide a unified approach to the problem of missing data and haplotype-phase inference. Our methods permit family data (parent-offspring pairs or trios) to be analyzed simultaneously with phase-unknown and phase-known genotype data from unrelated individuals, with missing genotypes being automatically imputed during haplotype phasing. We show that our methods scale easily to permit analyses of thousands of individuals. This flexibility and capability is expected to be particularly valuable as new, larger reference panels become available (e.g., HapMap phase 3 data). We have demonstrated that our imputation and haplotype-phasing methods achieve a high level of accuracy and that the posterior probabilities produced by our methods are well calibrated.
We also presented a new method for estimating allelic R2, the correlation between the imputed and true allele dosage for a marker. We showed empirically and theoretically that allelic R2 can be accurately estimated when the imputed posterior probabilities are accurately calibrated (as they are for our method). Allelic R2 is a natural metric for estimating imputation accuracy that is normalized for marker-allele frequency. The estimated allelic R2 can be used for estimating the loss in statistical power when using imputed data in place of genotype data for a marker. The allelic R2 metric can also be used for detecting intercohort differences in imputation accuracy that could bias statistical tests for association in a manner similar to “differential missingness.”26
Importance of Large Reference Panels
One important conclusion from this study is that the size of the reference panel has a substantial impact on imputation accuracy, particularly when imputing low-frequency genetic variants. We have demonstrated with WTCCC data that the use of large reference panels produces substantial gains in imputation accuracy and that improved imputation accuracy results in lower p values when testing low-frequency disease-associated variants.
With our methods, it is relatively unimportant whether the reference panel is phased or unphased because the phase of genotype data for unrelated individuals can be inferred during genotype imputation with good accuracy. We have shown that a reference panel of 100 unphased individuals gives markedly more accurate imputed genotypes than a reference panel of 60 phased individuals. This is not surprising because unphased genotype data contain almost as much information as phased genotype data. This is why samples of unrelated individuals with unphased genotype data can be phased with fairly high accuracy.
The value of a large reference panel is most evident when imputing low-frequency genetic variants. We have shown that variants with frequency as low as 1% are accurately imputed (with high allelic R2) when using a large reference panel. We expect that large reference panels can be used for accurately imputing markers with frequency <1% provided that the reference panel and sample genotype data are sufficiently accurate.
The results from this study are consistent with previous work showing that the BEAGLE haplotype HMM gives good results for small sample sizes and excellent results for large sample sizes.13 In our earlier work applying the BEAGLE model to haplotype-phase inference in unrelated individuals, there was no reference panel as such, and this result applied to the whole sample. Here, in the case of imputation, the critical quantity is the size of the reference panel.
We have compared our imputation method with IMPUTE, one of the best-performing and widely used imputation methods. We have shown that IMPUTE is slightly more accurate than BEAGLE for small reference panels, but much bigger gains in imputation accuracy are obtained by using larger reference panels. We also show that BEAGLE scales easily to the larger reference panel sizes, whereas IMPUTE does not. One could modify IMPUTE to reduce its computational time by constraining the complexity of its HMM (e.g., by limiting the number of HMM states). However, constraining the model complexity would be expected to reduce imputation accuracy because more complex models are needed to use the full information in larger reference panels. Other excellent, state-of-the-art methods that use HMMs similar to those used by IMPUTE face similar challenges with large reference panels (Li et al., 2007, Am. Soc. Hum. Genet., abstract 2071).1,27 In contrast, BEAGLE can model large-scale data sets with 15,000 or more individuals without constraining the complexity of its haplotype frequency model.6 This enables BEAGLE to achieve increased imputation accuracy by making full use of the data in large reference panels.
New Analysis Options
Our methods provide researchers with additional options for imputing genotypes. In the current study, we have used reference panels genotyped on the Affymetrix 500K and Illumina 550K chips. However, much denser genotyping chips are now available. The Affymetrix Genome-wide Human SNP Array 6.0 has 900K SNPs, and the Illumina Human 1M Beadchip has over 1M SNPs. Our work indicates that the accuracy of genotype imputation in the British population could be improved by genotyping the 1958 British Birth cohort on the densest genotype chips available and using this cohort as an unphased reference panel.
When a reference panel for a population is not available, one can still choose a subset of the sample to genotype with a larger set of markers (e.g., the Affymetrix 6.0 chip or the Illumina 1M chip) and use the densely genotyped subset to impute the SNPs for the remainder of the sample.28 An additional advantage of this approach is that the reference panel is perfectly matched to the sample.
One of the most valuable uses of genotype imputation has been combining data from multiple studies that have used different genotyping platforms, thus increasing power to detect associations.3,5 For European cohorts, our results indicate that use of a large reference panel, such as the 1958 British Birth Cohort, that has been genotyped on both Affymetrix and Illumina genotype platforms will substantially increase power compared to use of smaller reference panels, such as the HapMap phase 2 CEU panel.
With our methods, one can also use trio data directly for imputation. Using trios as a reference panel permits any phase uncertainty in the trio data to be accounted for when imputing genotypes. Our trio-phasing methods also make it easy to impute variants that are not included in the phased HapMap. For example, current genotype arrays contain SNPs that are not present in the phased HapMap CEU and YRI data. Because HapMap panels are typically genotyped with these commercial arrays, the resulting genotypes can be added to HapMap data and used as a trio reference panel. Also, data for HapMap phase 3 samples have been genotyped on the Affymetrix 6.0 and Illumina 1M platforms. These data are publicly available from the HapMap web site, and population cohorts from these data can be used as reference panels in BEAGLE for genotype imputation.
Software Implementation
Our imputation and haplotype-inference methods are implemented in version 3.0 of the BEAGLE software package, which is freely available. BEAGLE 3.0 enables users to combine multiple data sets in a single analysis to increase sample size and accuracy. In particular, users can simultaneously analyze phased and unphased data for unrelated individuals and parent-offspring pairs and trios. BEAGLE is written in Java and runs on all major computing platforms.
Appendix 1: Estimating Allelic R2
We have used the squared correlation between the imputed most likely allele dosage and the true allele dosage for a marker (allelic R2) to measure the accuracy of genotype imputation for the marker. This squared correlation is an attractive measure because it has a simple interpretation in terms of sample size and power24 and because its interpretation does not depend on the marker-allele frequency. In this appendix, we show that the correlation between the imputed and true allele dosage can be estimated from the posterior genotype probabilities when the true genotypes are not observed. The results in this study show that the estimate of allelic R2 has good accuracy when the posterior genotype probabilities are accurately calibrated and informative.
We use the following random variables: X = the unobserved true genotype, Y = the imputed posterior genotype probabilities, and Z = the genotype with highest posterior probability (based on Y).
The values of the random variables X and Z can take values of 0, 1, or 2, corresponding to the number of copies (dosage) of the minor allele in the genotype. The random variable Y is a vector-valued random variable whose values are ordered triplets (a0, a1, a2) where ak is the posterior genotype probability of genotype k (k = 0, 1, or 2). Assume there are n individuals in the sample. Let yi be the ordered triplet of posterior genotype probabilities in the _i_-th sample, let yi(k) denote the posterior probability of genotype k in the _i_-th sample, and let zi be the most likely imputed genotype in the _i_-th sample. We assume that the posterior probabilities are accurately calibrated, so that the probability P(X = k | Y = yi) = yi(k).
The squared correlation (_R_2) between the unobserved true allele dosage and the imputed allele dosage is equal to
| R2=Cov(X,Z)2/(Var(X)Var(Z)) | (1) |
|---|
where Cov(X, Z) is the covariance of X and Z, and Var(X) and Var(Z) are the variances of X and Z, respectively. We can estimate _R_2 by expressing Cov(X, Z), Var(X), and Var(Z) in terms of the imputed data zi and yi.
We estimate the variance of Z and X by using the sample mean:
≈(1/n)Σizi2−(1/n2)(Σizi)2
≈(1/n)ΣiE[X2|yi]−(1/n2)(ΣiE[X|yi])2
Similarly, we use the sample mean to estimate covariance of X and Z as
=E[E[XZ|Y]]−E[E[X|Y]]E[Z]
≈(1/n)Σi(ziE[X|yi])−(1/n2)(ΣiE[X|yi])Σizi
An estimate for allelic R2 is obtained by substituting the values of E[X | _yi_] and E[X2 | _yi_] into the estimates for Cov(X, Z) and Var(X) and using Equation 1. Let ui = E[X | yi ] = yi(1) + 2yi(2) and wi = E[X2 | yi ] = yi(1) + 4yi(2); then
R2≈[Σiziui−(1/n)(ΣiuiΣizi)]2/([Σiwi−(1/n)(Σiui)2][Σizi2−(1/n)(Σizi)2])
Appendix 2: Haplotype Hidden Markov Models
Using Rabiner's notation,16 the five components of a HMM are as follows: (1) hidden states: S1, S2, … SN; (2) observed values: v1, v2, …, vM; (3) state-transition probabilities: aij is the probability of a state transition from state Si to state Sj; (4) emission probabilities: bj(vk) is the probability of observing value vk in state Sj; and (5) initial-state probabilities: πi is the probability that the HMM process starts in state Si.
We assume that there are D markers ordered in chromosomal order. For simplicity, we assume that all markers are diallelic, but the model generalizes to the multiallelic case. Our methods are applicable to any HMM that meets the following two conditions. First, the HMM is leveled with D levels (one level per marker). In a leveled HMM, each state belongs to a single level, the first level consisting of states with nonzero initial probabilities, and all state transitions with nonzero probability are from states at level l to states at level l + 1. Second, the set of observed values consists of all alleles for all markers, and the only values emitted with nonzero probability by states at level l are alleles for the _l_-th marker.
We will call a HMM that satisfies the preceding condition a haplotype HMM. The class of haplotype HMMs is very broad and includes the models used by many state-of-the-art programs for inferring haplotype phase and missing data (Li et al., 2007, Am. Soc. Hum. Genet., abstract 2071).7,13,27 Haplotypes, with or without missing alleles, can be considered as sequences of emitted values from the haplotype HMM. We assume that the observed data is consistent with the haplotype HMM, so that standard HMM methods can be used for determining the probability of each sequence of hidden states that is consistent with the observed data. In particular, we can sample a sequence of states from the haplotype HMM, and we can determine a probability distribution for the missing data conditional on the observed allele data with standard HMM methods.13,16
A haplotype HMM, H, determines HMMs for genotype data from unrelated individuals, parent-offspring pairs, and parent-offspring trios. For unrelated individuals, phased genotype data is a pair of haplotypes. Thus, for an individual, we use a HMM denoted H2, whose states are ordered pairs of states from each level of H. For a parent and offspring where one parent is ungenotyped, we use a HMM H3, whose states are ordered triplets of states from each level of H. The ordered triplets represent the genotyped parent's transmitted allele, the genotyped parent's untransmitted allele, and the child's allele received from the ungenotyped parent. For parent-offspring trio data, we use a HMM H4 whose states are ordered quartets of states from each level of H. The ordered quartet represents the first parent's transmitted and untransmitted alleles and the second parent's transmitted and untransmitted alleles.
The formal definition of the HMM, Hk for k = 1, 2, 3, …, is as follows. Let Ll be the set of states in H at level l. The states of the HMM Hk are the union over l of all ordered _k_-tuples of states in Ll. The transition probability between two states of Hk is equal to the product of the element transition probabilities in H. For example, the transition probability from state (S1, S2, S3) to state (S4, S5, S6) in H3 is equal to a13a24a36. The initial probability of a state s in Hk is the product of the initial probabilities of the elements of s. For example, the initial probability of state (S1, S2, S3) is π1π2π3.
The observed values in Hk are fk(v∗) where v∗ is an ordered _k_-tuple of emitted values of H, and fk are functions, described below, that transform ordered _k_-tuples of values of H into observed genotype data. The functions fk are not one to one because genotypes are unordered pairs and _k_-tuples are ordered. So calculations of emission probabilities must sum over the inverse image fk−1(fk(v∗)) consisting of all _k_-tuples of values in H that are mapped to fk(v∗). For each element of the inverse image, the probability of observing the corresponding emission probability is the product of the component emission probabilities in H. For example, if f3−1(f3(v1, v2, v3)) contains two elements, (v1, v2, v3) and (v4, v5, v6), the probability of observing f3(v1, v2, v3) in state (S7, S8, S9) is b7(v1)b8(v2)b9(v3) + b7(v4)b8(v5)b9(v6). With these definitions, Hk is a leveled HMM.
Given a haplotype HMM H, we use H2, H3, H4 to infer phase and missing data in diploid individuals, parent-offspring pairs, and parent-offspring trios, respectively. The functions fk transform ordered _k_-tuples of values of H into genotypes. For individuals, f2 maps the ordered pair of values (v1, v2) to the corresponding unordered genotype. For parent-offspring data, f3 maps the ordered triplet of values (v1, v2, v3) to parent genotype f2(v1, v2) and to child genotype f2(v1, v3). For parent-offspring trio data, f4 maps the ordered quartet of values (v1, v2, v3, v4) to first-parent genotype f2(v1, v2), to second parent genotype f2(v3, v4), and to child genotype f2(v1, v3).
Given a haplotype HMM and diploid data for a set of individuals, parent-offspring pairs, or parent-offspring trios, with or without missing data, one can use standard HMM methods to sample a sequence of hidden states (ordered _k_-tuples) conditional on the observed data or to determine a probability distribution for missing data. Sampled hidden states can be used for determining a haplotype phasing consistent with the observed genotype data.
Appendix 3: The BEAGLE Haplotype HMM
Appendix 2 details the general haplotype HMM framework. Here, we describe the particular haplotype HMM that we use in our method. The model is most easily described by detailing the procedure from which it is built with haplotype data.
The model-building process proceeds along a chromosome from marker to marker. Each step involves “merging” and “splitting” of haplotype clusters, which are the states of the HMM. At the first level (corresponding to the first marker) of the haplotype HMM, the haplotypes are clustered according to the allele at the first marker. Thus for a SNP marker, there will be two clusters (i.e., two states), one containing all haplotypes for which the first allele is the major allele, and the other containing all haplotypes for which the first allele is the minor allele. In creating level l+1 from level l, a merging and a splitting step are applied. The merging step involves calculating a merging score (described below) for each pair of haplotype clusters. If the smallest score is less than the threshold (given below), the corresponding pair of haplotype clusters will be merged into a single cluster, and the merging step is repeated with the new set of haplotype clusters. Once all merging has been completed, each haplotype cluster is split by the alleles at marker l+1. Again, for a SNP marker, all haplotypes in a cluster carrying the major allele at marker l+1 will form one new cluster, whereas all haplotypes in the cluster carrying the minor allele at marker l+1 will form another cluster. The new clusters obtained at the end of the splitting procedure are the states of the haplotype HMM at level l+1. Figure 5A illustrates the process.
Figure 5.
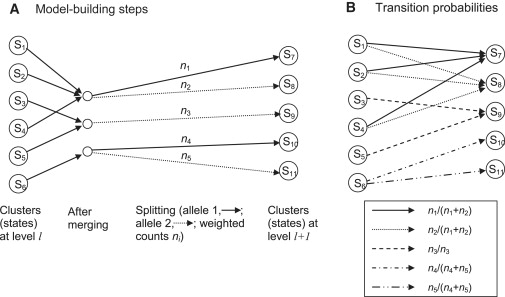
Building the BEAGLE HMM
(A) Building level l+1 from level l. The first step is merging. In this example, states S1, S2, and S4 are merged, and states S3 and S5 are merged. After merging, haplotype clusters are split on the basis of the allele at marker l+1. All haplotypes in states S7 and S10 have allele 1 at this marker, whereas all haplotypes in states S8, S9, and S11 have allele 2.
(B) Transition probabilities between the states at the two levels. All transitions with nonzero probabilities are shown. Transitions with the same probability have the same pattern on the arrow shaft.
The merging score for two clusters at level l is obtained as follows. In merging two clusters, we ask whether their probabilities of allele sequences at markers l+1, l+2, … differ. The score is the maximum over k (k = 1, 2,…) and over all possible sequences of alleles at markers l+1, l+2, …, l+k of the observed frequency difference of this sequence between the two clusters. The observed frequency accounts for any weighting of individuals. For example, if cluster one contains five fully weighted individuals, of whom three have the sequence ACG at markers l+1, l+2, l+3, plus three individuals weighted at 0.1, of whom one has this sequence, the observed frequency for this sequence in this cluster is 3.1/5.3. A worked example for the case in which all individuals have unit weight is given in our earlier work.29 The threshold on the scores is sqrt(1/nx + 1/ny), where nx and ny are the sum of the weights of each cluster (e.g., 5.3 for the cluster described above). A rationale for this threshold is given in our earlier work.29
All haplotypes within a cluster at level l have the same allele at marker l because of the splitting process (see Figure 5A). Thus, the emission probabilities are all 0/1. The transition probabilities can be obtained from the cluster counts. The transition probability from state SA at level l to state SB at level l+1 is the number of haplotypes in SB divided by the sum of haplotype counts from all parent states of SB. Because state SB is derived by merging and then splitting states at the previous level, the parent states of SB are all the states at level l that contribute to the merged cluster from which state SB was derived (by splitting). For, example, in Figure 5B, state S7 at level l+1 has _n_1 haplotypes, and states S1, S2, and S4, the parent states, have _n_1 + _n_2 haplotypes among them. Thus, the transition probability from S1 to S7 is _n_1/(_n_1 + _n_2) (which is also the transition probability from S2 to S7 or from S4 to S7). As before, the haplotype counts are weighted counts if some individuals are down-weighted.
Web Resources
The URLs for data presented herein are as follows:
- BEAGLE Genetic Analysis Package, version 3.0, http://www.stat.auckland.ac.nz/∼browning/beagle/beagle.html
- HapMap, http://www.hapmap.org
- 1000 Genomes Project, http://www.1000genomes.org
- Welcome Trust Case Control Consortium, http://www.wtccc.org.uk
- Wellcome Trust Sanger Institute Illumina 550K genotype data for the 1958 Birth Cohort, https://www.sanger.ac.uk/PostGenomics/genotyping/access_to_data.shtml
Acknowledgments
This study makes use of data generated by the Wellcome Trust Case Control Consortium. A full list of the investigators who contributed to the generation of the data is available from the Wellcome Trust Case Control Consortium (see Web Resources). Funding for the Wellcome Trust Case Control Consortium project was provided by the Wellcome Trust under award 076113. We gratefully acknowledge the use of Illumina 550K genotype data for individuals in the British 1958 Birth Cohort generated by the Wellcome Trust Sanger Institute. We thank Benjamin Neale and the GAIN Imputation Workgroup for suggesting the allele-frequency correlation metric for measuring imputation accuracy. This work was supported by National Institutes of Health grant 3R01GM075091-02S1.
References
- 1.Browning S.R. Missing data imputation and haplotype phase inference for genome-wide association studies. Hum. Genet. 2009;124:439–450. doi: 10.1007/s00439-008-0568-7. [DOI] [PMC free article] [PubMed] [Google Scholar]
- 2.Lettre G., Jackson A.U., Gieger C., Schumacher F.R., Berndt S.I., Sanna S., Eyheramendy S., Voight B.F., Butler J.L., Guiducci C. Identification of ten loci associated with height highlights new biological pathways in human growth. Nat. Genet. 2008;40:584–591. doi: 10.1038/ng.125. [DOI] [PMC free article] [PubMed] [Google Scholar]
- 3.Barrett J.C., Hansoul S., Nicolae D.L., Cho J.H., Duerr R.H., Rioux J.D., Brant S.R., Silverberg M.S., Taylor K.D., Barmada M.M. Genome-wide association defines more than 30 distinct susceptibility loci for Crohn's disease. Nat. Genet. 2008;40:955–962. doi: 10.1038/NG.175. [DOI] [PMC free article] [PubMed] [Google Scholar]
- 4.Willer C.J., Sanna S., Jackson A.U., Scuteri A., Bonnycastle L.L., Clarke R., Heath S.C., Timpson N.J., Najjar S.S., Stringham H.M. Newly identified loci that influence lipid concentrations and risk of coronary artery disease. Nat. Genet. 2008;40:161–169. doi: 10.1038/ng.76. [DOI] [PMC free article] [PubMed] [Google Scholar]
- 5.Zeggini E., Scott L.J., Saxena R., Voight B.F., Marchini J.L., Hu T., de Bakker P.I., Abecasis G.R., Almgren P., Andersen G. Meta-analysis of genome-wide association data and large-scale replication identifies additional susceptibility loci for type 2 diabetes. Nat. Genet. 2008;40:638–645. doi: 10.1038/ng.120. [DOI] [PMC free article] [PubMed] [Google Scholar]
- 6.Browning B.L., Browning S.R. Haplotypic analysis of Wellcome Trust Case Control Consortium data. Hum. Genet. 2008;123:273–280. doi: 10.1007/s00439-008-0472-1. [DOI] [PMC free article] [PubMed] [Google Scholar]
- 7.Marchini J., Howie B., Myers S., McVean G., Donnelly P. A new multipoint method for genome-wide association studies by imputation of genotypes. Nat. Genet. 2007;39:906–913. doi: 10.1038/ng2088. [DOI] [PubMed] [Google Scholar]
- 8.Servin B., Stephens M. Imputation-based analysis of association studies: Candidate regions and quantitative traits. PLoS Genet. 2007;3:e114. doi: 10.1371/journal.pgen.0030114. [DOI] [PMC free article] [PubMed] [Google Scholar]
- 9.Zaitlen N., Kang H.M., Eskin E., Halperin E. Leveraging the HapMap correlation structure in association studies. Am. J. Hum. Genet. 2007;80:683–691. doi: 10.1086/513109. [DOI] [PMC free article] [PubMed] [Google Scholar]
- 10.Nicolae D.L. Testing untyped alleles (TUNA)-applications to genome-wide association studies. Genet. Epidemiol. 2006;30:718–727. doi: 10.1002/gepi.20182. [DOI] [PubMed] [Google Scholar]
- 11.Lin D.Y., Hu Y., Huang B.E. Simple and efficient analysis of disease association with missing genotype data. Am. J. Hum. Genet. 2008;82:444–452. doi: 10.1016/j.ajhg.2007.11.004. [DOI] [PMC free article] [PubMed] [Google Scholar]
- 12.Pe'er I., de Bakker P.I., Maller J., Yelensky R., Altshuler D., Daly M.J. Evaluating and improving power in whole-genome association studies using fixed marker sets. Nat. Genet. 2006;38:663–667. doi: 10.1038/ng1816. [DOI] [PubMed] [Google Scholar]
- 13.Browning S.R., Browning B.L. Rapid and accurate haplotype phasing and missing-data inference for whole-genome association studies by use of localized haplotype clustering. Am. J. Hum. Genet. 2007;81:1084–1097. doi: 10.1086/521987. [DOI] [PMC free article] [PubMed] [Google Scholar]
- 14.Frazer K.A., Ballinger D.G., Cox D.R., Stuve L.L., Gibbs R.A., Belmont J.W., Boudreau A., Hardenbol P., International HapMap Consortium A second generation human haplotype map of over 3.1 million SNPs. Nature. 2007;449:851–861. doi: 10.1038/nature06258. [DOI] [PMC free article] [PubMed] [Google Scholar]
- 15.Marchini J., Cutler D., Patterson N., Stephens M., Eskin E., Halperin E., Lin S., Qin Z.S., Munro H.M., Abecasis G.R. A comparison of phasing algorithms for trios and unrelated individuals. Am. J. Hum. Genet. 2006;78:437–450. doi: 10.1086/500808. [DOI] [PMC free article] [PubMed] [Google Scholar]
- 16.Rabiner L.R. A tutorial on hidden Markov models and selected applications in speech recognition. Proc. IEEE Inst. Electr. Electon. Eng. 1989;77:257–286. [Google Scholar]
- 17.Grice J.A., Hughey R., Speck D. Reduced space sequence alignment. Comput. Appl. Biosci. 1997;13:45–53. doi: 10.1093/bioinformatics/13.1.45. [DOI] [PubMed] [Google Scholar]
- 18.Wheeler R., Hughey R. Optimizing reduced-space sequence analysis. Bioinformatics. 2000;16:1082–1090. doi: 10.1093/bioinformatics/16.12.1082. [DOI] [PubMed] [Google Scholar]
- 19.Stephens M., Smith N.J., Donnelly P. A new statistical method for haplotype reconstruction from population data. Am. J. Hum. Genet. 2001;68:978–989. doi: 10.1086/319501. [DOI] [PMC free article] [PubMed] [Google Scholar]
- 20.Wellcome Trust Case Control Consortium Genome-wide association study of 14,000 cases of seven common diseases and 3,000 shared controls. Nature. 2007;447:661–678. doi: 10.1038/nature05911. [DOI] [PMC free article] [PubMed] [Google Scholar]
- 21.Power C., Elliott J. Cohort profile: 1958 British birth cohort (National Child Development Study) Int. J. Epidemiol. 2006;35:34–41. doi: 10.1093/ije/dyi183. [DOI] [PubMed] [Google Scholar]
- 22.Schaffner S.F., Foo C., Gabriel S., Reich D., Daly M.J., Altshuler D. Calibrating a coalescent simulation of human genome sequence variation. Genome Res. 2005;15:1576–1583. doi: 10.1101/gr.3709305. [DOI] [PMC free article] [PubMed] [Google Scholar]
- 23.Kong A., Gudbjartsson D.F., Sainz J., Jonsdottir G.M., Gudjonsson S.A., Richardsson B., Sigurdardottir S., Barnard J., Hallbeck B., Masson G. A high-resolution recombination map of the human genome. Nat. Genet. 2002;31:241–247. doi: 10.1038/ng917. [DOI] [PubMed] [Google Scholar]
- 24.Pritchard J.K., Przeworski M. Linkage disequilibrium in humans: Models and data. Am. J. Hum. Genet. 2001;69:1–14. doi: 10.1086/321275. [DOI] [PMC free article] [PubMed] [Google Scholar]
- 25.de Bakker P.I., Ferreira M.A., Jia X., Neale B.M., Raychaudhuri S., Voight B.F. Practical aspects of imputation-driven meta-analysis of genome-wide association studies. Hum. Mol. Genet. 2008;17:R122–R128. doi: 10.1093/hmg/ddn288. [DOI] [PMC free article] [PubMed] [Google Scholar]
- 26.Clayton D.G., Walker N.M., Smyth D.J., Pask R., Cooper J.D., Maier L.M., Smink L.J., Lam A.C., Ovington N.R., Stevens H.E. Population structure, differential bias and genomic control in a large-scale, case-control association study. Nat. Genet. 2005;37:1243–1246. doi: 10.1038/ng1653. [DOI] [PubMed] [Google Scholar]
- 27.Scheet P., Stephens M. A fast and flexible statistical model for large-scale population genotype data: Applications to inferring missing genotypes and haplotypic phase. Am. J. Hum. Genet. 2006;78:629–644. doi: 10.1086/502802. [DOI] [PMC free article] [PubMed] [Google Scholar]
- 28.Anderson C.A., Pettersson F.H., Barrett J.C., Zhuang J.J., Ragoussis J., Cardon L.R., Morris A.P. Evaluating the effects of imputation on the power, coverage, and cost efficiency of genome-wide SNP platforms. Am. J. Hum. Genet. 2008;83:112–119. doi: 10.1016/j.ajhg.2008.06.008. [DOI] [PMC free article] [PubMed] [Google Scholar]
- 29.Browning S.R. Multilocus association mapping using variable-length Markov chains. Am. J. Hum. Genet. 2006;78:903–913. doi: 10.1086/503876. [DOI] [PMC free article] [PubMed] [Google Scholar]