RNase L down-modulation of the RNA Binding Protein, HuR, and cellular growth (original) (raw)
. Author manuscript; available in PMC: 2011 Apr 6.
Published in final edited form as: Oncogene. 2009 Mar 2;28(15):1782–1791. doi: 10.1038/onc.2009.16
Abstract
Ribonuclease L (RNase L) is an intracellular enzyme that is vital in innate immunity, but also is a tumor suppressor candidate. Here, we show that over-expression of RNase L decreases cellular growth and down-modulates the RNA binding protein, HuR, a regulator of cell cycle progression and tumorigenesis. The effect is temporal, occurring in specific cell cycle phases and correlated with the cytoplasmic localization of RNase L. Both cellular growth and HuR were increased in _RNASE_L-null mouse fibroblast lines when compared to wild type cells. Moreover, the stability of HuR mRNA was enhanced in _RNASEL_-null cells. The HuR 3′UTR, which harbor U-rich and AU-rich elements, was potently responsive to RNase L over-expression when compared to control 3′UTR. Our results may offer a new explanation to the tumor suppressor role of RNase L.
Ribonuclease L (RNase L) is an intracellular endoribonuclease that has been suggested as a tumor suppressor candidate due to linkage with hereditary prostate cancer (HPC1) gene and because of its pro-apoptotic role (1-3). The mechanism of RNase L on cell division is not known. Classically, many tumor suppressors, such as p53, halt cell cycle progression by regulating cell cycle check points governed by cyclins and cyclin-dependent kinases. But there are proteins of different functional classes that affect these activities such as the RNA binding protein, HuR– A member of mammalian homologues of embryonic lethal abnormal vision (ELAV) proteins comprising a group of RNA-binding proteins first described in Drosophila. HuR is implicated in the stabilization of several adenylate uridylate (AU)-rich mRNAs including those that regulate the cell cycle such as cyclin A and B, and p21, and those that affect tumor activities such as urokinase activator (uPA) and cyclooxygenase, COX-2 (4-7). Knockout of HuR by siRNA or antisense vectors decreases cellular growth (8, 9).
RNase L is activated by 2′,5′ oligoadenylates (2-5A) which are synthesized from ATP by the 2′,5′ oligoadenylate synthetase (OAS), an interferon (IFN)-inducible gene product. OAS itself is expressed as a latent protein that is active upon binding to double-stranded RNA. The latter is produced as an intermediate during the viral life cycle (10) or possibly due to cellular RNA with double-stranded structures (11, 12). RNase L has been known for its role in the defense against viruses due to its potent degrading effect on viral mRNAs (3, 13-16). Moreover, it has been shown that prostate cancer subjects with mutations in RNASEL are more susceptible to infection by a novel gammaretrovirus (17).
RNase L, itself, does not cause global degradation of cellular mRNA in intact cells due to the low endogenous levels of 2-5A. Rather, 2-5A at high concentrations leads to degradation of ribosomal RNA, such as those encountered during acute viral replication or when exogenously added to cells (14, 18, 19). Previously, we were able to provide the first evidence that RNase L, in the absence of viral infection, can act on cellular mRNAs (20, 21). Specifically, RNase L downregulates the double-stranded RNA dependent protein kinase (PKR) mRNA and subsequently leads to downregulation of the consequences of this effect, i.e., eIF2α phosphorylation and inhibition of protein synthesis (20). Here, our findings revealed that RNase L downmodulates HuR mRNA and subsequently HuR protein in a manner that is correlated with RNase L-induced suppression of cellular growth and cytoplasmic localization of RNase L.
Results
Moderate over-expression of RNase L and effects on cellular growth
To elucidate the mechanism of the cell growth suppressor action of RNase L, we generated a polyclonal cell line from a HeLa line–with undetectable or very low expression of RNase L – that stably expresses moderate amounts of RNase L. Approximately 2-fold expression in RNase L at the protein level when compared to vector was achieved (Supplementary Fig.1). We chose a short term polyclonal line generation approach in contrast to monoclonal lines to avoid cell selection bias as subtle variations in RNase L can lead to significant changes in mRNA levels.
We used a new continuous real time biosensor that measures cellular growth based on impedance (22, 23), in order to assess the effect of RNase L expression. The RNase L-expressing cell line had reduced growth rates when compared to the control cell line and was more pronounced when cells were approaching confluence (Fig. 1A). At very low cell density, the RNase L-expressing cells failed to grow (Fig. 1B). These results were similar when a colorimetric conventional assay (Alamar Blue) was used (Data not shown). The antiproliferative effect observed was not due to apoptosis as the pro-apoptotic effect of RNase L requires an apoptosis inducer (15, 24, 25) which was not used in this study. Also, flow cytometry analysis that measures DNA content of sub-G1 cells showed there was no difference in the percentage of apoptotic cells; <3% of the total cell pool in both vector and RNase L-expressing cell lines.
Figure 1. RNase L effect on cellular growth and cellular mRNAs.
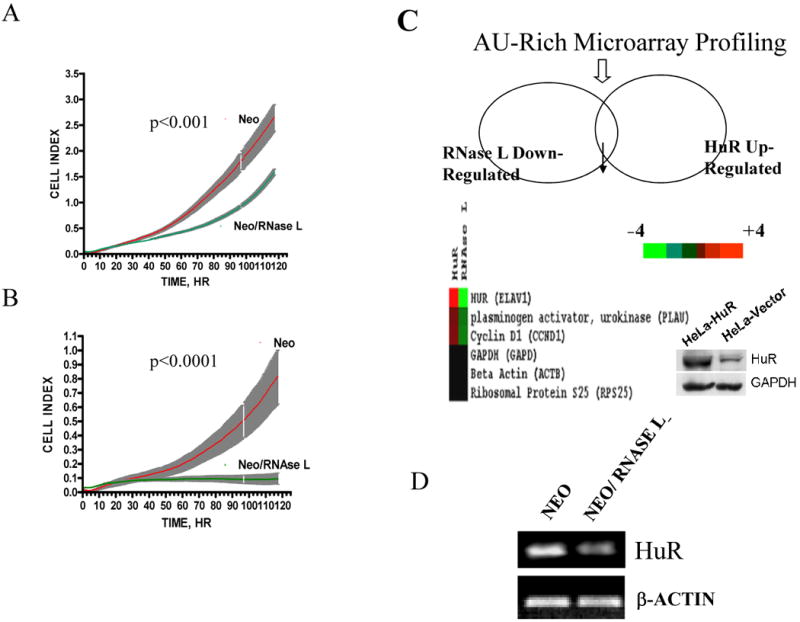
(A, B) Growth curves of RNase L-expressing and empty vector polyclonal cells. RNase L/neomycin or vector/neomycin cells were seeded in two different densities (5000 cells, A or 2500 cells, B) per well in 96-well plates and then monitored for growth by continuous real time RT-CES biosensor each 20 min for a period of five days. Data are from four replicates (shaded grey areas are SEM). Curve fit and doubling time was assessed using the exponential growth equation Y=Start*exp(K*X); Y=Start and increases exponentially with rate constant K; the doubling time equals 0.69/K. Curve comparison (K parameter difference) was used using F test (p values are indicated).
(C) Microarray profiling of AU-rich mRNA expression as a result of RNase L and HuR action. Colored list shows the genes that are related in this study which are significant and statistically reproducible between control and either of RNase L-expressing or HuR-over-expressing (HeLa) lines. The color legend shows gradation of color proportional to the magnitude of induction (red) or repression (green) of expression. Inside image is a representative Western blot for the HuR over-expressing cell line.
(D) Total RNA was extracted from confluent cells and used for RT-PCR at semi-quantitative conditions as described in Materials and Methods, with primers specific to HuR and β-actin mRNA.
Cellular mRNA changes due to RNase L
In order to find which gene products affect cellular growth and are modulated by RNase L, we used custom-made microarrays (26, 27) that contain probes for U-rich mRNAs– RNase L is known to cleave at U-rich dinucleotides (28). Comparing gene expression patterns from cells expressing RNase L with control vector, revealed that the mRNA levels of the RNA binding protein, HuR, were reduced in RNase L expressing cells (Fig. 1C). In addition, two known mRNA targets for HuR, urokinase plasminogen activator (uPA) and cyclin D1 (4, 29), were reduced in RNase L expressing cells. As a control, HeLa cells over-expressing HuR (Fig. 1C, insert blot) have increased uPA and cyclin D1 mRNA levels in the same cell type (Fig. 1C). Since the microarray data were for screening purposes, we further focused on HuR rather than gene expression patterns of the individual genes in the array data. Semi-quantitative RT-PCR experiments confirmed that RNase L led to reduction in HuR mRNA levels (Fig.1D). To confirm the findings that RNase L led to HuR downregulation, we measured levels of HuR protein by Western blotting. Levels of HuR protein were reduced (∼2-fold reduction, p<0.01) in RNase L-expressing cells when compared to control cells (Fig. 2A).
Figure 2. Effect of RNase L over-expression and knockout on HuR and cellular growth.
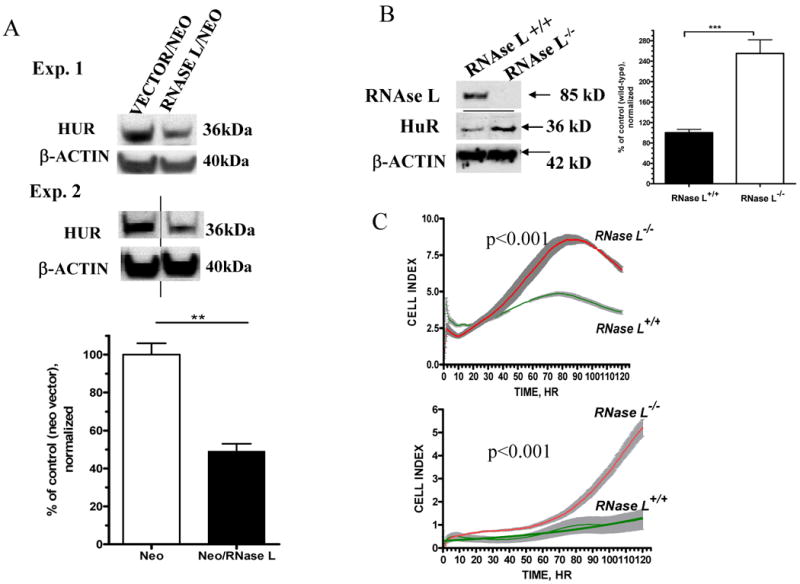
(A) Equal amount of proteins extracted from confluent cells that stably express neomycin vector or RNase L/neomycin were analyzed by Western Blotting using anti-HuR and anti-β-actin. Data shown are two representative experiments of three. Lower panel showed quantitation of β-actin normalized signals (Mean ±SEM) of HuR from three independent experiments. ** denotes p<0.01 using student t-test statistic.
(B) Equal amount of proteins extracted from confluent MEFs generated from wild type or _RNASEL_-knockout mice were used for Western blotting (anti-mouse RNase L, anti-HuR and anti-β-actin). Right panel showed quantitation of β-actin normalized signals (Mean ± SEM) of HuR from three independent experiments. *** denotes p<0.001 using student t-test statistics.
(D) Growth curve of _RNASEL_-knockout and wild type MEFs. Cells were seeded in a 96-well plate with 5000 cells (upper panel) or 2500 cells per well (lower panel). Cellular growth monitoring and statistics were performed as described in (Fig. 1A).
Effect of RNase L knockout on HuR protein and cellular growth
Further, we used embryonic fibroblast lines (MEFs) generated from _RNASEL_-knockout and wild type mice (15). Western blotting confirmed the absence of RNase L using anti-mouse RNase L antibody (Fig. 2B). Increased HuR levels (2.5 fold, p<0.001) were evident in the _RNASEL_-knockout MEFs (Fig. 2B).
HuR was upregulated in wild type and _RNASEL_-knockout MEFs both in confluent and sub-confluent MEFs due to continuous absence of RNase L (Supplementary Fig. 2). The _RNASEL_-null MEFs had increased growth rates compared to the wild type cells as examined with two different cell densities (Fig. 2C). Doubling times indicated that RNASEL-null cells divide 2.7-fold faster than wild type cells (p<0.001).
RNase L modulation of HuR mRNA
It was not possible to assess the mRNA half-life in RNase L-expressing cells due to the low levels of HuR; thus, we used the _RNASEL_-knockout MEF lines. Experiments were performed with semi-quantitative PCR; the one-phase exponential decay model using β-actin normalized signals was utilized. The HuR mRNA stability was enhanced in the RNASEL-null fibroblasts. The half-life of HuR mRNA in wild-type fibroblasts was 1.5 hr in contrast to more than 6 hr in _RNASEL_-knockout cells (Fig. 3A and B). Fig. 3A also confirmed that RNase L deficiency led to increased HuR mRNA levels (levels at 0 hr).
Figure 3. Effect of RNase L on HuR mRNA.
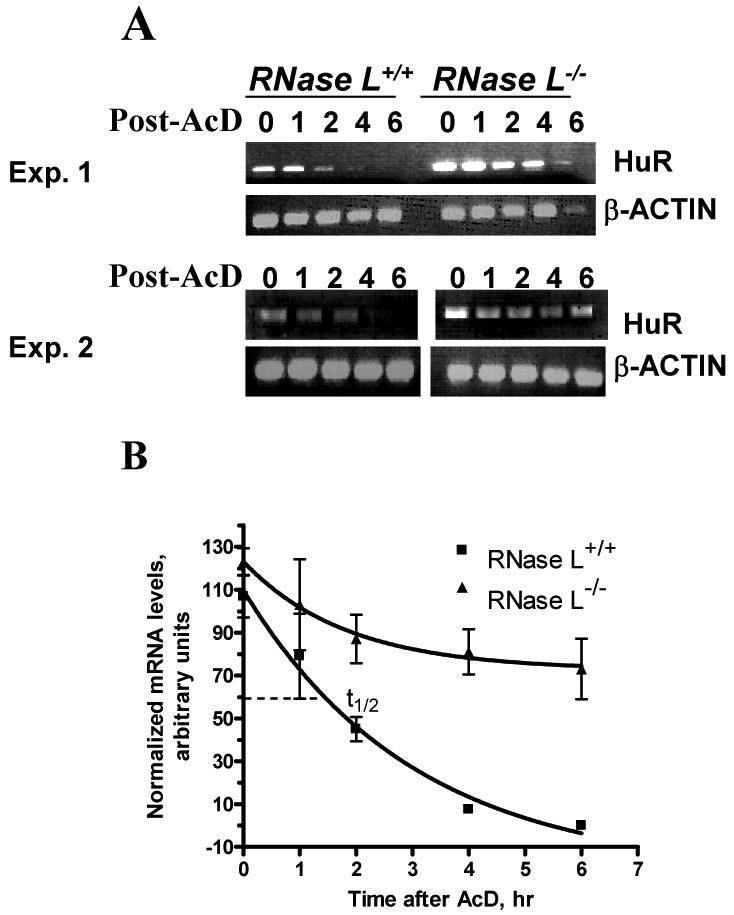
(A) RNase L-/-and RNase L+/+ MEFs were treated with medium control (0 time point) or actinomycin D (5 ug/ml) for various times, as indicated. Semi-quantitative PCRs were performed with primers specific to HuR and β-actin cDNA. PCR, with cycle number that allows at least semi-quantitative comparison, was used as described Materials and Methods. Gels shown are from two independent experiments.
(B) Signal intensities on gels from Fig. 3A were quantified. One-phase exponential decay curves for relative mRNA half-life measurements in the two cell types are shown. Density units (minus background) are plotted as a function of time after the addition of actinomycin D. Detail of the model is given in Materials and Methods.
We have fused two 3′UTR regions that contain U-rich/ARE like sequence and AU-rich elements (Fig. 4A) to EGFP coding region as a reporter expression system (Fig. 4B). This system when coupled with advanced processing algorithm in our hands, is sensitive, has minimal (<6%) variation in transfection efficiency, has a large dynamic linear range (30), and can be performed on live cells. The ARE-containing HuR 3′UTR itself caused reduction (3-fold, p<0.001; student's t test) of reporter activity when compared to the control 3′UTR ((Compare Construct 3, Vector with. Construct 1, Vector); Fig. 4C). Though RNase L caused reduction of reporter fluorescence from the construct with the control 3′UTR, due to the RNase L suppression of cellular growth –to demonstrate this effect we preferred not to normalize these experiments–, it was far more potent towards the HuR 3′UTR regions and on uPA ARE-containing 3′UTR (Fig. 4C). RNase L was able to potently (Bonferroni test for each of the column pair against control was <0.001) downregulated fluorescence activity from fusion RNAs containing HuR 3′UTRs with both ARE-like and ARE regions by at least 3-fold (Fig. 4B, Construct 2 and 3, respectively) when compared to the control 3′UTR (Construct 1, p<0.001). These data suggest that RNase L may generally act on U-rich containing sequences. An RT-PCR using specific primers to HuR mRNA was performed on IP RNA obtained after anti-RNase L (data not shown); RNase L did not appear to bind HuR mRNA directly and thus may require other interacting partners.
Figure 4. Response of HuR 3′UTR-mediated reporter activity to RNase L.
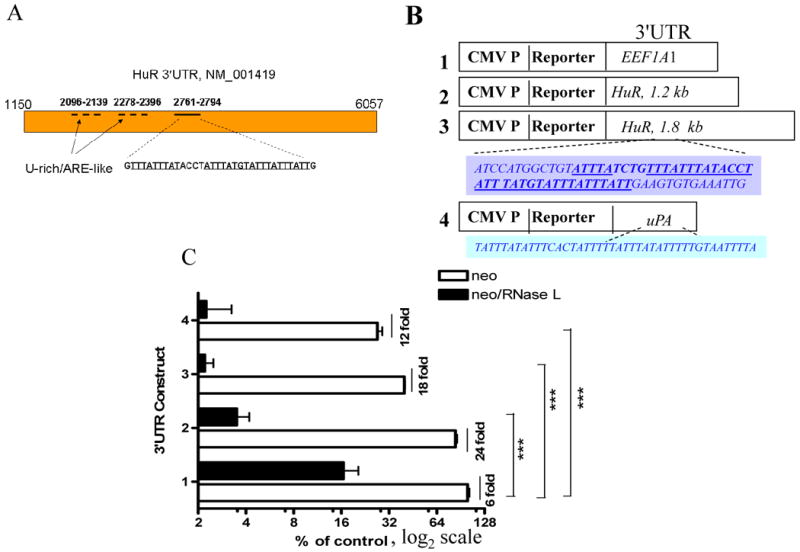
(A) The positions of U-rich/ARE-like regions and ARE in the 3′UTR of HuR mRNA reference record.
B) Schematic diagram of reporter constructs fused with control EEF1A1 3′UTR (Construct 1), HuR 3′UTR U-rich/ARE like region (Construct 2), HuR ARE-containing 3′UTR region (Construct 3), and uPA 3′UTR (Construct 4). The shaded boxes show recognizable ARE of HuR 3′UTR and the known uPA ARE.
(C) Cell lines stably expressing RNase L/neo and vector/neo in 96-well plates were transfected with the different 3′UTR constructs as indicated. Numbers in x-axis refer to the constructs as outlined in B. Readings are mean ± SEM of fluorescence intensities from quadruplicate wells. *** p value <0.001 with Bonferroni posttests and two-away ANOVA.
Dependence of RNase L activity on confluency, cell cycle and nuclear/ cytoplasmic distribution
The effect of RNase L on cellular growth appeared to be greater in confluent cells when compared to sub-confluent cells (Fig. 1A and B; Fig. 2C). Likewise, the effect of RNase L on HuR levels was greater in confluent cells when compared to sub-confluent cells (Fig. 5A). As a result, we did not observe consistently an effect of RNase L on HuR levels with sub-confluent cells. To determine if the effect was dependent on cell cycle, the RNase L expressing cells were synchronized in late G1 with G1/S arrest using a starvation/aphidocholin treatment regimen. Flow cytometry data showed that the cells were indeed 75% in G1 phase and most of the HuR was cytoplasmic. HuR was dramatically reduced in RNase L-expressing cells at the G1/S transition (Fig. 5B). In contrast, when G1/S arrested cells were released by trypsinizing the cells and then sub-culturing them to S phase, there was no effect of RNase L on HuR protein (Fig. 5B). In this case, HuR was nuclear. Likewise, asynchronized cells or cells in phases where HuR is predominately nuclear, the effect of RNase L was negligible (data not shown). These data suggest that the effect of RNase L on HuR occurs when cell conditions favor cytoplasmic localization of HuR. Indeed, kinetics experiments of HuR translocation monitored by both confocal microscopy and flow cytometry, showed that HuR cytoplasmic localization was dependent on cell cycle phase (Supplementary Fig.3).
Figure 5. RNase L activity during cellular growth and confluence.
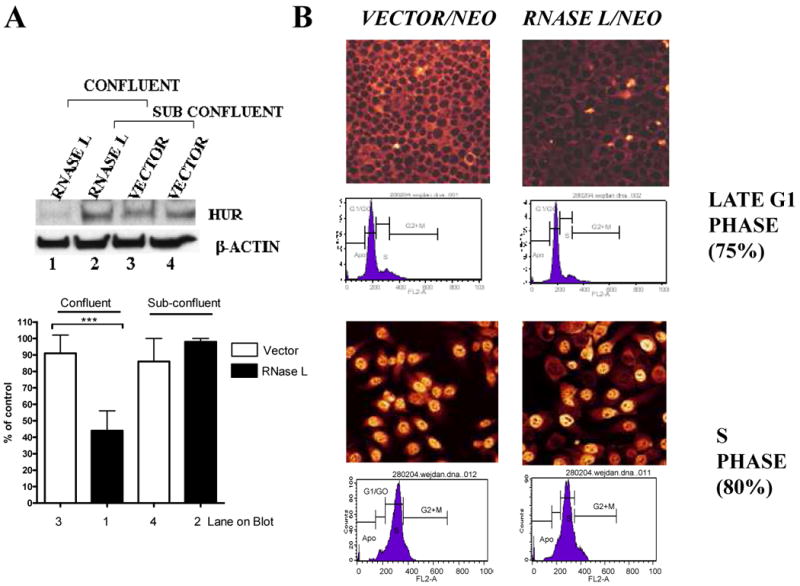
(A) RNase L/neomycin or vector/neomycin stably expressing cells were grown into two different densities in 6-well plates, so that confluent (100% of total well area) and sub confluent (∼40%) monolayers were achieved the next day. Western blots were performed using anti-HuR and anti-β-actin. The β-actin normalized densitometry of blots (Mean ± SEM) from three independent experiments are shown (lower panel). *** denotes p<0.001 using student-t test.
(B) Cells that stably express neomycin/vector control or RNase L/neomycin were seeded on cover slips. After 20 hrs, the cells were serum starved then treated with aphidocholin for additional 20 hrs to arrest cells in G1/S, i.e., late G1 (upper panels). Subsequently, cells were released from the arrest to enter S phase (lower panels) by removing the drug and sub-culturing in complete medium with 15% serum for 8 hours-These conditions were first optimized as shown in Supplementary Fig.3. The fluorescently-labeled secondary antibody was used to reveal anti-HuR antibody using confocal microscopy. Flow cytometry was performed by propidium iodide staining.
In order to gain further insights to the differential effect of RNase L on HuR during confluence or cell cycle, we have looked at nuclear/cytoplasmic distribution of RNase L. Because of the low expression of RNase L in the cell line used in the previous experiments, i.e., HeLa, we used Huh7 liver cell line for the localization studies. We found that RNase L can exist in the nucleus or in the cytoplasm when cells are sub-confluent or confluent, respectively (Fig. 6A). This may explain RNase L down-regulation of HuR in confluent cells since RNase L is known to be active in the cytoplasm. The spatial distribution of RNase L and HuR during confluent and sub-confluent cell conditions was also verified by Western blotting using nuclear and cytoplasmic fractions (Fig. 6B).
Figure 6. Nuclear/cytoplasmic distribution of RNase L.
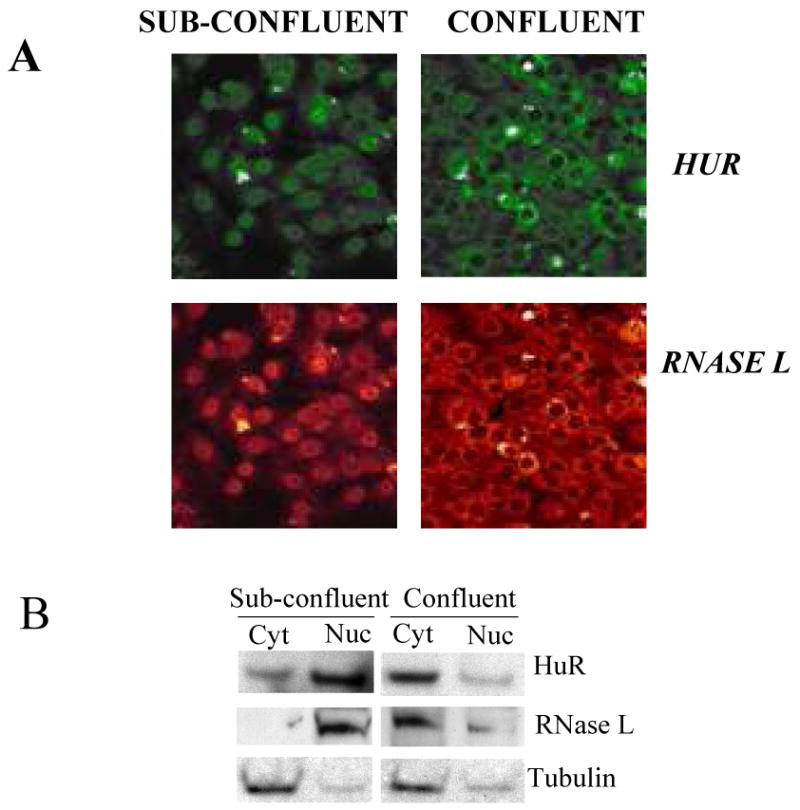
(A) Huh-7 cells, which constitutively express immunofluorescently detectable levels of RNase L, were seeded on cover slips with two different densities to allow cells to reach either sub-confluent (∼40%) or confluent stage the next day. Cells were stained with anti-RNase L or anti-HuR followed by secondary antibody that is either FITC-conjugated (green color, HuR) or TRITC-conjugated (red color, RNase L) for confocal visualization.
(B) Huh-7 cells were seeded with two different densities to allow cells to reach either sub-confluent (∼40%) or confluent stage the next day. Nuclear and cytoplasmic extracts were subjected to Western blotting using antibodies to RNase L, HuR, and tubulin (cytoplasmic control) to confirm the findings in A. The blot is one of two (RNase L) and three (HuR) independent experiments.
Since RNAse L is continuously devoid in RNASEL-knockout MEFs, HuR upregulation should be seen in both nuclear and cytoplasmic compartments and independent on confluence. Supplemental data (Supplementary Fig. 2 and Fig.4) showed this is the case.
Discussion
RNase L has an essential role in host defense, particularly against viruses including both DNA and RNA viruses (3, 14, 16). Further work showed that RNase L is also involved in apoptosis and in tumor suppression although without known mechanisms (2, 15, 17, 24, 31-33). In this study, we demonstrated a probable mechanism whereby RNase L suppresses cellular growth. Briefly, we have provided evidence, using both RNase L over-expression and RNase L knockout models, that RNase L-mediated suppression of cellular growth is associated with downregulation of the RNA binding protein, HuR, mRNA and protein, and dependent on cytoplasmic localization of RNase L. HuR stabilizes key AU-rich mRNAs involved in cellular growth (e.g., cyclin D1 and c-myc) and angiogenesis/metastasis, such as uPA, COX-2, and VEGF. HuR is well known to upregulate mRNA targets important for cell proliferation and subsequently increases cellular growth (8, 9). Thus, we have not pursued further confirmation of the well-studied pathway of HuR effect on cellular growth. Instead, we have focused on RNase L suppression of cellular growth and correlation with HuR expression.
In this report, we found that RNase L influenced HuR mRNA expression by virtue of using microarray analysis on cells stably expressing moderate amounts of RNase L. Although, RNase L has been primarily recognized in the past as anti-viral mRNA, the data on the effect of RNase L on the mRNA stability of HuR in this study, PKR in our previous report (20), on MyoD by other investigators (34) and on ISG43 (35), clearly indicate a regulatory role on cellular mRNAs without virus activation. The mRNA for MyoD, a muscle differentiation transcriptional factor, which itself has been shown to be a target for RNase L (34), was also found to be an HuR mRNA target by a previous study (36). This may indirectly support our finding of RNase L action on HuR mRNA. The HuR 3′UTR contains both ARE-like and ARE which may renders the HuR mRNA more susceptible to RNase L action which is known to cleaves at UU or UA dinucleotides (28). The effect of RNase L on cellular mRNA is not global since many control and housekeeping mRNAs are not affected (20, 34, 35). An intriguing question is: What is the source of double-stranded RNA, an activator of OAS which leads to generation of 2-5A that binds and activates RNase L? The answer may be the cellular mRNAs themselves which assume secondary RNA structures such as hairpins that can activate the OAS/RNase L. A general review of the source and fate of putative cellular double stranded RNA is reviewed in (11). In addition, cellular mRNAs capable of activating OAS/RNAse L system have been recently described (12, 37).
The RNase L effect appears to be associated with its cytoplasmic localization which is favored in confluent cells. It has been shown that RNase L/OAS pathway fluctuates with cell confluence (3, 38) and may contribute, at least partly, to some of the observations with confluent cells. For example, levels of OAS, which is an upstream activator of the RNase L pathway, increases at confluence (38) and in HeLa cells and at G1/S transition in Daudi cells (39). In this study, we show that the requirement of confluence for the described RNase L activity paralleled the spatial distribution and localization of HuR and RNase L during cell confluence stages. Thus, it appeared that both RNase L cytoplasmic localization and activity are optimum in confluent cells or specifically at G1/S transition.
HuR is a nuclear shuttling protein (40) that primarily exists in the nucleus and moves to the cytoplasm during cellular activation and stress (5, 41). Previous work suggests that HuR translocation to the cytoplasm is temporal where it may regulate the stability or translation of cell cycle mRNAs (42). Also, a recent study found that a target for HuR is the RNase L mRNA (43) indicating the possibility for reciprocal regulation of RNase L and HuR mediated events. Since both HuR and RNase L localize in the nucleus during sub-confluent cell stages and appear in the cytoplasmic compartment as cells grow to confluence, RNase L may actually be a shuttling protein. An earlier report showed that RNase L can exist in both cytoplasm and nucleus and this can be influenced by cell confluence (44). Thus, our finding of RNase L in the nucleus, despite the notion that RNase L is a cytoplasmic protein, supports this earlier report. Further details of RNase L as a shuttling protein such as presence of nuclear localization signal in RNase L will require different set of experiments.
In situations where RNase L is mutated (17), control of HuR expression by RNase L may also be defective. Expression of HuR and cytoplasmic localization have been shown to be increased in several tumors such as breast, colon, gastric, and ovarian tumors when compared to normal tissues (9, 45-47). Many important mRNA targets for HuR such as cyclin D1, COX-2, and uPA, have defined roles in tumor maintenance and metastasis. In healthy cells, RNase L may act as a negative feedback mechanism for HuR expression. Deregulation of this pathway may lead to upregulation of HuR mRNA targets in which their gene products are involved in tumor promoting events.
Materials and Methods
Cell lines
WISH (HeLa markers) and HeLa cell lines were obtained from American Type Culture Collection (ATCC; Rockville, MD) and cultured in RPMI 1640 (Invitrogen, Carlsbad, CA) supplemented with 10% FBS and antibiotics. Huh-7 was obtained from Dr. Stephen Polyak (University of Washington, Seattle, WA) and was propagated in DMEM medium with 10% FBS and antibiotics. RNase L+/+ mouse embryonic fibroblast (MEF) lines were generated from C57BL/6 mice while RNase L−/− MEFs were generated from RNAse L-/- mice on the C57BL/6 background as previously described (15). Immortalized post-crisis lines (10-14 passages (15) were initially obtained by continuous culturing and propagated in DMEM with high glucose, supplemented with 10% FBS and antibiotics (Invitrogen). The passage numbers used in this study were between 30 and 37.
Transient and stable transfection of polyclonal cell lines for RNase L and HuR
HeLa cells were transfected with either pcDNA3.1 vector, pcDNA3.1 containing full-length human RNase L cDNA or full length human cDNA for HuR (kindly provided by Dr. Christoph Moroni, Basel, Switzerland). Stable transfections were performed in medium without serum using Lipofectamine 2000 (Invitrogen) for 6 hours, followed by replacing the medium with serum-supplemented medium. Transient transfections were continued for 18 hours. For stable polyclonal cell lines, cells were treated with neomycin (G418) after 18 hr and until stable clones formed and pooled as a single polyclonal line. Cells were only used for the first 20 passages which had no loss of over-expression as determined by Western blotting.
Western Blotting
Cells were lysed for 30 min on ice in lysing buffer which contains 10 mM Tris, 150 mM NaCl, 1% NP40, 0.5% sodium deoxycholate, 0.1% SDS and protease inhibitor cocktail (Sigma; St. Louis, MO). Fractionation of nuclear and cytoplasm components was performed using a kit (Biochain) according to the manufacturer's instructions. Equal amounts of protein samples were subjected to electrophoresis on 10% polyacrylamide–SDS gels followed by transfer to nitrocellulose membranes (Hybond ECL, Amersham Biosciences, Little Chalfont, U.K). Membranes were hybridized with primary antibody (1/500) to HuR (Santa Cruz Biotechnology, Santa Cruz, CA), RNase L (1/500), or β actin (1/1000) followed by appropriate dilution of secondary HRP-conjugated antibody. The anti-mouse RNase L which is raised in rabbits against an N-terminus peptide of mouse RNase L was generated using custom peptide and antibody synthesis service (Alpha Diagnostics, San Antonio, TX). Signal detection was performed with ECL Western blotting detection reagents (Amersham). Protein molecular weight markers were used to verify the size of the proteins.
Real Time Continuous Assessment of cellular growth
Cellular growth of cell lines expressing RNase L, mutant RNase L forms, or devoid of RNase L was assessed using the real time electronic biosensor, RT-CES system (ACEA Biosciences Inc., San Diego, CA). This system is described in detail elsewhere (22, 23). Cells were seeded in a special 96-well plate and incubated in the RT-CES system incubator for a period of five days. Data were collected every 20 minutes automatically by the analyzer under the control of integrated software. For verification, a cellular growth curve was also obtained using colorimetric growth indicator Alamar blue (BioSource International, Camarillo, CA) according to the manufacturer's instructions.
Microarray expression and analysis
In-house made microarrays were used and contained cDNA probes representing ARE-cDNA clones in which their identities were obtained from the AU-rich element-containing mRNA database (ARED; (48). The cDNA probes were generated by PCR and spotted at least in duplicate on UltraGAPS II slides (Corning) using the Microgrid spotting robot (Genomic Solutions, San Diego, California). The microarrays were used for co-hybridization, utilizing Genisphere kit (Genisphere, Inc., Hatfield, PA), with cDNA generated from total RNA (20 μg) labeled with Cy3 and Cy5 for control and experiment, respectively; details were previously described (26). Scanning was performed with a ScanArray scanner and the intensity of green and red fluorescent signals from each spotted cDNA sequence on the microarrays was calculated using adaptive circle algorithm and mean intensity of the pixels. Pre-processing, filtering of erroneous signals, normalization procedures, and calculation of intensity ratios were previously described in detail (26).
3′UTR PCR, construction, and Cloning of reporter plasmids
Regions that contain putative U-rich elements sequences which correspond to the partial 3′UTRs of HuR (NM_00419; 1146-2359nt for U-rich ARE-like stretches, and 1146- 2920 nt for ARE-containing transcript, Fig. 3A)) and urokinase activator (NM_002658; 2161-2301nt) were obtained by RT-PCR. Briefly, total RNA was extracted by Tri Reagent from LPS-induced THP-1 cell line. The cDNAs were amplified by PCR in which the forward primer contains BamH1 site (underlined) and the reverse primer with XbaI site (underlined) as follows: The HuR short 3′UTR region was amplified by: forward primer: 5′ CAGCAGGGATCCTAACTCGCT CATGCTT TTTTTTG 3′. Reverse primer: 5′CGACCTCTAGAATTCGAGCAAAACAAAATC 3′. The HuR 3′UTR of a longer region was amplified using the following primers: Forward primer: 5′ CAGCAGGGATCCTAACTCGCTCATGCTTTTTTTTG 3′ and the reverse primer is 5′ CGACCTCTAGACACAGCCCCTCAGTAAAAGA3′. The uPA 3′UTR forward and reverse primes are as follows: CAGCAGGGATCCCACTGTCTCAGTTTCACT TT3′ and 5′ CGACCTCTAGACATCAG AAAAA TCACATTTTATTG 3′. The PCR products were purified, precipitated, and cut by BamH1 and XbaI sequentially, and subsequently ligated into EGFP plasmid (Gene Therapy Systems, Inc., San Diego, CA) which is under CMV/Intron A constitutive promoter. After ligation and transformation, recombinant colonies were verified by PCR using a forward vector specific primer and 3′UTR or ARE reverse primer.
Reporter transfection and activity assessment
Reporter constructs containing GFP-3′UTR/ARE were used in transient transfection at 25 ng per 2 × 10⁴ cell/well in 96-well microplates. Transfection was performed with Lipofectamine 2000 as described earlier. In co-transfection experiments the expression plasmids of RNase L, HuR, and mock (pcDNA 3.1) were kept constant at 100 ng unless otherwise indicated. Transfection efficiency and normalization to control was achieved using EGFF reporter fused with stable EEF1A1 3′UTR. The intra-well variance of any replicate groups in fluorescence is generally <6% which does not warrant intra-well normalization of transfection (30). Fluorescence was quantitated using a sensitive bottom read instrument ZENYTH 3100 (Anthos Labtec, Eugendorf, Austria) or by using image segmentation and quantitation algorithm (30). Data are presented as mean value ± SEM of fluorescence intensity.
Semi-quantitative RT-PCR
Total RNA was extracted using Trizol method. RT reaction was performed using 200 ng total RNA, 500 ng oligo dT(18-23), 500 mM dNTP mixture, 20 U RNAsin (Pharmacia), 200 U of SuperScript II (Invitrogen). Hot start PCR amplification was performed using Taq DNA polymerase (Qiagen). cDNA was amplified according to an amplification curve, for example, β-actin cDNA was amplified with 28 cycles, whereas, HuR or RNAse L cDNA was amplified with 34 cycles. The amplification curve was determined for each cDNA of interest by plotting increasing cycle numbers against ethidium bromide stained gel intensity of the amplified products. The optimum cycle number chosen was within the exponential phase of the curve. Cycling was 94° C for 60 s, 60°C for 60 s, and 72°C for 60 s using primers specific to HuR coding region. The RNase L forward primer is: 5′ CGTCATGGAGAGCAGGGAT3′ and the reverse primer is: 5′GAGTCAGCACCCAGGGCT GG3′. The mouse HuR Forward primer is: 5′CCCAAGCTCAGAGGTCATC 3′ and mouse HuR Reverse is 5′GAGTGGTACAGCTGCG AGAG3′. The β-actin forward primer is 5′ATCTGGCACCACACCTTCTACAATGAG CTGCG3′ and the β-actin reverse primer: 5′CGTCATACTCCTGCT TGCTGATCCACA3′. The β-actin primers were designed to span short intronic sequences so that the larger PCR products would be shown in case there was genomic DNA contamination. In all of the above, PCR conditions allowed at least semi-quantitative comparisons of signal strength on agarose gels as the cycle number was chosen in the exponential range which has not reached the plateau.
Confluence and flow cytometry analysis
Cells were made either subconfluent or confluent by culturing the appropriate cell number overnight. Cell quiescence of normal human fibroblasts was achieved by confluence over a period of three days. Cell synchronization was achieved by first arresting G0 by starvation using serum free medium for 16 hrs, followed by synchronization at G1/S by treating cells with 5 μg/ml aphidocholin (Sigma) for 20 hrs. To release cells in the S phase, the cells were washed off the inhibitor and subcultured in complete medium with 15% serum. Cell phase status was monitored by flow cytometry. Cells from either sub-confluent (40% of total well area) or confluent cultures were harvested by trypsinization, washed in PBS and resuspended in ice-cold fixation solution. Cell suspensions were processed for cell-cycle determination using the propidium iodide method with flow cytometry.
Immunofluorescence and confocal microscopy
Cells were seeded on cover slips, mounted on slides, overnight to be sub-confluent (40% of total well area) or confluent (100%) for the following day. The slides were formaldehyde-fixed for 15 min at 37°C in PBS (pH 7.4), followed by permealization of the cellular membrane with 0.05% triton for 5 min incubation and treated with 1/50 primary antibody to HuR or RNase L for 16 h at 4°C. The cells were then washed to remove unbound antibodies and then treated with FITC-labeled secondary antibody (1/200; 1 h at 37°C). Cells were then washed in PBS and the fluorescence was analyzed using confocal microscopy (Leica-Kaki, Saudi Arabia). For co-localization studies, cells were treated with goat anti-HuR (1/50) and mouse anti-RNase L (1/50; C-17, Santa Cruz). FITC-conjugated and TRITC-conjugated secondary antibodies were used for HuR and RNase L antibodies, respectively.
Statistics and image analysis
For comparison between two groups (columns on figures) the student's paired t test was used. Two-tailed probabilities were reported. Densitometry, band detection, background subtraction, and normalization of images were performed using ImageMaster Software (Amersham). The one-phase exponential decay curve analysis (GraphPad Prism) was used to assess mRNA decay kinetics as previously described (20). The exponential growth equation Y=Start*exp(K*X) where Y=Start and increases exponentially with rate constant K, was used to assess growth curve fits to allow statistical comparison (F test). In those data with multiple comparisons, the two-way ANOVA with Bonferroni post-test was also used.
Supplementary Material
Supplemental Data
Acknowledgments
The authors thank Dr. Myriam Gorospe for critical reading of the manuscript. We also thank Dr. Christoph Moroni for supplying HuR expression vector. We thank Dr. A. Aboussekhra for his valuable comments on cell cycle experiments. We also appreciate the staff at the flow cytometry facility for their technical assistance. The assistance of Dr. P. Mohideen, Mr. Maher al-Saif, and Mr. Fahad Al-Zoghaibi in cloning of the 3′UTR and AREs is appreciated. We are also indebted to the King Faisal Specialist Hospital and Research Center Subsidiary in Maryland, U.S.A for managing and expediting reagent and supplies purchases for this study.
References
- 1.Silverman RH. Implications for RNase L in prostate cancer biology. Biochemistry. 2003;42:1805–12. doi: 10.1021/bi027147i. [DOI] [PubMed] [Google Scholar]
- 2.Carpten J, et al. Germline mutations in the ribonuclease L gene in families showing linkage with HPC1. Nat Genet. 2002;30:181–4. doi: 10.1038/ng823. [DOI] [PubMed] [Google Scholar]
- 3.Zhou A, et al. Impact of RNase L overexpression on viral and cellular growth and death. J Interferon Cytokine Res. 1998;18:953–61. doi: 10.1089/jir.1998.18.953. [DOI] [PubMed] [Google Scholar]
- 4.Tran H, Maurer F, Nagamine Y. Stabilization of urokinase and urokinase receptor mRNAs by HuR is linked to its cytoplasmic accumulation induced by activated mitogen-activated protein kinase-activated protein kinase 2. Mol Cell Biol. 2003;23:7177–88. doi: 10.1128/MCB.23.20.7177-7188.2003. [DOI] [PMC free article] [PubMed] [Google Scholar]
- 5.Wang W, et al. HuR regulates p21 mRNA stabilization by UV light. Mol Cell Biol. 2000;20:760–9. doi: 10.1128/mcb.20.3.760-769.2000. [DOI] [PMC free article] [PubMed] [Google Scholar]
- 6.Wang W, Yang X, Cristofalo VJ, Holbrook NJ, Gorospe M. Loss of HuR is linked to reduced expression of proliferative genes during replicative senescence. Mol Cell Biol. 2001;21:5889–98. doi: 10.1128/MCB.21.17.5889-5898.2001. [DOI] [PMC free article] [PubMed] [Google Scholar]
- 7.Subbaramaiah K, Marmao TP, Dixon DA, Dannenberg AJ. Regulation of cyclooxygenase-2 mRNA stability by taxanes. Evidence for involvement of p38, MAPKAPK-2 and HuR@. J Biol Chem. 2003;25:25. doi: 10.1074/jbc.W119.012137. [DOI] [PMC free article] [PubMed] [Google Scholar]
- 8.Dormoy-Raclet V, et al. The RNA-binding protein HuR promotes cell migration and cell invasion by stabilizing the {beta}-actin mRNA in a U-rich-element-dependent manner. Mol Cell Biol. 2007;27:5365–80. doi: 10.1128/MCB.00113-07. [DOI] [PMC free article] [PubMed] [Google Scholar]
- 9.Lopez de Silanes I, et al. Role of the RNA-binding protein HuR in colon carcinogenesis. Oncogene. 2003;22:7146–54. doi: 10.1038/sj.onc.1206862. [DOI] [PubMed] [Google Scholar]
- 10.Stark GR, Kerr IM, Williams BR, Silverman RH, Schreiber RD. How cells respond to interferons. Annu Rev Biochem. 1998;67:227–64. doi: 10.1146/annurev.biochem.67.1.227. [DOI] [PubMed] [Google Scholar]
- 11.Wang Q, Carmichael GG. Effects of length and location on the cellular response to double-stranded RNA. Microbiol Mol Biol Rev. 2004;68:432–52. doi: 10.1128/MMBR.68.3.432-452.2004. [DOI] [PMC free article] [PubMed] [Google Scholar]
- 12.Molinaro RJ, et al. Selection and cloning of poly(rC)-binding protein 2 and Raf kinase inhibitor protein RNA activators of 2′,5′-oligoadenylate synthetase from prostate cancer cells. Nucleic Acids Res. 2006;34:6684–95. doi: 10.1093/nar/gkl968. [DOI] [PMC free article] [PubMed] [Google Scholar]
- 13.Kumar R, Choubey D, Lengyel P, Sen GC. Studies on the role of the 2′-5′-oligoadenylate synthetase-RNase L pathway in beta interferon-mediated inhibition of encephalomyocarditis virus replication. J Virol. 1988;62:3175–81. doi: 10.1128/jvi.62.9.3175-3181.1988. [DOI] [PMC free article] [PubMed] [Google Scholar]
- 14.Li XL, Blackford JA, Hassel BA. RNase L mediates the antiviral effect of interferon through a selective reduction in viral RNA during encephalomyocarditis virus infection. J Virol. 1998;72:2752–9. doi: 10.1128/jvi.72.4.2752-2759.1998. [DOI] [PMC free article] [PubMed] [Google Scholar]
- 15.Zhou A, et al. Interferon action and apoptosis are defective in mice devoid of 2′,5′- oligoadenylate-dependent RNase L. Embo J. 1997;16:6355–63. doi: 10.1093/emboj/16.21.6355. [DOI] [PMC free article] [PubMed] [Google Scholar]
- 16.Khabar KS, et al. Effect of deficiency of the double-stranded RNA-dependent protein kinase, PKR, on antiviral resistance in the presence or absence of ribonuclease L: HSV-1 replication is particularly sensitive to deficiency of the major IFN-mediated enzymes. J Interferon Cytokine Res. 2000;20:653–9. doi: 10.1089/107999000414835. [DOI] [PubMed] [Google Scholar]
- 17.Urisman A, et al. Identification of a Novel Gammaretrovirus in Prostate Tumors of Patients Homozygous for R462Q RNASEL Variant. PLoS Pathog. 2006;2:e25. doi: 10.1371/journal.ppat.0020025. [DOI] [PMC free article] [PubMed] [Google Scholar] [Retracted]
- 18.Cirino NM, Li G, Xiao W, Torrence PF, Silverman RH. Targeting RNA decay with 2′,5′ oligoadenylate-antisense in respiratory syncytial virus-infected cells. Proc Natl Acad Sci U S A. 1997;94:1937–42. doi: 10.1073/pnas.94.5.1937. [DOI] [PMC free article] [PubMed] [Google Scholar]
- 19.Wreschner DH, James TC, Silverman RH, Kerr IM. Ribosomal RNA cleavage, nuclease activation and 2-5A(ppp(A2′p)nA) in interferon-treated cells. Nucleic Acids Res. 1981;9:1571–81. doi: 10.1093/nar/9.7.1571. [DOI] [PMC free article] [PubMed] [Google Scholar]
- 20.Khabar KS, et al. RNase L mediates transient control of the interferon response through modulation of the double-stranded RNA-dependent protein kinase PKR. J Biol Chem. 2003;278:20124–32. doi: 10.1074/jbc.M208766200. [DOI] [PubMed] [Google Scholar]
- 21.Khabar KS, et al. Constitutive and IFN-induced antiviral enzyme activities: expected and surprising consequences in gene-devoid fibroblasts. Journal of Interferon and Cytokine Research Annual Meeting of Interferon and Cytokine Research 1999 [Google Scholar]
- 22.Zhu J, Wang X, Xu X, Abassi YA. Dynamic and label-free monitoring of natural killer cell cytotoxic activity using electronic cell sensor arrays. J Immunol Methods. 2006;309:25–33. doi: 10.1016/j.jim.2005.10.018. [DOI] [PubMed] [Google Scholar]
- 23.Solly K, Wang X, Xu X, Strulovici B, Zheng W. Application of real-time cell electronic sensing (RT-CES) technology to cell-based assays. Assay Drug Dev Technol. 2004;2:363–72. doi: 10.1089/adt.2004.2.363. [DOI] [PubMed] [Google Scholar]
- 24.Castelli JC, et al. The role of 2′-5′ oligoadenylate-activated ribonuclease L in apoptosis. Cell Death Differ. 1998;5:313–20. doi: 10.1038/sj.cdd.4400352. [DOI] [PubMed] [Google Scholar]
- 25.Diaz-Guerra M, Rivas C, Esteban M. Activation of the IFN-inducible enzyme RNase L causes apoptosis of animal cells. Virology. 1997;236:354–63. doi: 10.1006/viro.1997.8719. [DOI] [PubMed] [Google Scholar]
- 26.Khabar KS, et al. Expressed gene clusters associated with cellular sensitivity and resistance towards anti-viral and anti-proliferative actions of interferon. J Mol Biol. 2004;342:833–46. doi: 10.1016/j.jmb.2004.07.065. [DOI] [PubMed] [Google Scholar]
- 27.Frevel MA, et al. p38 Mitogen-activated protein kinase-dependent and -independent signaling of mRNA stability of AU-rich element-containing transcripts. Mol Cell Biol. 2003;23:425–36. doi: 10.1128/MCB.23.2.425-436.2003. [DOI] [PMC free article] [PubMed] [Google Scholar]
- 28.Wreschner DH, McCauley JW, Skehel JJ, Kerr IM. Interferon action--sequence specificity of the ppp(A2′p)nA-dependent ribonuclease. Nature. 1981;289:414–7. doi: 10.1038/289414a0. [DOI] [PubMed] [Google Scholar]
- 29.Lal A, et al. Concurrent versus individual binding of HuR and AUF1 to common labile target mRNAs. Embo J. 2004;23:3092–102. doi: 10.1038/sj.emboj.7600305. [DOI] [PMC free article] [PubMed] [Google Scholar]
- 30.Al-Zoghaibi F, et al. Bioinformatics and experimental derivation of an efficient hybrid 3′ untranslated region and use in expression active linear DNA with minimum poly(A) region. Gene. 2007;391:130–9. doi: 10.1016/j.gene.2006.12.013. [DOI] [PubMed] [Google Scholar]
- 31.Andersen JB, et al. Role of 2-5A-dependent RNase-L in senescence and longevity. Oncogene. 2007;26:3081–8. doi: 10.1038/sj.onc.1210111. [DOI] [PubMed] [Google Scholar]
- 32.Liu W, Liang SL, Liu H, Silverman R, Zhou A. Tumour suppressor function of RNase L in a mouse model. Eur J Cancer. 2007;43:202–9. doi: 10.1016/j.ejca.2006.08.024. [DOI] [PubMed] [Google Scholar]
- 33.Xiang Y, et al. Effects of RNase L mutations associated with prostate cancer on apoptosis induced by 2′,5′-oligoadenylates. Cancer Res. 2003;63:6795–801. [PubMed] [Google Scholar]
- 34.Bisbal C, et al. The 2′-5′ oligoadenylate/RNase L/RNase L inhibitor pathway regulates both MyoD mRNA stability and muscle cell differentiation. Mol Cell Biol. 2000;20:4959–69. doi: 10.1128/mcb.20.14.4959-4969.2000. [DOI] [PMC free article] [PubMed] [Google Scholar]
- 35.Li XL, et al. RNase-L-dependent destabilization of interferon-induced mRNAs. A role for the 2-5A system in attenuation of the interferon response. J Biol Chem. 2000;275:8880–8. doi: 10.1074/jbc.275.12.8880. [DOI] [PubMed] [Google Scholar]
- 36.van der Giessen K, Di-Marco S, Clair E, Gallouzi IE. RNAi-mediated HuR depletion leads to the inhibition of muscle cell differentiation. J Biol Chem. 2003;278:47119–28. doi: 10.1074/jbc.M308889200. [DOI] [PubMed] [Google Scholar]
- 37.Malathi K, Dong B, Gale M, Jr, Silverman RH. Small self-RNA generated by RNase L amplifies antiviral innate immunity. Nature. 2007;448:816–9. doi: 10.1038/nature06042. [DOI] [PMC free article] [PubMed] [Google Scholar]
- 38.Jacobsen H, Krause D, Friedman RM, Silverman RH. Induction of ppp(A2′p)nA-dependent RNase in murine JLS-V9R cells during growth inhibition. Proc Natl Acad Sci U S A. 1983;80:4954–8. doi: 10.1073/pnas.80.16.4954. [DOI] [PMC free article] [PubMed] [Google Scholar]
- 39.Kumar R, Korutla L, Zhang K. Cell cycle-dependent modulation of alpha-interferon-inducible gene expression and activation of signaling components in Daudi cells. J Biol Chem. 1994;269:25437–41. [PubMed] [Google Scholar]
- 40.Keene JD. Why is Hu where? Shuttling of early-response-gene messenger RNA subsets. Proc Natl Acad Sci U S A. 1999;96:5–7. doi: 10.1073/pnas.96.1.5. [DOI] [PMC free article] [PubMed] [Google Scholar]
- 41.Gallouzi IE, et al. HuR binding to cytoplasmic mRNA is perturbed by heat shock. Proc Natl Acad Sci U S A. 2000;97:3073–8. doi: 10.1073/pnas.97.7.3073. [DOI] [PMC free article] [PubMed] [Google Scholar]
- 42.Atasoy U, Watson J, Patel D, Keene JD. ELAV protein HuA (HuR) can redistribute between nucleus and cytoplasm and is upregulated during serum stimulation and T cell activation. J Cell Sci. 1998;111:3145–56. doi: 10.1242/jcs.111.21.3145. [DOI] [PubMed] [Google Scholar]
- 43.Li XL, Andersen JB, Ezelle HJ, Wilson GM, Hassel BA. Post-transcriptional regulation of RNase-L expression is mediated by the 3′-untranslated region of its mRNA. J Biol Chem. 2007;282:7950–60. doi: 10.1074/jbc.M607939200. [DOI] [PubMed] [Google Scholar]
- 44.Bayard BA, Gabrion JB. 2′,5′-Oligoadenylate-dependent RNAse located in nuclei: biochemical characterization and subcellular distribution of the nuclease in human and murine cells. Biochem J. 1993;296(Pt 1):155–60. doi: 10.1042/bj2960155. [DOI] [PMC free article] [PubMed] [Google Scholar]
- 45.Denkert C, et al. Overexpression of the embryonic-lethal abnormal vision-like protein HuR in ovarian carcinoma is a prognostic factor and is associated with increased cyclooxygenase 2 expression. Cancer Res. 2004;64:189–95. doi: 10.1158/0008-5472.can-03-1987. [DOI] [PubMed] [Google Scholar]
- 46.Mrena J, et al. Cyclooxygenase-2 is an independent prognostic factor in gastric cancer and its expression is regulated by the messenger RNA stability factor HuR. Clin Cancer Res. 2005;11:7362–8. doi: 10.1158/1078-0432.CCR-05-0764. [DOI] [PubMed] [Google Scholar]
- 47.Heinonen M, et al. Cytoplasmic HuR expression is a prognostic factor in invasive ductal breast carcinoma. Cancer Res. 2005;65:2157–61. doi: 10.1158/0008-5472.CAN-04-3765. [DOI] [PubMed] [Google Scholar]
- 48.Bakheet T, Frevel M, Williams BRG, Greer W, Khabar KSA. ARED: Human AU-rich element-containing mRNA database reveals an unexpectedly diverse functional reportiore of encoded proteins. Nucleic Acids Research. 2001;29:246–254. doi: 10.1093/nar/29.1.246. [DOI] [PMC free article] [PubMed] [Google Scholar]
Associated Data
This section collects any data citations, data availability statements, or supplementary materials included in this article.
Supplementary Materials
Supplemental Data