Transcriptional loops meet chromatin: a dual-layer network controls white–opaque switching in Candida albicans (original) (raw)
Abstract
The human pathogen Candida albicans is able to undergo a reversible switch between two distinct cell types called white and opaque, which are considered different transcriptional states of cells harbouring identical genomes. The present model of switching regulation includes the bistable expression of a master switch gene that is controlled by multiple transcriptional feedback loops. Here, we show that chromatin-modifying enzymes constitute an additional important regulatory layer of morphogenetic switching. We identify eight chromatin modifiers as switching modulators. Extensive epistasis analysis maps them into at least two independent signalling pathways overlaying the known transcriptional network. Interestingly, we identify the conserved Set3/Hos2 histone deacetylase complex as a key regulator relying on the methylation status of histone H3 lysine 4 for switching modulation. Furthermore, we demonstrate that opaque to white switching is facilitated by the presence of adenine in vitro, but adenine has no effect on switching once the Set3/Hos2 complex is disrupted. Our observations postulate that chromatin modifications may serve as a means to integrate environmental or host stimuli through the underlying transcriptional circuits to determine cell fate in C. albicans.
Introduction
Individual cells in a genetically homogenous microbial culture may display different phenotypic characteristics. Such cell-to-cell variability is suggested to enhance the ability of microbial populations to adapt to a wide range of environmental stimuli, which, in the case of pathogens, may represent a strategy to evade host defences (Avery, 2006). The fungal pathogen Candida albicans displays a remarkable spectrum of heritable morphogenetic variations which is considered a major factor in the transition from a harmless commensal to a systemic pathogen of its human host (Whiteway and Bachewich, 2007). An intriguing and unique ability of C. albicans is to form two distinct cell types: the so-called white and opaque phases. White and opaque cells contain the same genome, yet they differ in cellular morphology, colony shape, gene expression profile and virulence properties. In addition, white cells are unable to mate, whereas opaque cells are mating-competent (Bennett and Johnson, 2005).
White–opaque switching is an epigenetic phenomenon that was already described some 20 years ago (Slutsky et al., 1987), but the underlying molecular mechanisms have been only recently investigated. The white and opaque phases are heritable for many generations and switching between both phases is reversible, occurring at a frequency of one per ∼103−104 cell divisions (Rikkerink et al., 1988). The regulation of switching is believed to be transcriptional, and several transcription factors involved have been identified. C. albicans is obligatory diploid and harbours a mating type-like locus (MTL) holding two alleles, ‘a’ and ‘α’. Hence, the possible MTL configurations include MTLa/a,_MTL_α/α and MTLa/α (Hull and Johnson, 1999). A heterodimeric a/α repressor encoded by the a and α alleles respectively, locks MTL heterozygous cells in the white phase (Miller and Johnson, 2002) by repressing WOR1, the master opaque-promoting factor (Zordan et al., 2006). MTL homozygous cells lack the a/α repressor, and are thus permissive to switching. In MTLa/a or _MTL_α/α white cells, WOR1 is expressed at a very low level, and high-level expression of WOR1 is required for the conversion to the opaque phase (Huang et al., 2006; Srikantha et al., 2006; Zordan et al., 2006). By contrast, the transcription factor Efg1 is enriched in white cells and is required for maintenance of the white phase (Sonneborn et al., 1999; Srikantha et al., 2000). According to the current model, stochastic increase in Wor1 levels drive the transition from the white to the opaque phase. Furthermore, Wor1 autoregulates its own expression, facilitates expression of its cofactor WOR2, and represses EFG1 both directly and indirectly through promoting the expression of CZF1, a repressor of EFG1. As EFG1 is a putative repressor of WOR2, WOR1 thus co-ordinates three positive feedback loops to ensure high Wor1 levels, explaining the heritability of the opaque phase (Zordan et al., 2007). In addition, the histone deacetylases Hda1 and Rpd3 have been implicated in the regulation of white–opaque switching (Klar et al., 2001; Srikantha et al., 2001) but their precise role remains to be clarified.
In this work, we show that a complex dual-layer network, comprising of transcriptional regulators and chromatin-modifying enzymes, determines cellular identity in C. albicans. Our results experimentally confirm previous suggestions that cellular shape and phase-specific genes are regulated at different branching points of the transcriptional circuit, and that the genetic information affecting phase commitment converges at the WOR1 locus. Importantly, we identify eight genes encoding putative histone-modifying enzymes as novel modulators of white–opaque switching in C. albicans. An extensive epistasis analysis maps various histone-modifiers into the transcriptional circuit. Strikingly, we show that the Set3/Hos2 histone deacetylase complex is a key regulator of WOR1 expression, and thus conversion to the opaque phase. Furthermore, we provide genetic evidence that the newly identified Set3/Hos2 defines a pathway depending on histone H3 lysine 4 (H3K4) methylation for switching regulation. Finally, we identify adenine as novel environmental factor facilitating opaque to white conversion, and demonstrate that the regulatory effect of adenine on switching requires SET3. We propose a comprehensive model whereby chromatin modifiers constitute a layer of regulation modulating the transcriptional circuits to trigger switching. Chromatin modification offers a possible mechanism to integrate environmental stimuli, contrary to the current models that explain morphogenetic switching as a purely stochastic process. Moreover, we postulate that the dependence of the Set3/Hos2 complex on H3K4 methylation at certain loci may be an evolutionary conserved mechanism among other eukaryotic taxa.
Results
WOR1 acts downstream of EFG1 in phase commitment, while EFG1 acts downstream of WOR1 in morphology determination
The white and opaque cell types of C. albicans are distinguished based on four criteria. (i) Cellular morphology: white cells have a round shape; opaque cells are larger and elongated (Slutsky et al., 1987). (ii) Colony appearance: white cells form white, dome-shaped colonies on solid agar, while opaque cells form larger, flattened colonies that are stained pink on media containing Phloxin B (Slutsky et al., 1987). (iii) Gene expression profile: about 400 genes are regulated differentially in the two phases (Lan et al., 2002). For diagnostic purposes, the white-specific genes WH11 (Srikantha and Soll, 1993) and EFG1 (Sonneborn et al., 1999), as well as opaque-specific genes OP4 (Morrow et al., 1993) and SAP1 (Morrow et al., 1992) are commonly used. (iv) Mating competence: white cells are mating incompetent, whereas opaque cells can mate with opaque cells of the opposite mating type (Miller and Johnson, 2002).
Previous studies established WOR1 as the master regulator of the opaque phase. Deletion of WOR1 locks MTLa/a or _MTL_α/α cells in the white phase, whereas ectopic overexpression of WOR1 results in the conversion to the opaque phase (Huang et al., 2006; Zordan et al., 2006). On the other hand, MTL homozygous _efg1_Δ/Δ cells predominantly exist in the opaque phase, while ectopic EFG1 expression drives opaque to white conversion (Sonneborn et al., 1999). Recently, EFG1 was suggested to promote the white phase by repressing WOR2, a cofactor of WOR1 (Zordan et al., 2007). In addition, EFG1 was proposed to act downstream of the switching event to regulate cellular morphology (Srikantha et al., 2000).
In order to experimentally verify the latter two suggestions, we created an _efg1_Δ/Δ_wor1_Δ/Δ double mutant in an MTLa/a background. The MTLa/a_efg1_Δ/Δ_wor1_Δ/Δ mutant displayed an elongated cell shape, albeit shorter than wild type opaque cells, similar to the rare MTLa/a_efg1_Δ/Δ white cells as well as MTLa/α_efg1_Δ/Δ cells. In addition, the MTLa/a_efg1_Δ/Δ_wor1_Δ/Δ mutant formed large, flattened colonies appearing light pink on Phloxin B agar, intermediate to the white and pink colour of wild type white and opaque cells respectively. Conversely, MTLa/a_efg1_Δ/Δ white isolates and MTLa/α_efg1_Δ/Δ cells were white on Phloxin B plates (Fig. 1A). We inspected over 2000 colonies and all of them displayed the described morphology.
Fig. 1.
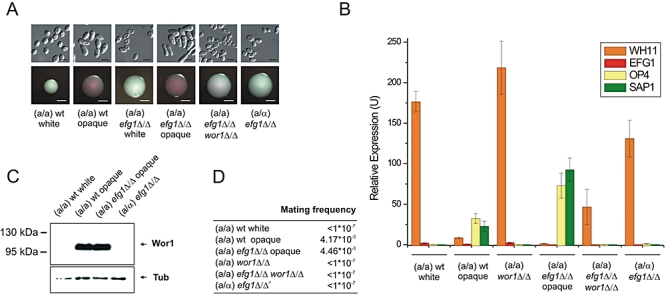
WOR1 acts downstream of EFG1 in phase commitment, while EFG1 acts downstream of WOR1 in morphology determination. A. Colony and cellular morphologies on modified Lee's medium containing 5 μg ml−1 Phloxin B. Scale bars correspond to 5 μm (upper panel) and 2 mm (lower panel). B. qRT-PCR analysis of phase-specific mRNA transcripts. WH11, EFG1 (white-specific) and OP4, SAP1 (opaque-specific) transcript levels were normalized to the transcript level of PAT1 (Zordan et al., 2006). qRT-PCR reactions were performed in triplicates and cDNA isolated from two independent cultures were analysed. Data are shown as mean ± SD. C. Immunoblot analysis confirms that WOR1 is repressed by EFG1 and the a/α repressor. Tubulin indicates equivalent loading. D. WOR1 is required for mating. Quantitative mating assays were performed with an opaque phase _MTL_α/α tester strain. At least two independent experiments per genotype were performed yielding qualitatively similar results. Values are shown of one representative experiment. #: tested with both an MTLa/a and an _MTL_α/α tester strain.
Next, we found that the _efg1_Δ/Δ_wor1_Δ/Δ double mutant expressed the white-specific transcript WH11 similar to wild type white and _wor1_Δ/Δ cells (the latter being locked in the white phase). Conversely, the opaque-specific transcripts OP4 and SAP1 were virtually undetectable. MTLa/α_efg1_Δ/Δ cells also showed a white-phase expression profile (Fig. 1B). These data are in accordance with previous publications and suggest that in switching-permissive cells, loss of EFG1 results in the formation of true opaque cells due to the upregulation of WOR1, which we directly confirmed by immunoblotting (Fig. 1C). As expected, the a/α repressor still inhibits WOR1 expression in MTLa/α_efg1_Δ/Δ cells, thus locking cells in a white-like phase (Fig. 1A–C). Therefore, EFG1 indeed promotes the white phase by directly or indirectly repressing WOR1.
We also tested the mating ability of the MTLa/a_efg1_Δ/Δ_wor1_Δ/Δ double mutant, and found that its mating competence was as negligible as that of wild type white cells (Fig. 1D). Therefore, MTLa/a_efg1_Δ/Δ_wor1_Δ/Δ cells are functionally white and express white-specific genes. Nevertheless, they show an elongated morphology distinguishable from wild type white cells. These data demonstrate that WOR1 acts downstream of EFG1 in phase commitment, while EFG1 acts downstream of WOR1 in morphology determination.
Several histone-modifying genes modulate white–opaque switching
Although transcription factors are known to regulate white–opaque conversion, neither a rearrangement in DNA sequences nor any modification of chromatin has been associated with switching. Notably, lack of the histone deacetylase genes HDA1 and RPD3 modify frequencies of switching (Klar et al., 2001; Srikantha et al., 2001). Therefore, we decided to analyse the contribution of histone-modifying enzymes to phase transitions in a comprehensive way. We analysed the genome of the related fungal species Saccharomyces cerevisiae (http://www.yeastgenome.org) to identify open reading frames (ORFs) encoding putative histone modifiers (acetyltransferases, deacetylases, methyltransferases and dephosphorylases) either as regulatory or catalytic subunits of larger protein complexes. Out of some 90 genes, we selected only those encoding catalytic subunits, yielding a total of 23 genes (including one additional ORF: SET3). blast searches (http://www.ncbi.nlm.nih.gov/blast) against the C. albicans genome identified all potential orthologues, revealing that S. cerevisiae histone modifiers are highly conserved in C. albicans. Subsequently, we constructed homozygous deletion mutants of the listed ORFs in an MTLa/aC. albicans strain. Out of 23 candidates, we successfully created homozygous deletion strains of 18 genes. The identified ORFs, their predicted functions, the blast_E_-values and whether a deletion mutant was created are listed in Table S1.
Next, we analysed the effect of gene deletions on the frequency of white to opaque conversion using quantitative switching assays. Briefly, pure white cultures were plated on Phloxin B plates, and the frequency of opaque colonies or colonies containing at least one opaque sector was scored (as monitored by colony morphology and microscopy). Knock-out mutants showing significant alterations compared to the background strain are listed in Table 1. C. albicans genes whose deletion facilitated the formation of opaque colonies or sectors included SET1, a H3K4 methyltransferase (Roguev et al., 2001; Raman et al., 2006) required for gene silencing at telomeres and rDNA sequences in S. cerevisiae (Nislow et al., 1997); HDA1, a histone deacetylase (Carmen et al., 1996) acting as a global repressor of transcription in S. cerevisiae (Rundlett et al., 1996); HDA1 served as a control in our gene set, because its loss was previously shown to increase the frequency of opaque formation (Klar et al., 2001); and RPD31, one of the two orthologues of yeast RPD3, a histone deacetylase involved in transcriptional repression in S. cerevisiae (Rundlett et al. (1996). The genome of C. albicans harbours two potential orthologues of RPD3 designated RPD3 and RPD31 (Table S1). Interestingly, a deletion of RPD3 has similar effects on the white to opaque switching frequency (Srikantha et al., 2001). Genes whose deletion significantly decreased opaque conversion relative to wild type included: SET3, an essential component of the Set3 histone deacetylase complex involved in the suppression of meiotic genes in S. cerevisiae (Pijnappel et al., 2001); HOS2, a histone deacetylase and subunit of the Set3 complex (Pijnappel et al., 2001) required for gene activity in S. cerevisiae (Wang et al., 2002); HST2, a histone deacetylase similar to SIR2 (Landry et al., 2000) required for centromeric and rDNA silencing in S. cerevisiae (Durand-Dubief et al., 2007); and NAT4, an acetyltransferase mediating histone H4 and H2A acetylation (Song et al., 2003).
Table 1.
Histone-modifier genes modulate white–opaque switching.
| White → opaque | Opaque → white | |||
|---|---|---|---|---|
| Strain | Switch (%) | n | Switch (%) | n |
| wt (a/α) | 0 ± 0 | 1808 | – | – |
| wt (a/a) | 11.3 ± 1.9 | 1113 | 10.2 ± 1.1 | 1089 |
| _set1_Δ/Δ | 19.5 ± 4.5* | 863 | 10.0 ± 4.5 | 1886 |
| _hda1_Δ/Δ | 30.8 ± 13.2* | 2328 | 10.8 ± 5.4 | 1320 |
| _rpd31_Δ/Δ | 32.2 ± 0.7** | 1289 | 12.5 ± 1.4 | 800 |
| _set3_Δ/Δ | 1.8 ± 0.3** | 1352 | 27.6 ± 2.4**a | 743 |
| _hos2_Δ/Δ | 1.5 ± 0.2** | 1539 | 23.4 ± 2.2*a | 1495 |
| _hst2_Δ/Δ | 0.4 ± 0.4** | 1994 | 19.0 ± 14.0 | 1272 |
| _nat4_Δ/Δ | 1.4 ± 0.6** | 2006 | 34.9 ± 13.7* | 1171 |
| _hst1_Δ/Δ | 14.6 ± 4.8 | 2038 | 3.8 ± 0.4** | 1270 |
| _pho13_Δ/Δ | 10.5 ± 1.1 | 807 | 51.1 ± 7.9** | 1033 |
Furthermore, we analysed the impact of the deletions on the heritability of the opaque phase using quantitative switching assays. In these assays, opaque phase cultures were plated on Phloxin B agar, and the arising frequency of pure white colonies and colonies containing at least one white sector was scored (Table 1). Genes whose deletion increased the heritability of the opaque phase (i.e. displaying a lower frequency of conversion to white than wild type) included HST1, a histone deacetylase, a nonessential subunit of the Set3 complex (Pijnappel et al., 2001), as well as an essential subunit of the Sum1/Rfm1/Hst1 complex, which functions as a repressor of sporulation-specific genes in S. cerevisiae (Xie et al., 1999). Genes whose deletion destabilized the opaque phase (i.e. the deletion mutant showed a higher frequency of conversion to white than wild type) included PHO13, a phosphatase dephosporylating H2A in vitro (Tuleva et al., 1998) and implicated in carbohydrate metabolism in S. cerevisiae (Van Vleet et al., 2007) and NAT4 (see above).
Surprisingly, the loss of either SET3 or HOS2 led to an unexpected phenotype: the opaque colonies of the _set3_Δ/Δ and _hos2_Δ/Δ mutants displayed filamentous growth (D. Hnisz and K. Kuchler, in preparation). We assayed the opaque to white switching frequencies of these filamenting mutants, and found an increase in the conversion to the white phase when compared with wild type cultures (Table 1); however, these data should be interpreted with caution, because the filaments could not be reliably fragmented into individual colony forming units with our method (see Experimental procedures). Moreover, a lack of SET3 or HOS2 is likely to exert pleiotropic effects on both white–opaque switching and filamentation, i.e. by affecting two distinct transcriptional programmes, whose putative cross-talk would inherently impact the scoring method.
To confirm the switching data, we created a second independent set of deletion mutants of all genes showing an effect on switching and repeated the quantitative switching assays in both directions. In all cases, the independent deletion strains qualitatively reproduced all relevant phenotypes of the first deletion strains (data not shown). Furthermore, we complemented the deletions of SET3, HOS2, NAT4 and HST2 which were the key genes of our further analyses. The complemented strains displayed switching frequencies comparable to wild type (Table S8). As summarized in Fig. 2A, these results show that histone-modifying enzymes of various classes can modulate white–opaque switching in multiple ways. However, where and how histone modifiers modulate phase conversion is not yet clear.
Fig. 2.
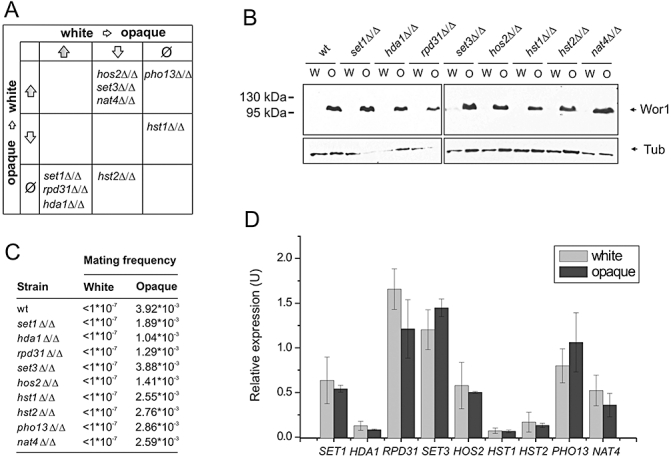
Histone modifiers act upstream of WOR1. A. Functional categories of single gene deletions on white–opaque switching. B. Immunoblot analysis demonstrates that Wor1 is expressed in a similar pattern in wild type and mutant white (W) and opaque (O) cultures. Tubulin indicates equivalent loading. C. Mating competence is differentially regulated in single mutant cells similar to wild type. Quantitative mating assays were performed with an opaque phase _MTL_α/α tester strain. At least two independent experiments per genotype were performed giving qualitatively similar results. Values are shown of one representative experiment. D. Transcript levels of histone modifiers are phase-independent. qRT-PCR was performed in triplicates and cDNA isolated from two independent cultures were analysed. Transcript levels are normalized to PAT1. Data are shown as mean ± SD.
Histone modifiers act upstream of WOR1
Previous work established that the formation of mating-competent opaque cells requires Wor1 (see above). Indeed, we were unable to detect Wor1 by immunoblotting in any of the investigated white phase single mutant cultures. By contrast, opaque phase mutant cells expressed Wor1 at levels comparable to those present in wild type opaque strains (Fig. 2B). Furthermore, white and opaque phase single deletion mutants exhibited mating competence comparable to wild type white and opaque strains respectively (Fig. 2C). These results suggest that histone modifiers act either upstream or at the level of WOR1 expression.
To address whether phase-specific expression of genes is responsible for phase changes, we performed quantitative RT-PCR to compare expression levels of switching modulators in the white and opaque phases (Fig. 2D). We failed to detect any significant differences of transcript levels between the two phases, neither in our MTLa/a background strain (Fig. 2D) nor in the independent MTLa/a clinical isolate L26 (data not shown). These results demonstrate that the activities rather then expression levels of histone modifiers modulate the outcome of the transcriptional regulatory circuit(s), which converge(s) at the master switch locus WOR1.
Epistasis of SET3, HOS2, HST2, NAT4 and EFG1 reveals multiple pathways
Interestingly, although the genes have different molecular functions, deletion of SET3, HOS2, HST2 and NAT4 all reduced the switching frequency about 5–10-fold from white to opaque (see above). Altered chromatin state can influence DNA accessibility to non-histone proteins such as the transcriptional machinery or transcription factors can recruit chromatin-modifying enzymes to facilitate their activities (Kouzarides, 2007). For instance, the C. albicans transcription factor Efg1 is a basic helix–loop–helix protein displaying DNA-binding activity in vitro has also been implicated in phase switching (Stoldt et al., 1997). To elucidate whether SET3, HOS2, HST2 or NAT4 modulate white to opaque switching in concert with EFG1, we constructed _efg1_Δ/Δ_hos2_Δ/Δ, _efg1_Δ/Δ_set3_Δ/Δ, _efg1_Δ/Δ_hst2_Δ/Δ and _efg1_Δ/Δ_nat4_Δ/Δ double mutants, and performed epistasis analysis by comparing their switching frequencies with those of the corresponding single mutants (Tables 1 and 2). The phases were verified by colony morphology, microscopy (data not shown) and quantitative mating assays (Table S5). The results were as follows: _efg1_Δ/Δ: 97.7%, _set3_Δ/Δ: 1.8%, _hos2_Δ/Δ: 1.5%, _hst2_Δ/Δ: 0.4% and _nat4_Δ/Δ: 1.4%, whereas for the double mutants: _efg1_Δ/Δ_set3_Δ/Δ: 3.0%, _efg1_Δ/Δ_hos2_Δ/Δ: 3.6%, _efg1_Δ/Δ_hst2_Δ/Δ: 87.9% and _efg1_Δ/Δ_nat4_Δ/Δ: 89.2% (Tables 1 and 2). Hence, loss of EFG1 is epistatic to the deletion of either HST2 or NAT4, whereas HOS2 or SET3 deletion qualitatively suppresses the loss of EFG1. In other words, although the repression of EFG1 on WOR1 is relieved, stable high-level expression of WOR1 still requires both SET3 and HOS2. On the other hand, HST2 and NAT4 are likely to exert their effect in a transcriptional loop converging at the WOR1 locus either at the level of EFG1 or upstream of it. Notably, the opposite switching frequencies from opaque to white showed a similar epistasis (right panel, Table 2). As a further control, we restored the SET3 and HOS2 ORFs in _efg1_Δ/Δ_set3_Δ/Δ and _efg1_Δ/Δ_hos2_Δ/Δ cells, respectively, and found that the complemented mutants showed switching frequencies comparable to the _efg1_Δ/Δ mutant (Table S8).
Table 2.
Epistasis analysis of SET3, HOS2, NAT4, HST2 and EFG1.
| White → opaque | Opaque → white | |||
|---|---|---|---|---|
| Strain | Switch (%) | n | Switch (%) | n |
| wt | 11.3 ± 1.9 | 1113 | 10.2 ± 1.1 | 1089 |
| _efg1_Δ/Δ | 97.7 ± 1.0 | 1110 | 0.6 ± 0.8 | 1576 |
| _efg1_Δ/Δ_hst2_Δ/Δ | 87.9 ± 20.1 | 940 | 1.9 ± 2.6 | 1969 |
| _efg1_Δ/Δ_nat4_Δ/Δ | 89.2 ± 10.7 | 812 | 0.3 ± 0.6 | 1568 |
| _efg1_Δ/Δ_set3_Δ/Δ | 3.0 ± 1.6 | 2685 | 12.9 ± 6.7 | 1299 |
| _efg1_Δ/Δ_hos2_Δ/Δ | 3.6 ± 1.3 | 1148 | 5.2 ± 6.3 | 1061 |
| _efg1_Δ/Δ_hst2_Δ/Δ_hos2_Δ/Δ | 5.6 ± 3.6 | 1117 | 5.5 ± 3.7 | 599 |
| _efg1_Δ/Δ_nat4_Δ/Δ_set3_Δ/Δ | 2.7 ± 1.3 | 1322 | 10.4 ± 6.9 | 906 |
To verify that HOS2 and SET3 indeed act in an independent pathway of either NAT4 or HST2, we tested the switching frequencies of _efg1_Δ/Δ_hst2_Δ/Δ_hos2_Δ/Δ and _efg1_Δ/Δ_nat4_Δ/Δ_set3_Δ/Δ triple mutants in both switching directions. As predicted, deletion of NAT4 in an _efg1_Δ/Δ_set3_Δ/Δ mutant, and deletion of HST2 in an _efg1_Δ/Δ_hos2_Δ/Δ mutant had no significant effect on switching frequencies when compared with the respective double deletion strains (Table 2). In summary, the epistasis analysis revealed at least two independent regulatory pathways affecting the transcriptional loops controlling morphogenetic switching.
Loss of SET3 or HOS2 suppresses deletion of RPD31 or HDA1
The S. cerevisiae orthologues of Hos2, Hda1 and Rpd31 are histone deacetylases catalytically active on multiple acetylated lysine residues of core histones (Pijnappel et al., 2001; Suka et al., 2001; Wu et al., 2001). Set3 is an integral subunit of the Set3/Hos2 deacetylase complex (Pijnappel et al., 2001). To address whether there is a division of labour between deacetylase complexes in the regulation of C. albicans white–opaque switching, we created a series of double deletion strains and compared their switching frequencies with those of single deletion mutants. As shown in Tables 1 and 3, deletion of SET3 is epistatic to the loss of HDA1 and RPD31, and deletion of HOS2 is epistatic to the deletion of RPD31. Phases were verified by colony morphology, microscopy (data not shown) and quantitative mating assays (Table S6). These results support the notion that Set3 and Hos2 act in a complex in C. albicans functioning as a downstream regulator of white–opaque switching.
Table 3.
Loss of SET3 or HOS2 is epistatic to the deletion of HDA1 or RPD31.
| White → opaque | Opaque → white | |||
|---|---|---|---|---|
| Strain | Switch (%) | n | Switch (%) | n |
| wt | 11.6 ± 4.5 | 560 | 21.8 ± 9.5 | 609 |
| _hda1_Δ/Δ_set3_Δ/Δ | 1.4 ± 0.8 | 1295 | NA | – |
| _rpd31_Δ/Δ_set3_Δ/Δ | 2.1 ± 0.9 | 1409 | NA | – |
| _rpd31_Δ/Δ_hos2_Δ/Δ | 0.7 ± 0.3 | 1479 | NA | – |
Loss of H3K4 methylation suppresses the effect of the deletion of SET3 or HOS2
Where and how is the Set3/Hos2 complex recruited? Inspection of the CaSet3 primary sequence revealed two characteristic domains: a SET and a PHD (Plant HomeoDomain) domain (Fig. 3A). This domain architecture is conserved among many genes implicated in epigenetic regulation, including ASH1 and Thrithorax in Drosophila (Stassen et al., 1995; Tripoulas et al., 1996). The SET domains have two functions: methyltransferase activity acting on histones (Rea et al., 2000) or other non-histone substrates, and they may serve as protein–protein interaction surfaces (Rozenblatt-Rosen et al., 1998). The PHD finger is a specialized methyl-lysine binding domain found in various proteins ‘reading’ histone marks (Shi et al., 2006). Recently, the purified PHD finger of ScSet3 was shown to preferentially bind trimethylated H3K4 (Shi et al., 2007). Notably, CaSET1 appears as the only C. albicans methyltransferase modifying H3K4, and its deletion results in a complete loss of H3K4 methylation (Raman et al., 2006).
Fig. 3.
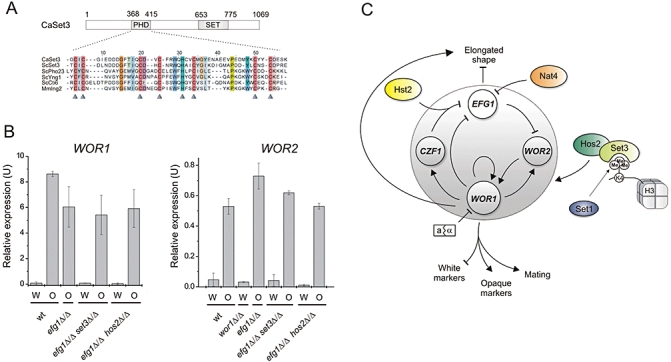
The Set3/Hos2 complex is a key regulator of white–opaque switching. A. The PHD finger of CaSET3. The amino acid sequence was aligned to the PHD fingers of ScSet3, ScPho23, ScYng1, ScCti6 and MmIng2 that were shown to bind H3K4me3 specifically in vitro (Shi et al., 2006; 2007). Colours indicate homologous residues. Arrowheads highlight the residues of the characteristic Cys4-His-Cys3 Zn2+ co-ordination motif. B. qRT-PCR analysis of WOR1 and WOR2 expression in Set3/Hos2-pathway mutants. Deletion of either SET3 or HOS2 in an _efg1_Δ/Δ background does not cause significant changes in the steady-state transcription level of either WOR1 or WOR2. The mRNA levels are normalized to PAT1. qRT-PCR reactions were performed in triplicates and cDNA isolated from two independent cultures were analysed. Data are shown as mean ± SD. C. Dual-layer model of the regulation of white–opaque switching in C. albicans. The dotted grey circle denotes the transcriptional circuit as described (Zordan et al., 2007). White and opaque enriched regulators are shown in white and grey respectively. Coloured elements represent histone-modifying pathways modulating the output of the transcriptional circuit.
To address whether the Set3/Hos2 complex requires H3K4 methylation for the regulation of white–opaque switching in C. albicans, we compared the switching frequencies of _set1_Δ/Δ_set3_Δ/Δ and _set1_Δ/Δ_hos2_Δ/Δ double mutants to those of the respective single deletion strains (Tables 1 and 4). Strikingly, the absence of SET1 almost completely suppressed the loss of SET3 or HOS2 (white to opaque switching frequencies: _set1_Δ/Δ: 19.5%, _hos2_Δ/Δ: 1.5%, _set3_Δ/Δ: 1.8%, _set1_Δ/Δ_set3_Δ/Δ 10.5%, _set1_Δ/Δ_hos2_Δ/Δ 12.8%). To verify the rescue effect, we performed an epistasis analysis of SET1 and HOS2 in a genetic background where the transcriptional feedback from EFG1 towards WOR1 is disrupted. Therefore, we compared the white to opaque switching frequencies of _efg1_Δ/Δ, _efg1_Δ/Δ_set1_Δ/Δ, _efg1_Δ/Δ_hos2_Δ/Δ and _efg1_Δ/Δ_set1_Δ/Δ_hos2_Δ/Δ mutants (Tables 1, 2 and 4). White _efg1_Δ/Δ cells converted at high frequencies to opaque (97.7%, Table 2). _efg1_Δ/Δ_set1_Δ/Δ cells almost exclusively existed in the opaque phase, as we failed to isolate single white phase colonies of this mutant. _efg1_Δ/Δ_hos2_Δ/Δ white cells converted at low frequencies to opaque cells (3.6%, Table 2). As expected, _efg1_Δ/Δ_set1_Δ/Δ_hos2_Δ/Δ white cells also readily convert to the opaque phase (80.6%, Table 4), while the opaque phase appears as stable as in _efg1_Δ/Δ and _efg1_Δ/Δ_set1_Δ/Δ opaque isolates (Tables 2 and 4). The phases were verified by colony morphology, microscopy (data not shown) and quantitative mating assays (Table S7).
Table 4.
Loss of H3K4 methylation suppresses the effects of SET3 or HOS2 deletions.
| White → opaque | Opaque → white | |||
|---|---|---|---|---|
| Strain | Switch (%) | n | Switch (%) | n |
| wt | 11.6 ± 4.5 | 560 | 21.8 ± 9.5 | 609 |
| _set1_Δ/Δ_hos2_Δ/Δ | 12.8 ± 2.7 | 1303 | NA | – |
| _set1_Δ/Δ_set3_Δ/Δ | 10.5 ± 4.4 | 1108 | NA | – |
| _efg1_Δ/Δ_set1_Δ/Δ | NA | – | 0.2 ± 0.3 | 1636 |
| _efg1_Δ/Δ_set1_Δ/Δ_hos2_Δ/Δ | 80.6 ± 7.5 | 1318 | 1.4 ± 1.5 | 1730 |
| _wor1_Δ/Δ | 0 ± 0 | 1661 | NA | – |
| _wor1_Δ/Δ_set1_Δ/Δ | 0 ± 0 | 1458 | NA | – |
| _wor1_Δ/Δ_set3_Δ/Δ | 0 ± 0 | 1734 | NA | – |
| _wor1_Δ/Δ_hos2_Δ/Δ | 0 ± 0 | 1079 | NA | – |
| _wor1_Δ/Δ_set1_Δ/Δ_hos2_Δ/Δ | 0 ± 0 | 1662 | NA | – |
As deletion of either SET3 or HOS2 was epistatic to the deletion of EFG1 in switching modulation (Table 3), we sought evidence that the newly identified Set3/Hos2 pathway indeed regulates WOR1 expression to drive phenotypic switching. As shown in Table 4, deletion of WOR1 in _set1_Δ/Δ, _set3_Δ/Δ, _hos2_Δ/Δ and _set1_Δ/Δ_hos2_Δ/Δ mutants locks cells in the white phase, supporting that the Set3/Hos2 pathway mediates regulatory input upstream or at the level of WOR1 expression. To test whether the disruption of the pathway is reflected in the steady state transcript levels of WOR1, we performed quantitative real-time PCR analysis, but found no difference in WOR1 mRNA levels between wild type, _efg1_Δ/Δ, _efg1_Δ/Δ_set3_Δ/Δ and _efg1_Δ/Δ_hos2_Δ/Δ cultures neither in the white nor in the opaque phase. It is to note that we analysed the double deletion strains, because we repeatedly failed to maintain the _set3_Δ/Δ and _hos2_Δ/Δ single deletion mutants in relatively pure opaque phase cultures, most likely because they show an elevated opaque to white switching frequency (Table 1). However, because of the epistatic relationship of SET3, HOS2 and EFG1, the input of the Set3/Hos2 pathway can be measured in an _EFG1_-deletion background, and the _efg1_Δ/Δ_set3_Δ/Δ as well as the _efg1_Δ/Δ_hos2_Δ/Δ mutants are marginally more stable in the opaque phase than the _set3_Δ/Δ and _hos2_Δ/Δ mutants (compare Tables 1 and 2). To address whether the Set3/Hos2 complex acts at other possible loci, we analysed the transcript levels of WOR2, the cofactor of WOR1, in wild type, _efg1_Δ/Δ, _efg1_Δ/Δ_set3_Δ/Δ and _efg1_Δ/Δ_hos2_Δ/Δ mutants, but again found no significant differences between wild type and the deletion mutants in either of the phases. Taken together, these results demonstrate that deletion of SET1 and loss of H3K4 methylation suppresses the deletion of SET3 or HOS2, suggesting that the Set3/Hos2 complex acts through Set1 and thus requires H3K4 methylation for switching regulation.
Adenine facilitates opaque to white switching depending on SET3
Environmental factors can modulate morphogenetic switching of C. albicans. For instance, opaque cells convert to the white phase at elevated temperatures (Rikkerink et al., 1988), whereas white cells of certain strains readily convert to the opaque phase under anaerobic conditions (Ramirez-Zavala et al., 2008). To address whether our newly identified modulators link environmental signals to white–opaque switching, we analysed switching frequencies of wild type and several single deletion strains under different conditions, including changes in temperature, CO2– and nutrient concentrations. Strikingly, we found that supplementation of the routinely used Lee's medium with 100 μg ml−1 adenine increased the conversion frequency from the opaque to the white phase. In these experiments, cells were grown on source plates for 5 days at 25°C, resuspended in water, spread onto destination plates at a low density and cultivated for another 5 days at 25°C. The effect was most pronounced if both plates contained adenine (Table 5). This regulatory effect is also supported by the observation that our wild type background strain showed elevated opaque to white switching frequencies on SD plates when compared with Lee's medium (Tables 1 and 3). Furthermore, the _set3_Δ/Δ deletion mutant displayed no alteration in opaque to white switching frequency in the presence of adenine in the medium (Table 5). These results identify adenine as a novel environmental factor regulating morphogenetic switching of C. albicans, and demonstrate that a functional Set3/Hos2 pathway is required to transmit the relevant input signal in the transcriptional circuit underlying switching.
Table 5.
Adenine stimulates opaque-white switching in wild type but not in _set3_Δ/Δ cells.
| Switch | ||||
|---|---|---|---|---|
| Strain | Source plate (adenine) | Destination plate (adenine) | % | n |
| wt opaque | − | − | 2.2 ± 0.9 | 376 |
| + | 5.8 ± 1.9 | 286 | ||
| + | − | 7.7 ± 3.7 | 290 | |
| + | + | 14.1 ± 6.6 | 260 | |
| _set3_Δ/Δ opaque | − | − | 30.2 ± 2.7 | 180 |
| + | 31.7 ± 2.5 | 202 | ||
| + | − | 31.7 ± 4.8 | 250 | |
| + | + | 32.3 ± 1.0 | 228 |
Discussion
A model of white–opaque switching in C. albicans including two regulatory layers
In this study, we used the phenomenon of white–opaque switching in C. albicans to analyse the mechanisms of heritable phenotypic variation in a eukaryotic unicellular pathogen. The white and opaque cell types of C. albicans represent different transcriptional states of cells containing otherwise identical genomes. Morphogenetic switching is thought to generate distinct cell variants with different capabilities to adapt to various host niches and/or host defences in vivo. Current models explain the regulation of switching by a transcription circuitry amplifying stochastic changes of the expression of one master transcription factor gene, WOR1. Here, we used a reverse genetic approach to decipher the role of chromatin-modifying enzymes in white–opaque switching. Based on our data, we propose a novel dual-layer network model for the regulation of morphogenetic switching in C. albicans (Fig. 3C).
Transcriptional layer of regulation
The principle architecture of the transcriptional circuit has been described earlier (Zordan et al., 2007). In MTL heterozygous cells, WOR1 is repressed by the MTLa/α repressor. In MTL homozygous white cells, Wor1 levels are low because EFG1 represses WOR2, a putative cofactor of WOR1. Once the level or activity of Wor1 reaches a threshold, cells convert to the opaque phase. Conversely, opaque cells maintain Wor1 at high levels requiring multiple positive feedback loops mediated by Wor1, including (i) autoregulation of the WOR1 locus; (ii) through the activation of WOR2; (iii) through repressing EFG1 directly and also indirectly by activating CZF1, a repressor of Efg1. In this model, EFG1 and WOR1 promote the white and opaque phases respectively (Zordan et al., 2007). However, our data demonstrate that cells lacking both EFG1 and WOR1 not only fail to express opaque-specific genes such as OP4 and SAP1, but also express the white-specific WH11 transcript like wild type white cells (Fig. 1B). Wor1 in wild type opaque cells therefore must repress certain white-specific genes such as WH11, irrespective of its function to repress EFG1. This argues that wild type white cells are in the white phase, primarily because they lack Wor1 and not because they express Efg1. Furthermore, we demonstrate that EFG1 regulates cellular morphology downstream of WOR1 (Fig. 1A), arguing that wild type opaque cells display an elongated cell morphology mainly because of Efg1 expression occurs at lower levels than in round-shaped wild type white cells (Fig. 1B), confirming a previously proposed idea (Srikantha et al., 2000).
Chromatin-level layer of regulation
In addition to transcriptional regulation, we found that several chromatin-modifying enzymes strongly modulate white–opaque switching. Notably, deletions of genes in the transcriptional circuit appear to have a more severe effect on white–opaque switching (Zordan et al., 2007). We think that even an apparently subtle twofold change in switching frequencies must require substantial changes in transcription, because the circuitry inherently ‘buffers’ small fluctuations by multiple feedback loops. The newly identified genes fall into distinct functional categories based on the direction(s) of switching they modulate. This strongly suggests that chromatin modifications modulate the activity of the underlying transcriptional network at multiple branching points. Interestingly, the phenotype of chromatin-modifier deletions in some cases correlates with phenotypes of transcription factor deletions, suggesting that they function at the same branch of the transcriptional circuit. For example, lack of HST2 specifically results in a 10-fold decrease in the white to opaque switching, but fails to impact the opaque to white switching. Moreover, loss of HST2 is suppressed by the loss of EFG1 (Tables 1 and 2), while all of these effects are phenocopied by the deletion of CZF1 (Zordan et al., 2007), indicating that HST2 impacts transcriptional regulation at the _CZF1_-branch. This input could be, for instance, exerted either at the CZF1 locus or through the _CZF1_-dependent repression of EFG1. In addition, loss of NAT4 promotes the white phase, which is suppressed by the deletion of EFG1 (Tables 1 and 2), suggesting that NAT4 influences transcriptional activity at the EFG1 locus, independent of CZF1 (Fig. 3B). The formal possibility that NAT4 modulates binding of Wor1 at the EFG1 promoter seems plausible but requires further experimental confirmation.
Likewise, as loss of either HOS2 or SET3 promotes the white phase and their deletions suppress the loss of EFG1, both HOS2 and SET3 map to a pathway operating downstream of EFG1 and upstream of WOR1, possibly at the WOR1 or WOR2 loci. Nevertheless, it may not be surprising that we did not observe differences in mRNA levels of either WOR1 or WOR2 in deletion mutants of the Set3/Hos2 pathway, because in S. cerevisiae loss of Hos2 was shown to change the transcription kinetics rather than the steady state transcript level of its target genes (Wang et al., 2002). Therefore, more direct experiments are needed to prove at which loci the Set3/Hos2 complex exerts its function to regulate white–opaque switching in C. albicans. Theoretically, the possibility that SET3 or HOS2 effects are exerted at the WOR2 locus seems more unlikely, because overexpression of WOR2 has no influence on switching rates (Zordan et al., 2007). Hence, the genetic circuitry appears relatively well buffered against fluctuations of WOR2 levels.
Set3 and Hos2 function as a complex in C. albicans
In this study, we provide four lines of genetic evidence that Set3 and Hos2 act as a complex in C. albicans. First, the phenotype of single deletions is identical; second, a loss of either HOS2 or SET3 is epistatic to the loss of EFG1; third, the loss of either HOS2 or SET3 is epistatic to the loss of RPD31; and fourth, deletion of SET1 suppresses the loss of either HOS2 or SET3. Hence, the situation in C. albicans appears similar to the Set3/Hos2 complex in S. cerevisiae, where deletion of either SET3 or HOS2 prevents assembly of a functional histone deacetylase complex in vivo (Pijnappel et al., 2001). Notably, a similar architecture is present in the mammalian HDAC3/SMRT complex, indicating a strong evolutionary conservation (Guenther et al., 2000).
Interestingly, loss of H3K4 methylation suppresses the disruption of the complex, suggesting that proper localization of Set3/Hos2 requires an interaction of the Set3 PHD finger with a methylated H3K4 residue. This notion is further supported by the finding that the purified PHD domain of ScSet3 specifically binds trimethylated H3K4 in vitro (Shi et al., 2007). In the context of our work, it is important to note that loss of SET1 failed to revert the opaque filamentation phenotype of the _hos2_Δ/Δ and _set3_Δ/Δ mutants. This strongly suggests that Set3/Hos2 localization requires H3K4 methylation only at specific loci. An alternative way to interpret the epistasis relationships of SET1, SET3 and HOS2 is that SET1 and methylation of H3K4 represses white-to-opaque switching. The Set3/Hos2 complex counteracts this repressive effect. Consequently, in _set1_Δ/Δ mutant cells lacking methylation of H3K4, Set3/Hos2 seems dispensable for establishing a normal white-to-opaque switching rate. Further biochemical assays with appropriate tools which are currently being developed will be necessary to establish detailed mechanistic relationships and the interplay of these gene products. However, we provide compelling genetic evidence that SET1, SET3 and HOS2 define a novel pathway regulating WOR1 expression and white–opaque switching in C. albicans.
Environmental control of phenotypic switching
Although white–opaque switching is a unique characteristic of C. albicans, reversible switching between distinct phenotypes has been described in a vast number of microbes, including the non-pathogenic yeast S. cerevisiae, the pathogen Cryptococcus neoformans, the protozoan parasites Trypanosoma brucei and Plasmodium falciparum, as well as many prokaryotic microbes such as Escherichia coli and Bacillus subtilis (Avery, 2006). Typically, two extreme cases of switching are considered: responsive switching occurs as a direct consequence of a change in environmental conditions, which is sensed by a dedicated apparatus; alternatively, stochastic switching occurs without an outside input mostly as a result of intrinsic transcriptional fluctuations of one or more regulatory genes (Kaern et al., 2005; Kussell and Leibler, 2005). Theoretical models support that stochastic switching of phenotypes is favourable when the environment only seldom changes. By contrast, the more fluctuating the environment is, the more beneficial it is to have a sensing apparatus enabling the cells to actively respond to changes (Kussell and Leibler, 2005).
Recent models explain white–opaque switching as a stochastic process, whereby the fluctuations of one central factor (WOR1), along with at least three other regulators (WOR2, CZF1, EFG1), are buffered by multiple feedback loops (Huang et al., 2006; Zordan et al., 2006; 2007). On the other hand, several lines of evidence in the literature and data presented here argue that white–opaque switching is likely to respond to environmental or even host stimuli. For instance, high temperature causes opaque cells to convert en masse to the white phase (Rikkerink et al., 1988). Conversely, anaerobic conditions in some strains promote the formation of opaque cells both in vitro and more significantly, in the murine gastrointestinal tract (Ramirez-Zavala et al., 2008). Most notably, the latter study also revealed that CZF1 is required for the anaerobiosis-induced white-to-opaque conversion in the strain WO-1, which interlinks environmental sensing and the genetic circuit driving white–opaque switching. The notion that the regulation of white–opaque switching is likely to have a responsive nature is further supported by numerous studies that report differences of white and opaque cells in their abilities to adapt to various host niches. It is fair to state that infectious microbes encounter many distinct local environments of varying parameters during an infection of the human host. Opaque phase C. albicans cells, for instance, are better colonizers of the skin, whereas white phase cells are more prevalent in bloodstream infections (Kvaal et al., 1999). Furthermore, opaque cells are more susceptible to killing by neutrophils than white cells (Kolotila and Diamond, 1990), whereas macrophages preferentially phagocytose white cells over opaque cells (Lohse and Johnson, 2008).
The cell-fate decision machinery may encounter many different sometimes conflicting signals, which need proper processing in order to adapt in a favourable fashion. We propose that changing the chromatin status at adequate regulatory loci is a plausible mechanism to integrate multiple environmental stimuli. Notably, although an elevated temperature and anaerobiosis favour the white and the opaque phenotype respectively, anaerobic conditions stabilize opaque cells even at elevated temperatures in vitro (Dumitru et al., 2007). Furthermore, white cells of some strains convert to the opaque phase in the murine gastrointestinal tract, whose 37°C temperature is much higher than 25°C, the normal laboratory condition used to stably propagate opaque cells (Ramirez-Zavala et al., 2008). Such a proposed relay function of chromatin is further supported by the finding that Wor1 in opaque cells can be immunoprecipitated from promoters of many genes whose expression does not change during the white–opaque switch under laboratory conditions (Zordan et al., 2007).
In this study, we identify another novel external stimulus, showing that the presence of adenine facilitates opaque to white switching in vitro, and, importantly, that SET3 is required for this regulatory effect. This finding is in very good agreement with the proposed functional consequence of the dual layer model, whereby the chromatin modifiers are involved in the integration of environmental stimuli to shape cell fate. Notably, it was recently shown that the nicotinic acid (a precursor for NAD) concentration of urine regulates the adherence properties of the related species Candida glabrata in a urinary tract infection model, and that chromatin-mediated gene silencing is linked to the process (Domergue et al., 2005). Therefore, it will be interesting in the future to test whether nucleotide or nucleotide precursor concentrations and chromatin-based regulatory mechanisms also play a role in C. albicans infection models in vivo.
The mechanism(s) driving morphogenetic switching thus may be quite simple. For instance, changes in the chromatin modification status could directly or indirectly fine-tune promoter occupancy of transcription factors by changing their affinities or modulate the assembly of the mediator complex. Alternatively, it is tantalizing to speculate that histone modifiers may even cause changes in post-translational modifications of transcription factors by modulating complex assembly.
Finally, C. albicans during its commensalistic co-evolution with the human host must have developed elaborate systems of specific and rapidly acting sensing mechanisms to allow for environmental and host signal integration. This machinery consists of two layers: a transcriptional level which co-ordinates the downstream response at the gene expression level, and a chromatin-level layer that may have a relay function at key loci integrating the stimuli affecting cellular identity. Moreover, the architecture combining specific transcription factors with chromatin modifiers is reminiscent of the cell-fate and developmental decision machineries in higher eukaryotic systems. Indeed, a differential chromatin status at key loci has been linked to lineage-committed stem cell differentiation (Mikkelsen et al., 2007). Strikingly, a selective H3K4 methylation pattern has been recently linked to lineage commitment during hematopoesis (Orford et al., 2008). These and other similarities make C. albicans an attractive alternative model system to dissect the molecular mechanisms of chromatin dynamics and enzyme recruitment to delineate developmental processes controlling cell-fate decisions and developmental changes.
Experimental procedures
Media and growth conditions
Rich medium (YPD) and complete synthetic medium (SD) was prepared as previously described (Kaiser et al., 1994). Modified Lee's medium was prepared as described (Bedell and Soll, 1979). Cultures were routinely grown at 25°C unless indicated otherwise.
Strain construction
The complete list of C. albicans strains, primers and plasmids used in this study are listed in Tables S2, S3 and S4 respectively. All strains were derived from SN152 (Noble and Johnson, 2005), a leucine, histidine, arginine auxotrophic derivative of the clinical isolate SC5314 (Gillum et al., 1984). The MTLa/α SN152 was cultured on sorbose medium (Janbon et al., 1998) to construct the MTLa/a strain DHCA202. MTL homozygosis was verified by PCR and Southern blot analyses (data not shown). Single gene deletions (SET1, SET2, HDA1, SAS2, RPD31, SET3, HOS2, HST1, SIR2, HST2, ELP3, PHO13, PHO8, DOT1, HOS1, HPA2, HOS3 and WOR1) were created by using the C.m.LEU2 and C.d.HIS1 marker cassettes as described in Noble and Johnson (2005). In addition, the same strategy utilizing the C.d.ARG4 and a SAT1 cassette (amplified from the plasmid pSFS2A) was used to delete WOR1 in the _set1_Δ/Δ, _hos2_Δ/Δ, _set3_Δ/Δ and _set1_Δ/Δ_hos2_Δ/Δ backgrounds.
Other multiple gene deletion mutants, as well as the _efg1_Δ/Δ in the DHCA202 and SC5314 backgrounds were created using the ‘_SAT1_-flipping’ method (Reuss et al., 2004). EFG1 was deleted in the _wor1_Δ/Δ, _hos2_Δ/Δ, _set3_Δ/Δ, _hst2_Δ/Δ, _nat4_Δ/Δ and _set1_Δ/Δ single deletion strains to create all possible double deletions. Likewise, SET3 and HOS2 were deleted in the single deletion strains _hda1_Δ/Δ, _rpd31_Δ/Δ, _hst2_Δ/Δ, _nat4_Δ/Δ or _set1_Δ/Δ to obtain all double mutants. Moreover, EFG1 was deleted in the _hst2_Δ/Δ_hos2_Δ/Δ, _nat4_Δ/Δ_set3_Δ/Δ and _set1_Δ/Δ_hos2_Δ/Δ double deletion backgrounds to construct the corresponding triple deletion strains. Except for single gene deletions that did not display any phenotypes (Table S2), at least two independent homozygous deletion strains were created derived from independent heterozygote isolates. Transformation was performed via electroporation as described (Reuss et al., 2004). Genomic integration events were verified with PCR and Southern blot analyses (data not shown). The mating tester strains DHCA210 (_MTL_α/α) and DHCA209 (MTLa/a) were created in the SC5314 background using the sorbose selection method. Subsequent disruption of the ADE2 gene used the ‘SAT1-flipping’ strategy (see Tables S2 and S3).
Gene complementation constructs for the HOS2, HST2 and NAT4 ORFs were created using the SAT1 marker cassette of the plasmid pSFS2A and the fusion PCR strategy (Noble and Johnson, 2005). For the restoration of the SET3 gene, the _SAT1_-flipping strategy was used with the modification that the in pSFS2A plasmid the upstream homology region was replaced by the same upstream region and the coding sequence (Tables S3 and S4). Transformation was performed via electroporation as described (Reuss et al., 2004). Genomic integration events were verified with PCR analysis.
Microscopy
Colony morphology was analysed using a Discovery V12 Stereoscope (Zeiss) equipped with an Axiocam MR5 camera (Zeiss). Microscopic analysis was performed with using an Axioplan 2 microscope (Zeiss) equipped with a Spot Pursuit camera (Sony). Images were analysed with the Axiovision 4.1 software (Zeiss).
White–opaque switching assays
Quantitative switching assays were performed as previously described (Miller and Johnson, 2002) with modifications. Briefly, white strains were streaked from frozen stocks on YPD plates and grown at 30°C for 2 days. Single colonies were then restreaked onto modified Lee's medium (Tables 1 and 2) or SD medium (Tables 3 and 4) and grown at 25°C for 5 days. Single colonies were picked and resuspended in sterile H2O, checked by microscopy and spread onto modified Lee's plates (Tables 1 and 2) or SD plates (Tables 3 and 4) containing 5 μg ml−1 Phloxin B. Formation of opaque colonies or sectors was scored after 7 days. The opaque to white switching assays were performed using pure opaque colonies obtained in the white to opaque switching assays. The frequency of white colonies or colonies containing at least one white sector was scored after 7 days. For each strain, at least three independent experiments were carried out. The data listed in Tables 1–5 were obtained using one deletion strain of the genotype. For each genotype except for the _set1_Δ/Δ_set3_Δ/Δ, _wor1_Δ/Δ_hos2_Δ/Δ and _wor1_Δ/Δ_set1_Δ/Δ_hos2_Δ/Δ mutants at least two independent homozygous deletion strains were created derived from independent heterozygous deletion strains. The analysis of independent deletion mutants showed qualitatively similar results (data not shown).
Quantitative mating assays
Quantitative mating assays were performed essentially as described (Miller and Johnson, 2002) with modifications. Pure white and opaque cultures were isolated on plates as described above. Strains were grown in liquid medium at 25°C until an OD600 1–3. A total of 3 × 10⁷ cells of each mating partner were mixed, and deposited on sterile Whatman filter paper placed onto a YPD plate supplemented with 100 μg ml−1 adenine, and incubated at 25°C for 18 h. Cells were washed off the filter, resuspended in 10 ml sterile H2O and were dispersed by vortex-mixing. Serial dilutions were plated on double-selective (–arginine –adenine) SD plates to select for the prototrophic conjugants, and on single selective (–arginine or –adenine) SD plates to score the single parent population plus conjugants. The mating frequencies were calculated as the ratio of conjugants and the limiting parent plus conjugants.
RNA isolation and quantitative RT-PCR
Cultures were grown in modified Lee's medium until OD600 1–3 and harvested by centrifugation. Pellets were washed with sterile H2O, frozen in liquid nitrogen and mechanically pulverized in a sterile porcelain mortar in the frozen state. RNA was extracted using TRI reagent (Molecular Research Center). About 1–5 μg of total RNA was reverse-transcribed with the First Strand cDNA synthesis kit (Fermentas). cDNA amplification was monitored quantitatively by SYBR Green incorporation in a Realplex Mastercycler (Eppendorf).
Immunoblotting
Cultures were grown in liquid medium until OD 1–3 and cells were harvested by centrifugation. Cell pellets were resuspended in 0.25 M NaOH and 1% β-mercaptoethanol, and incubated on ice for 10 min. Proteins were precipitated by the addition of 5.8 v/v% trichloroacetic acid for 10 min on ice, centrifuged and resuspended in SDS sample buffer. Total protein extracts derived from 0.5 OD600 of the starting cultures were separated by SDS/PAGE and analysed by Western blotting. The C-terminal anti-Wor1 antibody has been previously described (Zordan et al., 2006). Loading controls were visualized using a monoclonal anti-tubulin antibody (Sigma).
Acknowledgments
We thank all laboratory members for helpful discussions; W. Glaser for assistance with the bioinformatics and statistical analyses; N. Landstetter for helpful and critical comments on the manuscript. We are indebted to Alexander Johnson for providing fungal strains, plasmids, anti-Wor1 antibodies, helpful discussions as well as encouragement. We also thank J. Morschhäuser for critical reading of the manuscript and for the pSFS2A plasmid; S. Rupp for the strain HLC67; D.R. Soll for the strain L26. This work was supported by a grant from the Christian Doppler Society to K.K., and in part by a grant from the WWTF (Project LS133-HOPI). D.H. was supported through the Vienna Biocenter PhD Programme WK001, and T.S. in part by the EraNet Pathogenomics project FunPath (FWF-API-0125).
Supporting information
Additional supporting information may be found in the online version of this article.
Please note: Wiley-Blackwell are not responsible for the content or functionality of any supporting materials supplied by the authors. Any queries (other than missing material) should be directed to the corresponding author for the article.
References
- Avery SV. Microbial cell individuality and the underlying sources of heterogeneity. Nat Rev Microbiol. 2006;4:577–587. doi: 10.1038/nrmicro1460. [DOI] [PubMed] [Google Scholar]
- Bedell GW, Soll DR. Effects of low concentrations of zinc on the growth and dimorphism of Candida albicans: evidence for zinc-resistant and – sensitive pathways for mycelium formation. Infect Immun. 1979;26:348–354. doi: 10.1128/iai.26.1.348-354.1979. [DOI] [PMC free article] [PubMed] [Google Scholar]
- Bennett RJ, Johnson AD. Mating in Candida albicans and the search for a sexual cycle. Annu Rev Microbiol. 2005;59:233–255. doi: 10.1146/annurev.micro.59.030804.121310. [DOI] [PubMed] [Google Scholar]
- Carmen AA, Rundlett SE, Grunstein M. HDA1 and HDA3 are components of a yeast histone deacetylase (HDA) complex. J Biol Chem. 1996;271:15837–15844. doi: 10.1074/jbc.271.26.15837. [DOI] [PubMed] [Google Scholar]
- Domergue R, Castano I, De Las Penas A, Zupancic M, Lockatell V, Hebel JR, et al. Nicotinic acid limitation regulates silencing of Candida adhesins during UTI. Science. 2005;308:866–870. doi: 10.1126/science.1108640. [DOI] [PubMed] [Google Scholar]
- Dumitru R, Navarathna DH, Semighini CP, Elowsky CG, Dumitru RV, Dignard D, et al. In vivo and in vitro anaerobic mating in Candida albicans. Eukaryot Cell. 2007;6:465–472. doi: 10.1128/EC.00316-06. [DOI] [PMC free article] [PubMed] [Google Scholar]
- Durand-Dubief M, Sinha I, Fagerstrom-Billai F, Bonilla C, Wright A, Grunstein M, Ekwall K. Specific functions for the fission yeast Sirtuins Hst2 and Hst4 in gene regulation and retrotransposon silencing. EMBO J. 2007;26:2477–2488. doi: 10.1038/sj.emboj.7601690. [DOI] [PMC free article] [PubMed] [Google Scholar]
- Gillum AM, Tsay EY, Kirsch DR. Isolation of the Candida albicans gene for orotidine-5′-phosphate decarboxylase by complementation of S. cerevisiae ura3 and E. coli pyrF mutations. Mol Gen Genet. 1984;198:179–182. doi: 10.1007/BF00328721. [DOI] [PubMed] [Google Scholar]
- Guenther MG, Lane WS, Fischle W, Verdin E, Lazar MA, Shiekhattar R. A core SMRT corepressor complex containing HDAC3 and TBL1, a WD40-repeat protein linked to deafness. Genes Dev. 2000;14:1048–1057. [PMC free article] [PubMed] [Google Scholar]
- Huang G, Wang H, Chou S, Nie X, Chen J, Liu H. Bistable expression of WOR1, a master regulator of white-opaque switching in Candida albicans. Proc Natl Acad Sci USA. 2006;103:12813–12818. doi: 10.1073/pnas.0605270103. [DOI] [PMC free article] [PubMed] [Google Scholar]
- Hull CM, Johnson AD. Identification of a mating type-like locus in the asexual pathogenic yeast Candida albicans. Science. 1999;285:1271–1275. doi: 10.1126/science.285.5431.1271. [DOI] [PubMed] [Google Scholar]
- Janbon G, Sherman F, Rustchenko E. Monosomy of a specific chromosome determines 1-sorbose utilization: a novel regulatory mechanism in Candida albicans. Proc Natl Acad Sci USA. 1998;95:5150–5155. doi: 10.1073/pnas.95.9.5150. [DOI] [PMC free article] [PubMed] [Google Scholar]
- Kaern M, Elston TC, Blake WJ, Collins JJ. Stochasticity in gene expression: from theories to phenotypes. Nat Rev Genet. 2005;6:451–464. doi: 10.1038/nrg1615. [DOI] [PubMed] [Google Scholar]
- Kaiser C, Michaelis S, Mitchell A. Methods in Yeast Genetics.A Laboratory Course Manual. New York: Cold Spring Harbor Laboratory Press; 1994. [Google Scholar]
- Klar AJ, Srikantha T, Soll DR. A histone deacetylation inhibitor and mutant promote colony-type switching of the human pathogen Candida albicans. Genetics. 2001;158:919–924. doi: 10.1093/genetics/158.2.919. [DOI] [PMC free article] [PubMed] [Google Scholar]
- Kolotila MP, Diamond RD. Effects of neutrophils and in vitro oxidants on survival and phenotypic switching of Candida albicans WO-1. Infect Immun. 1990;58:1174–1179. doi: 10.1128/iai.58.5.1174-1179.1990. [DOI] [PMC free article] [PubMed] [Google Scholar]
- Kouzarides T. Chromatin modifications and their function. Cell. 2007;128:693–705. doi: 10.1016/j.cell.2007.02.005. [DOI] [PubMed] [Google Scholar]
- Kussell E, Leibler S. Phenotypic diversity, population growth, and information in fluctuating environments. Science. 2005;309:2075–2078. doi: 10.1126/science.1114383. [DOI] [PubMed] [Google Scholar]
- Kvaal C, Lachke SA, Srikantha T, Daniels K, McCoy J, Soll DR. Misexpression of the opaque-phase-specific gene PEP1 (SAP1) in the white phase of Candida albicans confers increased virulence in a mouse model of cutaneous infection. Infect Immun. 1999;67:6652–6662. doi: 10.1128/iai.67.12.6652-6662.1999. [DOI] [PMC free article] [PubMed] [Google Scholar]
- Lan CY, Newport G, Murillo LA, Jones T, Scherer S, Davis RW, Agabian N. Metabolic specialization associated with phenotypic switching in Candida albicans. Proc Natl Acad Sci USA. 2002;99:14907–14912. doi: 10.1073/pnas.232566499. [DOI] [PMC free article] [PubMed] [Google Scholar]
- Landry J, Sutton A, Tafrov ST, Heller RC, Stebbins J, Pillus L, Sternglanz R. The silencing protein Sir2 and its homologs are NAD-dependent protein deacetylases. Proc Natl Acad Sci USA. 2000;97:5807–5811. doi: 10.1073/pnas.110148297. [DOI] [PMC free article] [PubMed] [Google Scholar]
- Lohse MB, Johnson AD. Differential phagocytosis of white versus opaque Candida albicans by Drosophila and mouse phagocytes. PLoS ONE. 2008;3:e1473. doi: 10.1371/journal.pone.0001473. [DOI] [PMC free article] [PubMed] [Google Scholar]
- Mikkelsen TS, Ku M, Jaffe DB, Issac B, Lieberman E, Giannoukos G, et al. Genome-wide maps of chromatin state in pluripotent and lineage-committed cells. Nature. 2007;448:553–560. doi: 10.1038/nature06008. [DOI] [PMC free article] [PubMed] [Google Scholar]
- Miller MG, Johnson AD. White-opaque switching in Candida albicans is controlled by mating-type locus homeodomain proteins and allows efficient mating. Cell. 2002;110:293–302. doi: 10.1016/s0092-8674(02)00837-1. [DOI] [PubMed] [Google Scholar]
- Morrow B, Srikantha T, Soll DR. Transcription of the gene for a pepsinogen, PEP1, is regulated by white-opaque switching in Candida albicans. Mol Cell Biol. 1992;12:2997–3005. doi: 10.1128/mcb.12.7.2997. [DOI] [PMC free article] [PubMed] [Google Scholar]
- Morrow B, Srikantha T, Anderson J, Soll DR. Coordinate regulation of two opaque-phase-specific genes during white-opaque switching in Candida albicans. Infect Immun. 1993;61:1823–1828. doi: 10.1128/iai.61.5.1823-1828.1993. [DOI] [PMC free article] [PubMed] [Google Scholar]
- Nislow C, Ray E, Pillus L. SET1, a yeast member of the trithorax family, functions in transcriptional silencing and diverse cellular processes. Mol Biol Cell. 1997;8:2421–2436. doi: 10.1091/mbc.8.12.2421. [DOI] [PMC free article] [PubMed] [Google Scholar]
- Noble SM, Johnson AD. Strains and strategies for large-scale gene deletion studies of the diploid human fungal pathogen Candida albicans. Eukaryot Cell. 2005;4:298–309. doi: 10.1128/EC.4.2.298-309.2005. [DOI] [PMC free article] [PubMed] [Google Scholar]
- Orford K, Kharchenko P, Lai W, Dao MC, Worhunsky DJ, Ferro A, et al. Differential H3K4 methylation identifies developmentally poised hematopoietic genes. Dev Cell. 2008;14:798–809. doi: 10.1016/j.devcel.2008.04.002. [DOI] [PMC free article] [PubMed] [Google Scholar]
- Pijnappel WW, Schaft D, Roguev A, Shevchenko A, Tekotte H, Wilm M, et al. The S. cerevisiae SET3 complex includes two histone deacetylases, Hos2 and Hst1, and is a meiotic-specific repressor of the sporulation gene program. Genes Dev. 2001;15:2991–3004. doi: 10.1101/gad.207401. [DOI] [PMC free article] [PubMed] [Google Scholar]
- Raman SB, Nguyen MH, Zhang Z, Cheng S, Jia HY, Weisner N, et al. Candida albicans SET1 encodes a histone 3 lysine 4 methyltransferase that contributes to the pathogenesis of invasive candidiasis. Mol Microbiol. 2006;60:697–709. doi: 10.1111/j.1365-2958.2006.05121.x. [DOI] [PubMed] [Google Scholar]
- Ramirez-Zavala B, Reuss O, Park YN, Ohlsen K, Morschhauser J. Environmental induction of white-opaque switching in Candida albicans. PLoS Pathog. 2008;4:e1000089. doi: 10.1371/journal.ppat.1000089. [DOI] [PMC free article] [PubMed] [Google Scholar]
- Rea S, Eisenhaber F, O'Carroll D, Strahl BD, Sun ZW, Schmid M, et al. Regulation of chromatin structure by site-specific histone H3 methyltransferases. Nature. 2000;406:593–599. doi: 10.1038/35020506. [DOI] [PubMed] [Google Scholar]
- Reuss O, Vik A, Kolter R, Morschhauser J. The SAT1 flipper, an optimized tool for gene disruption in Candida albicans. Gene. 2004;341:119–127. doi: 10.1016/j.gene.2004.06.021. [DOI] [PubMed] [Google Scholar]
- Rikkerink EH, Magee BB, Magee PT. Opaque-white phenotype transition: a programmed morphological transition in Candida albicans. J Bacteriol. 1988;170:895–899. doi: 10.1128/jb.170.2.895-899.1988. [DOI] [PMC free article] [PubMed] [Google Scholar]
- Roguev A, Schaft D, Shevchenko A, Pijnappel WW, Wilm M, Aasland R, Stewart AF. The Saccharomyces cerevisiae Set1 complex includes an Ash2 homologue and methylates histone 3 lysine 4. EMBO J. 2001;20:7137–7148. doi: 10.1093/emboj/20.24.7137. [DOI] [PMC free article] [PubMed] [Google Scholar]
- Rozenblatt-Rosen O, Rozovskaia T, Burakov D, Sedkov Y, Tillib S, Blechman J, et al. The C-terminal SET domains of ALL-1 and TRITHORAX interact with the INI1 and SNR1 proteins, components of the SWI/SNF complex. Proc Natl Acad Sci USA. 1998;95:4152–4157. doi: 10.1073/pnas.95.8.4152. [DOI] [PMC free article] [PubMed] [Google Scholar]
- Rundlett SE, Carmen AA, Kobayashi R, Bavykin S, Turner BM, Grunstein M. HDA1 and RPD3 are members of distinct yeast histone deacetylase complexes that regulate silencing and transcription. Proc Natl Acad Sci USA. 1996;93:14503–14508. doi: 10.1073/pnas.93.25.14503. [DOI] [PMC free article] [PubMed] [Google Scholar]
- Shi X, Hong T, Walter KL, Ewalt M, Michishita E, Hung T, et al. ING2 PHD domain links histone H3 lysine 4 methylation to active gene repression. Nature. 2006;442:96–99. doi: 10.1038/nature04835. [DOI] [PMC free article] [PubMed] [Google Scholar]
- Shi X, Kachirskaia I, Walter KL, Kuo JH, Lake A, Davrazou F, et al. Proteome-wide analysis in Saccharomyces cerevisiae identifies several PHD fingers as novel direct and selective binding modules of histone H3 methylated at either lysine 4 or lysine 36. J Biol Chem. 2007;282:2450–2455. doi: 10.1074/jbc.C600286200. [DOI] [PMC free article] [PubMed] [Google Scholar]
- Slutsky B, Staebell M, Anderson J, Risen L, Pfaller M, Soll DR. ‘White-opaque transition’: a second high-frequency switching system in Candida albicans. J Bacteriol. 1987;169:189–197. doi: 10.1128/jb.169.1.189-197.1987. [DOI] [PMC free article] [PubMed] [Google Scholar]
- Song OK, Wang X, Waterborg JH, Sternglanz R. An Nalpha-acetyltransferase responsible for acetylation of the N-terminal residues of histones H4 and H2A. J Biol Chem. 2003;278:38109–38112. doi: 10.1074/jbc.C300355200. [DOI] [PubMed] [Google Scholar]
- Sonneborn A, Tebarth B, Ernst JF. Control of white-opaque phenotypic switching in Candida albicans by the Efg1p morphogenetic regulator. Infect Immun. 1999;67:4655–4660. doi: 10.1128/iai.67.9.4655-4660.1999. [DOI] [PMC free article] [PubMed] [Google Scholar]
- Srikantha T, Soll DR. A white-specific gene in the white-opaque switching system of Candida albicans. Gene. 1993;131:53–60. doi: 10.1016/0378-1119(93)90668-s. [DOI] [PubMed] [Google Scholar]
- Srikantha T, Tsai LK, Daniels K, Soll DR. EFG1 null mutants of Candida albicans switch but cannot express the complete phenotype of white-phase budding cells. J Bacteriol. 2000;182:1580–1591. doi: 10.1128/jb.182.6.1580-1591.2000. [DOI] [PMC free article] [PubMed] [Google Scholar]
- Srikantha T, Tsai L, Daniels K, Klar AJ, Soll DR. The histone deacetylase genes HDA1 and RPD3 play distinct roles in regulation of high-frequency phenotypic switching in Candida albicans. J Bacteriol. 2001;183:4614–4625. doi: 10.1128/JB.183.15.4614-4625.2001. [DOI] [PMC free article] [PubMed] [Google Scholar]
- Srikantha T, Borneman AR, Daniels KJ, Pujol C, Wu W, Seringhaus MR, et al. TOS9 regulates white-opaque switching in Candida albicans. Eukaryot Cell. 2006;5:1674–1687. doi: 10.1128/EC.00252-06. [DOI] [PMC free article] [PubMed] [Google Scholar]
- Stassen MJ, Bailey D, Nelson S, Chinwalla V, Harte PJ. The Drosophila trithorax proteins contain a novel variant of the nuclear receptor type DNA binding domain and an ancient conserved motif found in other chromosomal proteins. Mech Dev. 1995;52:209–223. doi: 10.1016/0925-4773(95)00402-m. [DOI] [PubMed] [Google Scholar]
- Stoldt VR, Sonneborn A, Leuker CE, Ernst JF. Efg1p, an essential regulator of morphogenesis of the human pathogen Candida albicans, is a member of a conserved class of bHLH proteins regulating morphogenetic processes in fungi. EMBO J. 1997;16:1982–1991. doi: 10.1093/emboj/16.8.1982. [DOI] [PMC free article] [PubMed] [Google Scholar]
- Suka N, Suka Y, Carmen AA, Wu J, Grunstein M. Highly specific antibodies determine histone acetylation site usage in yeast heterochromatin and euchromatin. Mol Cell. 2001;8:473–479. doi: 10.1016/s1097-2765(01)00301-x. [DOI] [PubMed] [Google Scholar]
- Tripoulas N, LaJeunesse D, Gildea J, Shearn A. The Drosophila Ash1 gene product, which is localized at specific sites on polytene chromosomes, contains a SET domain and a PHD finger. Genetics. 1996;143:913–928. doi: 10.1093/genetics/143.2.913. [DOI] [PMC free article] [PubMed] [Google Scholar]
- Tuleva B, Vasileva-Tonkova E, Galabova D. A specific alkaline phosphatase from Saccharomyces cerevisiae with protein phosphatase activity. FEMS Microbiol Lett. 1998;161:139–144. doi: 10.1111/j.1574-6968.1998.tb12940.x. [DOI] [PubMed] [Google Scholar]
- Van Vleet JH, Jeffries TW, Olsson L. Deleting the para-nitrophenyl phosphatase (pNPPase), PHO13, in recombinant Saccharomyces cerevisiae improves growth and ethanol production on d-xylose. Metab Eng. 2007;10:360–369. doi: 10.1016/j.ymben.2007.12.002. [DOI] [PubMed] [Google Scholar]
- Wang A, Kurdistani SK, Grunstein M. Requirement of Hos2 histone deacetylase for gene activity in yeast. Science. 2002;298:1412–1414. doi: 10.1126/science.1077790. [DOI] [PubMed] [Google Scholar]
- Whiteway M, Bachewich C. Morphogenesis in Candida albicans. Annu Rev Microbiol. 2007;61:529–553. doi: 10.1146/annurev.micro.61.080706.093341. [DOI] [PMC free article] [PubMed] [Google Scholar]
- Wu J, Suka N, Carlson M, Grunstein M. Tup1 utilizes histone H3/H2B-specific Hda1 deacetylase to repress gene activity in yeast. Mol Cell. 2001;7:117–126. doi: 10.1016/s1097-2765(01)00160-5. [DOI] [PubMed] [Google Scholar]
- Xie J, Pierce M, Gailus-Durner V, Wagner M, Winter E, Vershon AK. Sum1 and Hst1 repress middle sporulation-specific gene expression during mitosis in Saccharomyces cerevisiae. EMBO J. 1999;18:6448–6454. doi: 10.1093/emboj/18.22.6448. [DOI] [PMC free article] [PubMed] [Google Scholar]
- Zordan RE, Galgoczy DJ, Johnson AD. Epigenetic properties of white-opaque switching in Candida albicans are based on a self-sustaining transcriptional feedback loop. Proc Natl Acad Sci USA. 2006;103:12807–12812. doi: 10.1073/pnas.0605138103. [DOI] [PMC free article] [PubMed] [Google Scholar]
- Zordan RE, Miller MG, Galgoczy DJ, Tuch BB, Johnson AD. Interlocking transcriptional feedback loops control white-opaque switching in Candida albicans. PLoS Biol. 2007;5:e256. doi: 10.1371/journal.pbio.0050256. [DOI] [PMC free article] [PubMed] [Google Scholar]
Associated Data
This section collects any data citations, data availability statements, or supplementary materials included in this article.