Activation and Coagulation Biomarkers are Independent Predictors for the Development of Opportunistic Disease in Patients with HIV Infection (original) (raw)
. Author manuscript; available in PMC: 2010 Jun 28.
Published in final edited form as: J Infect Dis. 2009 Sep 15;200(6):973–983. doi: 10.1086/605447
Abstract
Background
Activation and coagulation biomarkers were measured within the SMART trial. Their associations with opportunistic disease (OD) in HIV-positive patients were examined.
Methods
Inflammatory (high-sensitivity C-reactive protein [hsCRP], interleukin-6 [IL-6], amyloid-A, and amyloid-P) and coagulation (D-dimer and prothrombin-fragment 1+2) markers were determined. Conditional logistic regression analyses were used to assess associations between these biomarkers and risk of OD.
Results
The 91 patients who developed an OD were matched to 182 controls. Patients with hsCRP≥5 μg/mL at baseline had a 3.5 (95%CI: 1.5-8.1) higher odds of OD versus those with hsCRP<1 μg/ml, Ptrend=0.003, and patients with IL-6≥3 pg/mL at baseline had a 2.4 (95%CI: 1.0-5.4) higher odds of OD versus those with IL-6<1.5 pg/mL, Ptrend=0.02. No other baseline biomarkers predicted development of an OD. Latest hsCRP (OR: 7.6 (95%CI: 2.0-28.5) for those with hsCRP≥5 μg/mL versus hsCRP<1 μg/mL, Ptrend=0.002), latest amyloid-A (OR: 3.8 (95%CI: 1.1-13.4) for those with amyloid-A ≥6 mg/L versus amyloid-A <2 mg/L, Ptrend=0.03) and latest IL-6 (OR 2.4 (95%CI: 0.7-8.8) for those with IL-6≥3 pg/mL versus IL-6<1.5 pg/mL, Ptrend=0.04) were also associated with developing an OD.
Conclusions
Higher IL-6 and hsCRP independently predicted development of OD. These biomarkers could provide additional prognostic information for predicting risk of OD.
Keywords: HIV-infection, opportunistic disease, IL-6, hsCRP, inflammation, coagulation, biomarkers
Introduction
The SMART trial (Strategies for Management of Antiretroviral Therapy) was designed to examine the effects of intermittent treatment in HIV-positive patients compared to continuous antiretroviral therapy (ARV). Those randomised to the intermittent arm had a 2.6-fold (95% confidence interval [CI]: 1.9 to 3.7) increased odds of opportunistic disease (OD) or death compared to those in the continuous arm [1]. A nested case-control study within SMART found that baseline elevations of D-dimer and interleukin-6 (IL-6) identified HIV-infected patients at overall increased risk of death, and that increases in biomarkers were greater for those on intermittent therapy compared to those on continuous therapy [2]. However, only 8% of deaths in SMART were due to OD so it is not clear if elevations of biomarkers can also identify patients at risk for development of OD.
Persistent activation of inflammatory markers appears to have long-term pathological consequences and has been implicated in the pathogenesis of atherosclerotic disease and development of neoplasia [3-6]. Cytokine activation is also an independent risk factor for death in other immunosuppressed patient groups such as those with end stage renal disease [7,8]. Observational studies have demonstrated that HIV-infected patients have higher inflammatory markers (i.e. C-reactive protein, CRP) and cytokines (IL-6) when compared to non HIV-infected patients and levels of inflammatory markers increase in advanced disease and are predictive of poorer outcome [9-14]. High-sensitivity CRP (hsCRP) is an acute phase protein that increases during acute and chronic inflammatory disorders and has been shown to predict survival in HIV-infected patients [13]. Serum amyloid A production is largely regulated by inflammatory cytokines and possibly plays a role in carcinogenesis although the exact mechanism is poorly understood. [15]
The relationship between elevated levels of biomarkers and HIV is still unclear, in particular whether elevations in biomarkers such as hsCRP and IL-6 can identify patients at risk of OD.
This nested case-control design within the SMART trial is the first study to examine associations between markers of inflammation and the development of an OD (focussing on the first OD that occurred whilst under follow-up), both in virally suppressed patients receiving continuous ART and in those receiving interrupted ART as dictated by their immunologic status. We hypothesised that elevations in levels of biomarkers could be used to identify patients at particular risk of development of an OD in the clinical setting.
Methods
The methods and results of SMART have been published elsewhere [1]. In summary, 5472 patients with CD4+ counts >350 cells/mm3 were enrolled from 318 sites in 33 countries. Patients were randomised to one of two ARV treatment arms; the viral suppression (VS) arm involved continuous use of ARV while the drug conservation arm (DC) involved CD4+ guided interruptions of therapy when CD4+ counts were >350 cells/mm3 and re-initiation of therapy when CD4+ counts were <250 cells/mm3. Enrolment was discontinued on January 11, 2006 following the recommendation of the study's independent data and safety monitoring board (DSMB) because of an observed increased risk of OD and death in the DC arm compared to the VS arm. ARV-experienced patients in the DC arm were subsequently recommended to re-initiate ART.
The primary endpoint in SMART was the development of new or recurrent OD or death, where clinical events were classified as OD based on the revised case definition for AIDS by the Centers for Disease Control and Prevention [1]. In SMART it was recommended that all OD events should be reported. Using pre-established criteria a multidisciplinary Endpoint Review Committee (ERC), who were blinded to the treatment arm of each individual, determined and adjudicated reported HIV progression events including the first documented OD events included in this analysis. All OD endpoints were classed as probable or confirmed against set criteria by the ERC for 17 events such as lymphoma or cryptosporidiosis where there is only a confirmed category and no probable category applied. [16]
Overall, 1361 of 1415 (96.2%) patients from US sites gave informed consent to have plasma stored at baseline and at every follow-up visit thereafter. Of the other 4057 patients, 3800 also consented to having blood stored, giving a total of 5161 patients with blood samples. The non-US based patients had plasma stored at 4 or 12 month intervals rather than at every follow-up visit.
The following biomarkers, which all have high laboratory reproducibility, were measured by the Laboratory for Clinical Biochemistry Research at the University of Vermont; hsCRP, amyloid A, amyloid P, IL-6, D-dimer and prothrombin fragment 1+2.
All the necessary institutional/ethical review board approvals were obtained. The study was approved by the institutional review board at each site, and written informed consent was obtained from all participants. The ClinicalTrials.gov identifier is: NCT00027352 and the EudraCT number is: 2004-000441-38.
Statistical methods
Baseline and follow-up samples prior to January 11 2006 were identified for 273 patients: 91 patients who developed an OD and two matched controls per case (i.e. 182 patients). Matching was done on gender, age (+/- 5 years), date of randomisation (+/- 3 months) and country. Patients from the VS and DC arms of SMART were combined for these analyses, although comparisons were also made between treatment arms.
Follow-up samples (i.e. latest levels) were selected from the visit before the OD for cases and at the same time-point for the matched controls.
Baseline characteristics were compared between cases and controls using conditional logistic regression analysis for matched case-control studies. Patients were categorised into three groups according to the level of their biomarker at baseline (i.e. separated according to clinically relevant cut-offs or split according to the nearest round value to the tertile), and the relationship between these groups and development of an OD were examined using conditional logistic regression analyses. Separate multivariable models were created for each biomarker, where all models were adjusted for baseline characteristics that were associated with developing an OD in unadjusted analysis. All reported p-values are two-sided using a level of significance of 0.05.
The possibility of an interaction between treatment arm and both baseline and latest biomarker levels with the development of an OD was assessed.
Statistical analyses were performed using STATA (StataCorp. 2001. Stata Statistical Software: Version 10.0, College Station, Texas, USA). All reported p-values are 2-sided.
Results
The first ODs that occurred in patients who experienced an OD were predominantly infective; 72 (79.1%) individuals experienced an infective OD, 12 (13.2%) patients developed a malignant OD and the remaining 7 (7.7%) had either HIV related encephalopathy or wasting syndrome. Of the ODs, 10 (11%) were diagnosed in months 0-3, 5 (5.5%) were diagnosed between 3-6 months and the remaining 76 (83.5%) were diagnosed >6 months after trial entry.
Of the 91 patients who developed an OD, 72 (79%) were in the DC arm. Breakdown of individual ODs was as follows: oesophageal candidiasis (n=31, 34.1%), bacterial pneumonia (n=9, 13%), Pneumocystis jirovecii pneumonia (n=9, 9.9%), herpes simplex (8, 8.8%), Kaposis sarcoma (8, 8.8%), herpes zoster (6, 6.6%), lymphoma (4, 4.4%), wasting syndrome (4, 4.4%), tuberculosis (4, 4.4%), candidiasis of bronchi (2, 2.2%) and one case each of HIV encephalopathy, cryptococcosis, CMV disease and toxoplasmosis. There was a non significant difference in TB diagnosis between treatment arms (10.5% for the VS arm vs. 2.8% for the DC arm, p=0.14). Of the 91 patients who developed an OD in this study, 13 (14.3%) subsequently died although it is not clear if that was directly due to the OD.
Table 1 shows baseline characteristics for cases and controls. The odds of developing an OD were 3.8 times greater for those randomised to the DC arm compared to those randomised to the VS arm (95% CI: 2.1 to 6.9, P<0.0001). Having a previous AIDS defining diagnosis was significantly associated with subsequent development of OD (Odds ratio (OR): 3.1, 95% CI: 1.6 to 5.9, P<0.0001) as was age at baseline (OR: 1.7, 95% CI: 1.0 to 2.9 for every five years older, P=0.04). Gender, race/ethnicity, ARV history, baseline CD4+ and plasma HIV-1 RNA levels, as well as CD4+ cell count nadir were not significantly associated with developing an OD.
Table 1. Baseline characteristics for cases of fatal and non fatal OD and controls.
| Cases (N =91) | Controls (N = 182) | P-value* | |
|---|---|---|---|
| Treatment group | |||
| Viral suppression arm; N (%) | 19 (20.9%) | 94 (51.7%) | <0.0001 |
| Demographics | |||
| Age (median, IQR) | 46 (40, 53) | 45 (39, 53) | 0.04 |
| Gender; N (% female) | 27 (29.7%) | 54 (29.7%) | 0.99 |
| Race: | 0.64 | ||
| Black; N (%) | 31 (34.1%) | 67 (36.8%) | |
| White; N (%) | 49 (53.8%) | 88 (48.4%) | |
| Other; N (%) | 11 (12.1%) | 27 (14.8%) | |
| CD4+ (cells/mm3) (median, IQR) | 600 (465, 780) | 575 (486, 769) | 0.77 |
| CD4+ nadir (cells/mm3) (median, IQR) | 225 (136, 364) | 247 (137, 353) | 0.58 |
| Log10 HIV-RNA (copies/mL) (median, IQR) | 2.60 (1.70, 3.77) | 2.60 (1.70, 3.45) | 0.06 |
| No ARV at baseline; N (%) | 23 (25.3%) | 39 (21.4%) | 0.31 |
| On ARV & HIV-RNA ≤ 400 cps/mL; N (%) | 47 (51.6%) | 111 (61.0%) | |
| On ARV & HIV-RNA > 400 cps/mL; N (%) | 21 (23.1%) | 32 (17.6%) | |
| Prior AIDS; N (% Yes) | 36 (39.6%) | 38 (20.9%) | <0.001 |
| BMI (median, IQR) | 25.3 (22.0, 28.3) | 25.5 (23.0, 28.7) | 0.81 |
| ARV History | |||
| ARV naïve; N (%) | 4 (4.4%) | 10 (5.5%) | 0.70 |
| PI experienced; N (%) | 71 (78.0%) | 121 (66.5%) | 0.05 |
| NNRTI experienced; N (%) | 62 (68.1%) | 116 (63.7%) | 0.46 |
| ARV at Baseline (% of those on ARV) | |||
| PI-containing regimen; N (%) | 37 (54.4%) | 59 (41.3%) | 0.05 |
| NNRTI-containing regimen; N (%) | 35 (51.5%) | 68 (47.6%) | 0.83 |
| PI+NNRTI-containing regimen; N (%) | 11 (16.2%) | 7 (4.9%) | 0.09 |
| Biomarkers (median, IQR) | |||
| hsCRP (μg/mL) | 2.69 (1.14, 7.09) | 1.97 (0.77, 4.52) | 0.03** |
| Amyloid A (mg/L) | 3.57 (2.39, 8.00) | 3.31 (1.80, 5.55) | 0.07** |
| Amyloid P (μg/mL) | 64.7 (53.2, 74.9) | 62.7 (50.2, 82.3) | 0.67** |
| IL-6 (pg/mL) | 2.97 (1.71, 4.01) | 2.03 (1.38, 3.64) | 0.03** |
| D-dimer(μg/mL) | 0.34 (0.22, 0.76) | 0.31 (0.17, 0.53) | 0.13** |
| Prothrombin fragment 1+2 (F1.2) (pmol/L) | 328 (266, 486) | 326 (244, 509) | 0.94** |
In Figure 1A we grouped patients according to baseline levels of each biomarker and assessed OD development within each of the groups. The median time between the measurement of the baseline biomarker and the OD for patients who had an OD was comparable to the time between the measurement of the baseline biomarker of the control and the time that their matched case developed an OD (473 days (IQR: 237 to 803 days) and 472 days (IQR: 256 to 776 days), respectively).
Figure 1.
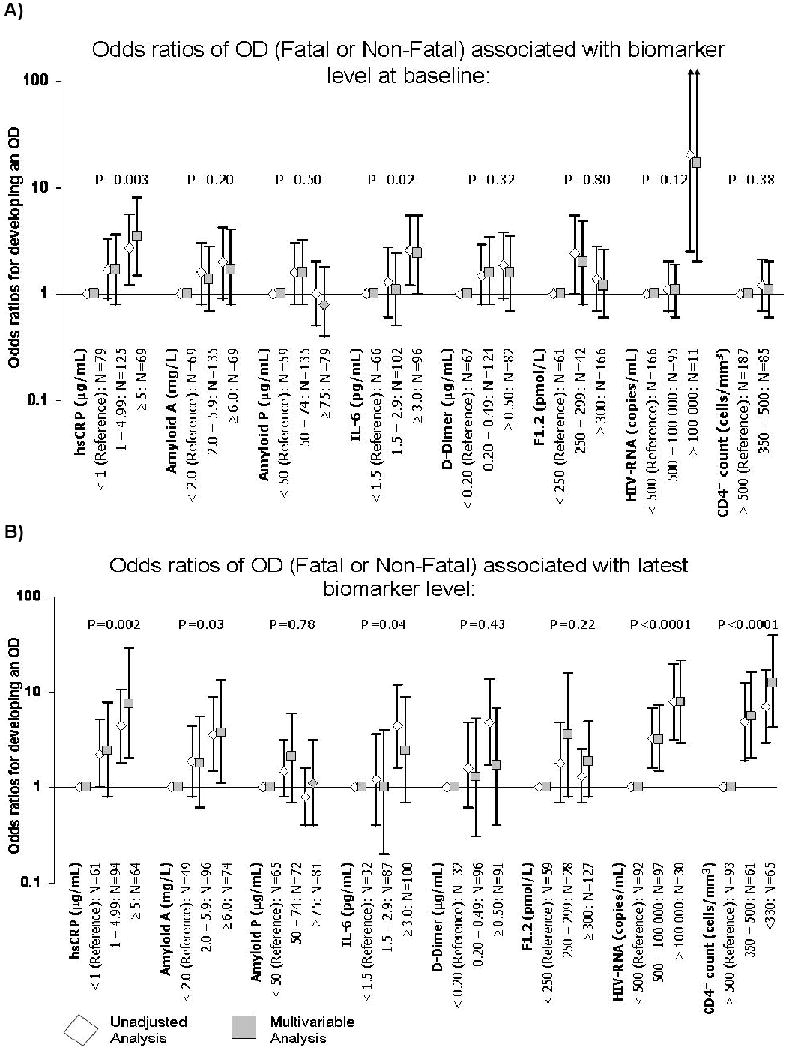
- P-values are derived from a test for trend in the multivariable analysis (i.e. they evaluate the impact of moving from the reference group to the intermediate group to the group containing the highest level of each biomarker)
- Multivariable models are adjusted for: in A) baseline CD4+ counts and HIV-RNA levels, age and prior AIDS; in B) latest and baseline CD4+ counts and HIV-RNA levels, age and prior AIDS
- Multivariable analyses for CD4+ and HIV-RNA are only adjusted for age and prior AIDS
In a multivariable analysis, after adjustment for baseline CD4+ count, baseline HIV-RNA levels, age and prior AIDS, both IL-6 and hsCRP demonstrated a significant trend towards an increased risk of developing an OD with increasing levels of the biomarkers at baseline. Patients with hsCRP levels ≥5 μg/mL had a 3.5 (95% CI: 1.5 to 8.0) higher odds of an OD compared to patients with hsCRP levels <1 μg/mL, test for trend p-value=0.003. In addition, patients with an IL-6 ≥3 pg/mL had a 2.4 (95% CI: 1.0 to 5.4) higher odds of an OD compared to patients with an IL-6 <1.5 pg/mL, test for trend p-value=0.02. There was no association between levels of amyloid A and P, D-dimer and prothrombin fragment 1+2 with the odds of developing an OD.
We then examined the latest value of each biomarker before the development of the OD (for controls this is latest value of the biomarker before their corresponding case developed the OD) (Table 2). There were 75 cases and 144 controls with biomarker levels recorded prior to the OD who could be included in these comparisons. The median time between the measurement of the follow-up biomarker and the OD was 73 days (IQR: 39 to 126 days) for patients who had an OD and 90 days (IQR: 33 to 161 days) for controls (i.e. time between measurement of follow-up biomarker and time that their matched case developed an OD).
Table 2. Latest level of biomarker prior to the event (or at matched time point for controls).
| Median (IQR) | Unadjusted analysis | Multivariable analysis | ||||||
|---|---|---|---|---|---|---|---|---|
| Cases (N =75) | Controls (N = 144) | Odds ratio | 95% CI | P-value | Odds ratio | 95% CI | P-value | |
| Latest Value | ||||||||
| Biomarkers | ||||||||
| hsCRP (μg/mL) | 3.63 (1.77, 10.30) | 1.98 (0.64, 4.08) | 1.06 | 1.02 to 1.10 | 0.004 | 1.11+ | 1.04 to 1.19 | 0.003 |
| Amyloid A (mg/L) | 5.50 (2.69, 10.10) | 3.44 (1.81, 6.50) | 1.01 | 1.00 to 1.02 | 0.10 | 1.02+ | 1.00 to 1.04 | 0.06 |
| Amyloid P (μg/mL) | 61.1 (46.3, 82.7) | 67.3 (47.8, 91.9) | 0.97 | 0.88 to 1.06 | 0.49 | 0.97+ | 0.86 to 1.09 | 0.62 |
| IL-6 (pg/mL) | 4.29 (2.61, 6.89) | 2.41 (1.63, 3.75) | 1.22 | 1.10 to 1.34 | <0.0001 | 1.23+ | 1.08 to 1.41 | 0.002 |
| D-dimer (μg/mL) | 0.59 (0.31, 1.01) | 0.35 (0.22, 0.65) | 2.90 | 1.55 to 5.40 | 0.001 | 1.89+ | 0.83 to 4.31 | 0.13 |
| F1.2 (pmol/L) | 371.7 (259.3, 501.6) | 333.3 (236.4, 533.3) | 1.00 | 0.96 to 1.04 | 0.88 | 1.00+ | 0.96 to 1.06 | 0.87 |
| CD4+ count (cells/mm3) | 350 (248, 490) | 512 (368, 703) | 0.67* | 0.56 to 0.80* | <0.0001 | 0.59 | 0.45 to 0.79 | <0.0001 |
| Log10 (copies/mL) HIV-RNA | 4.51 (2.85, 5.00) | 2.61 (1.79, 4.16) | 1.80 | 1.41 to 2.31 | <0.0001 | 1.48 | 1.09 to 2.00 | 0.01 |
Figure 1B shows patients categorised into groups for each biomarker, using the same cutoffs that were used for the baseline biomarker levels. There was a 1.5 fold (95% CI: 1.1 to 2.0, p=0.01) higher odds of developing an OD for every log10 copies/ml higher latest HIV-RNA level and a 0.6 fold (95% CI: 0.5 to 0.8, p<0.0001) lower odds of developing an OD for every 100 cells/mm3 higher latest CD4+ count. After adjustment for the latest CD4+ counts and HIV-RNA levels at the time of the OD in addition to baseline factors, all biomarkers demonstrated a trend towards an increased risk of OD with elevated levels of the biomarkers. Patients with hsCRP levels ≥5 μg/mL had a 7.6 (95% CI: 2.0 to 28.5) higher odds of an OD compared to patients with hsCRP levels <1 μg/mL, test for trend p-value=0.002; patients with an amyloid A ≥6 mg/L had a 3.8 (95% CI: 1.1 to 13.4) higher odds of an OD compared to patients with an amyloid A <2 mg/L, test for trend p-value=0.03; and patients with an IL-6 ≥3 pg/mL had a 2.4 (95% CI: 0.7 to 8.8) higher odds of an OD compared to patients with an IL-6 <1.5 pg/mL, test for trend p-value=0.04.
When baseline biomarker levels were incorporated in the models as well as latest biomarker levels, only baseline and latest IL-6 levels remained predictive of an OD, implying that baseline IL-6 still provides some information in addition to the latest IL-6 level. For hsCRP only the latest level remained predictive of an OD (data not shown).
Finally, we assessed whether the prognostic importance of elevated levels of hsCRP and IL-6 prior to the OD was also affecting and potentially contributing to the differences in risk of developing an OD in the DC versus the VS arm. Figure 2 shows that the odds of having an OD was 3.8 (95% CI: 2.1 to 6.9) times higher for patients in the DC arm compared to those in the VS arm (N=273). This is similar to the results of the main trial where the odds of having a non-serious OD was 3.6 (95% CI: 2.1 to 6.1) times higher for patients in the DC arm compared to those in the VS arm (N=5472) [1].
Figure 2.
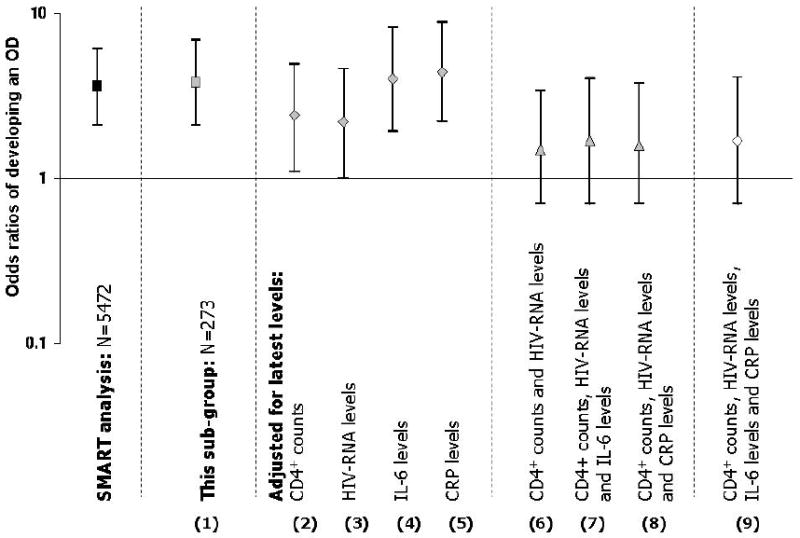
Odds ratios for opportunistic disease – comparisons between the DC arm and the VS arm
As expected, since baseline factors are balanced between arms, adjustment for them did not change the odds ratio substantially (data not shown). We then explored the effect of adjusting for latest levels of each biomarker. In these models, the latest levels of the biomarkers cannot explain the difference observed between the DC and the VS arms (models 4 and 5), however, both the latest CD4+ count in addition to latest HIV-RNA levels explain most of the difference between the DC and the VS arms (i.e. brings the odds ratio closer to one – i.e. models 2, 3 and 6). Overall, latest IL-6 and CRP values failed to effect the difference in the rates of ODs between the DC and VS arms alone nor did they attenuate the reduction in difference caused by adjustment for latest CD4 count and HIV-RNA levels (models 7-9)
Exploration of the interactions between each of the latest levels of the biomarkers and the treatment arm demonstrated that only one interaction was significant and that was for amyloid A (p=0.04). There was a 1.1 fold (95% CI: 1.0 to 1.2, p=0.05) higher odds of having an OD for every mg/L higher amyloid A level among patients in the DC arm, similar patterns were not seen among patients in the VS arm. Although these have limited power, tests for interaction between hsCRP (p=0.30), amyloid P (p=0.42), IL-6 (p=0.81), D-dimer (p=0.18) and F1.2 (p=0.22) did not indicate an interaction was present (Table 3).
Table 3. Biomarker levels for cases and controls according to treatment arm.
| VS arm | DC arm | |||
|---|---|---|---|---|
| Median (IQR) | Cases(N =19) | Controls(N = 94) | Cases(N =72) | Controls(N = 88) |
| Biomarkers at baseline | ||||
| hsCRP (μg/mL) | 1.98(0.95, 4.93) | 1.69(0.76, 4.05) | 2.71(1.25, 7.31) | 2.44(0.82, 4.95) |
| Amyloid A (mg/L) | 2.98(1.83, 7.30) | 3.20(1.80, 6.08) | 3.64(2.41, 8.42) | 3.40(1.83, 5.18) |
| Amyloid P (μg/mL) | 65.3(53.2, 91.6) | 63.7(47.8, 96.0) | 63.2(53.0, 73.5) | 62.2(51.3, 79.3) |
| IL-6 (pg/mL) | 2.02(1.24, 3.08) | 1.87(1.37, 3.55) | 3.31(1.96, 4.35) | 2.33(1.38, 3.73) |
| D-dimer (μg/mL) | 0.53(0.27, 0.97) | 0.31(0.17, 0.61) | 0.31(0.20, 0.63) | 0.33(0.17, 0.49) |
| Prothrombin fragment 1+2 (F1.2) (pmol/L) | 380(265, 491) | 351(273, 528) | 328(266, 484) | 314(238, 484) |
| Latest biomarkers level | N=17 | N=78 | N=58 | N=66 |
| hsCRP (μg/mL) | 2.62(1.30, 11.74) | 1.86(0.63, 4.18) | 4.09(1.85, 10.38) | 2.19(0.65, 4.19) |
| Amyloid A (mg/L) | 4.70(2.54, 9.30) | 3.39(1.80, 5.90) | 5.65(2.69, 10.80) | 3.45(2.08, 7.09) |
| Amyloid P (μg/mL) | 64.1(54.3, 96.5) | 72.1(47.5, 99.2) | 60.2(44.0, 79.0) | 63.6(48.7, 79.7) |
| IL-6 (pg/mL) | 3.51(2.67, 6.60) | 2.32(1.50, 3.66) | 4.98(2.60, 6.91) | 2.57(1.75, 3.94) |
| D-dimer (μg/mL) | 0.65(0.35, 0.83) | 0.27(0.17, 0.52) | 0.59(0.31, 1.25) | 0.41(0.29, 0.72) |
| Prothrombin fragment 1+2 (F1.2) (pmol/L) | 439(267, 712) | 318(232, 482) | 323(246, 479) | 351(237, 549) |
Discussion
Previous analysis of SMART data demonstrated that episodic ARV is associated with an increased risk of development of OD and that the excess risk of OD in the DC arm was most likely due to two factors; a greater percentage of time spent with CD4+ counts <350 cells/mm3 and a greater proportion of time with uncontrolled HIV replication [17].
The observed association of previous AIDS defining illness with raised risk of development of OD is supported by other studies and underlines that once a patient has had an AIDS defining illness, they remain prone to develop ODs and benefit from life-long ARV therapy [18].
Our study is the first to demonstrate the association between elevations of IL-6 and hsCRP and the subsequent development of OD in individuals with HIV-infection. We found that both baseline and latest levels of IL-6 and hsCRP were independently associated with developing an OD. An interesting aspect of this analysis was the fact that D-dimer, the most predictive biomarker of overall mortality in SMART was not significantly associated with OD [2]. This likely reflects the contribution of cardiovascular disease (diagnosed and undiagnosed), which is associated with elevated levels of D-dimer, to overall mortality as only 8% of the deaths in SMART were due to OD [1]
In this paper we examined the associations between biomarker levels, which reflect cytokine activation and inflammation, and the development of an OD. The concept that chronic immune activation plays a role in AIDS pathogenesis is not new, but the exact mechanism remains unclear [19, 20]. In observational studies, cytokine and immune activation marker levels correlate with the severity of disease and clinical outcome among HIV-infected individuals [11, 12]. Elevated expression of CD38 on CD8+ T cells has been found to be a stronger prognostic marker of HIV disease progression than CD4+ cell count or HIV-RNA level [21, 22] and cytokine levels including IL-6 levels have been shown to decline after introduction of ARV and rise again when treatment was interrupted [23, 24].
Since inflammatory biomarkers become elevated as part of the host's response to the disease prior to diagnosing an OD, it is possible that reverse causality played a role in the observed associations between latest levels of the biomarkers and the risk of OD. However, the fact that baseline elevations in hsCRP and IL-6 also predicted OD events makes this less likely and indicates that elevations of the biomarkers could be markers of immune activation and associated impairment of immune function in individuals at increased risk of development of OD. In addition, adjustment for the time between the marker measurement and the OD date did not affect the trends reported between the biomarker levels and the risk of an OD.
Cells produce cytokines such as IL-6 as part of the immune system's response to infection or inflammation. In the HIV negative population IL-6 is known to play a role in the growth and survival of many types of tumours [3-5], but the mechanisms are poorly understood. It is recognised to be a key factor in myeloma progression and survival [3] and is also recognised as a factor in the development of B cell neoplasms and also for HHV-8 associated Kaposis sarcoma and Castleman's disease [25, 26]. A poorer prognosis has been observed with higher levels of IL-6 in patients with renal, ovarian, prostate and breast cancer [27]. Many different types of cancer cells proliferate in response to IL-6 and one theory is that IL-6 activity may disrupt epigenetic programming leading to development of neoplasia [4].
IL-6 may promote intracellular growth of atypical mycobacterium [28] and be involved in the pathogenesis of other ODs. Development of CMV disease in immunosuppressed renal transplant patients appears influenced by effects of pro-inflammatory and anti-inflammatory cytokines [29] and IL-6 has also been shown to be an independent predictor of mortality in the elderly and immunosuppressed patients such as renal dialysis patients [30]. In HIV, IL-6 is more likely to be a surrogate marker of a specific type of generally enhanced inflammatory state that may ultimately lead to increased risk of infections and other ODs rather than being directly involved in the pathogenesis of the development of the OD.
We also demonstrated an association between elevations of hsCRP (baseline and latest levels) and Amyloid A (latest levels) and development of OD. The effect of these biomarker levels on the risk of OD were consistent for patients in the DC arm and in the VS arm (i.e. no interaction was present), although the effect of amyloid A was more predictive of an OD among patients in the DC arm. Our observed association of elevated amyloid A just prior to diagnosis of an OD may suggest that it is part of the hosts response to the OD induced inflammatory process. Amyloid A plays a role in chronic inflammation and cancer development although the exact mechanism is so far poorly understood. [15].
While hsCRP may simply be a marker for (possibly pre-clinical) presence of OD or infections, high circulating levels of hsCRP may contribute to promoting disease progression as resolution of inflammation appears to improve survival [31]. It is likely that as most infections have an incubation time of <2-3 months, associations beyond this period may reflect an enhanced inflammatory state in individuals at risk of OD. In one US cross-sectional study of 513 HIV positive men levels of hsCRP were associated with HIV disease progression independent of CD4+ cell count and HIV-RNA levels [14]. Lower levels of hsCRP have also been shown to predict longer survival within HIV-infected individuals [13].
In our study, higher baseline levels of hsCRP and latest levels of hsCRP were independently predictive of increased risk of development of OD. Although CD4+ cell counts (and over the longer term, HIV-RNA levels) remain the most useful measures for predicting AIDS in HIV-infected individuals [32], the use of routine measurement of hsCRP is easily accessible and could provide clinicians with additional information beyond CD4+ and plasma HIV-RNA in the identification of patients “at risk” for the development of OD. The utility of hsCRP in resource-poor settings to indicate the need to commence therapy or monitor response to therapy also warrants further exploration. One potential utility of hsCRP is in resource-limited settings, where viral loads are not routinely performed and are far more expensive than an individual hsCRP test, although we have no evidence that CRP could replace VL as a marker for the effect of ART. In addition as the majority of patients who had an OD were in the discontinuation arm, biomarkers may be particularly useful if a patient is considering discontinuing therapy.
The limited panel of biomarkers studied restricts our study. Many other pro-inflammatory cytokines such as TNF are released during the systemic immune activation observed in uncontrolled HIV disease and may also have prognostic value for risk of development of OD. We also did not look at markers of immune activation such as CD38 expression on CD8+ T cells. As mentioned earlier the sequence of events is also unclear although reverse causality is unlikely to account for our observation that baseline elevations in hsCRP and IL-6 also predicted OD events. There were also limited numbers of events, which did not allow examination of association of biomarkers separately for infective, malignant, and other opportunistic diseases.
In summary this study demonstrated that elevated levels of IL-6 and hsCRP at baseline and at latest follow-up identified HIV-infected patients at risk of OD.
Acknowledgments
Funding Statement: Support provided by: NIAID, NIH grants U01AI042170 and U01AI46362. ClinicalTrials.gov number: NCT00027352.
Author contribution: All authors participated in the design of the study and facilitated with data collection, analysis and interpretation. Further, all authors helped write the manuscript and approved the final version.
Investigators in the SMART Study Group: SMART was initiated by the Terry Beirn Community Programs for Clinical Research on AIDS (CPCRA) and implemented in collaboration with international coordinating centers in Copenhagen (Copenhagen HIV Programme), London (Medical Research Council, Clinical Trials Unit), Sydney (National Centre in HIV Epidemiology and Clinical Research) and Washington (CPCRA). Participating staff are listed below.
Copenhagen International Coordinating Center: JD Lundgren, KB Jensen, DC Gey, L Borup, M Pearson, PO Jansson, BG Jensen, J Tverland, H Juncker-Benzon, Z Fox, AN Phillips.
London Internatioal Coordinating Center: JH Darbyshire, AG Babiker, AJ Palfreeman, SL Fleck, W Dodds, E King, B Cordwell, F van Hooff, Y Collaco-Moraes.
Sydney International Coordinating Center: DA Cooper, S Emery, FM Drummond, SA Connor, CS Satchell, S Gunn, S Oka, MA Delfino, K Merlin, C McGinley.
Washington International Coordinating Center: F Gordin, E Finley, D Dietz, C Chesson, M Vjecha, B Standridge.
INSIGHT Network Coordinating Center: JD Neaton, G Bartsch, A DuChene, M George, B Grund, M Harrison, E Krum, G Larson, C Miller, R Nelson, J Neuhaus, MP Roediger, T Schultz.
ECG Reading Center: R Prineas, C Campbell, Z-M Zhang.
Endpoint Review Committee: G Perez (co-chair), A Lifson (co-chair), D Duprez, J Hoy, C Lahart, D Perlman, R Price, R Prineas, F Rhame, J Sampson, J Worley.
NIAID Data and Safety Monitoring Board: M Rein (chair), R DerSimonian (executive secretary), BA Brody, ES Daar, NN Dubler, TR Fleming, DJ Freeman, JP Kahn, KM Kim, G Medoff, JF Modlin, R Moellering Jr, BE Murray, B Pick, ML Robb, DO Scharfstein, J Sugarman, A Tsiatis, C Tuazon, L Zoloth.
NIH, NIAID: K Klingman, S Lehrman.
SMART Clinical Site Investigators by Country (SMART enrollment): Argentina (147): J Lazovski, WH Belloso, MH Losso, JA Benetucci, S Aquilia, V Bittar, EP Bogdanowicz, PE Cahn, AD Casiró, I Cassetti, JM Contarelli, JA Corral, A Crinejo, L Daciuk, DO David, G Guaragna, MT Ishida, A Krolewiecki, HE Laplume, MB Lasala, L Lourtau, SH Lupo, A Maranzana, F Masciottra, M Michaan, L Ruggieri, E Salazar, M Sánchez, C Somenzini.
Australia (170): JF Hoy, GD Rogers, AM Allworth, JStC Anderson, J Armishaw, K Barnes, A Carr, A Chiam, JCP Chuah, MC Curry, RL Dever, WA Donohue, NC Doong, DE Dwyer, J Dyer, B Eu, VW Ferguson, MAH French, RJ Garsia, J Gold, JH Hudson, S Jeganathan, P Konecny, J Leung, CL McCormack, M McMurchie, N Medland, RJ Moore, MB Moussa, D Orth, M Piper, T Read, JJ Roney, N Roth, DR Shaw, J Silvers, DJ Smith, AC Street, RJ Vale, NA Wendt, H Wood, DW Youds, J Zillman.
Austria (16): A Rieger, V Tozeau, A Aichelburg, N Vetter.
Belgium (95): N Clumeck, S Dewit, A de Roo, K Kabeya, P Leonard, L Lynen, M Moutschen, E O'Doherty.
Brazil (292): LC Pereira Jr, TNL Souza, M Schechter, R Zajdenverg, MMTB Almeida, F Araujo, F Bahia, C Brites, MM Caseiro, J Casseb, A Etzel, GG Falco, ECJ Filho, SR Flint, CR Gonzales, JVR Madruga, LN Passos, T Reuter, LC Sidi, ALC Toscano.
Canada (102): D Zarowny, E Cherban, J Cohen, B Conway, C Dufour, M Ellis, A Foster, D Haase, H Haldane, M Houde, C Kato, M Klein, B Lessard, A Martel, C Martel, N McFarland, E Paradis, A Piche, R Sandre, W Schlech, S Schmidt, F Smaill, B Thompson, S Trottier, S Vezina, S Walmsley.
Chile (49): MJ Wolff Reyes, R Northland.
Denmark (19): L Ostergaard, C Pedersen, H Nielsen, L Hergens, IR Loftheim, KB Jensen.
Estonia (5): M Raukas, K Zilmer.
Finland (21): J Justinen, M Ristola.
France (272): PM Girard, R Landman, S Abel, S Abgrall, K Amat, L Auperin, R Barruet, A Benalycherif, N Benammar, M Bensalem, M Bentata, JM Besnier, M Blanc, O Bouchaud, A Cabié, P Chavannet, JM Chennebault, S Dargere, X de la Tribonniere, T Debord, N Decaux, J Delgado, M Dupon, J Durant, V Frixon-Marin, C Genet, L Gérard, J Gilquin, B Hoen, V Jeantils, H Kouadio, P Leclercq, J-D Lelièvre, Y Levy, CP Michon, P Nau, J Pacanowski, C Piketty, I Poizot-Martin, I Raymond, D Salmon, JL Schmit, MA Serini, A Simon, S Tassi, F Touam, R Verdon, P Weinbreck, L Weiss, Y Yazdanpanah, P Yeni.
Germany (215): G Fätkenheuer, S Staszewski, F Bergmann, S Bitsch, JR Bogner, N Brockmeyer, S Esser, FD Goebel, M Hartmann, H Klinker, C Lehmann, T Lennemann, A Plettenberg, A Potthof, J Rockstroh, B Ross, A Stoehr, JC Wasmuth, K Wiedemeyer, R Winzer.
Greece (95): A Hatzakis, G Touloumi, A Antoniadou, GL Daikos, A Dimitrakaki, P Gargalianos-Kakolyris, M Giannaris, A Karafoulidou, A Katsambas, O Katsarou, AN Kontos, T Kordossis, MK Lazanas, P Panagopoulos, G Panos, V Paparizos, V Papastamopoulos, G Petrikkos, H Sambatakou, A Skoutelis, N Tsogas, G Xylomenos.
Ireland (2): CJ Bergin, B Mooka.
Israel (13): S Pollack, MG Mamorksy, N Agmon-Levin, R Karplus, E Kedem, S Maayan, E Shahar, Z Sthoeger, D Turner, I Yust.
Italy (88): G Tambussi, V Rusconi, C Abeli, M Bechi, A Biglino, S Bonora, L Butini, G Carosi, S Casari, A Corpolongo, M De Gioanni, G Di Perri, M Di Pietro, G D'Offizi, R Esposito, F Mazzotta, M Montroni, G Nardini, S Nozza, T Quirino, E Raise.
Japan (15): M Honda, M Ishisaka.
Lithuania (4): S Caplinskas, V Uzdaviniene.
Luxembourg (3): JC Schmit, T Staub.
Morocco (42): H Himmich, K Marhoum El Filali.
New Zealand (7): GD Mills, T Blackmore, JA Masters, J Morgan, A Pithie.
Norway (17): J Brunn, V Ormasssen.
Peru (57): A La Rosa, O Guerra, M Espichan, L Gutierrez, F Mendo, R Salazar.
Poland (54): B Knytz, A Horban, E Bakowska, M Beniowski, J Gasiorowski, J Kwiatkowski.
Portugal (73): F Antunes, RS Castro, M Doroana, A Horta, K Mansinho, AC Miranda, IV Pinto, E Valadas, J Vera.
Russia (17): A Rakhmanova, E Vinogradova, A Yakovlev, N Zakharova.
South Africa (26): R Wood, C Orrel.
Spain (100): J Gatell, JA Arnaiz, R Carrillo, B Clotet, D Dalmau, A González, Q Jordano, A Jou, H Knobel, M Larrousse, R Mata, JS Moreno, E Oretaga, JN Pena, F Pulido, R Rubio, J Sanz, P Viciana.
Switzerland (91): B Hirschel, R Spycher, M Battegay, E Bernasconi, S Bottone, M Cavassini, A Christen, C Franc, HJ Furrer, A Gayet-Ageron, D Genné, S Hochstrasser, L Magenta, C Moens, N Müller, R Nüesch.
Thailand (159): P Phanuphak, K Ruxrungtham, W Pumpradit, P Chetchotisakd, S Dangthongdee, S Kiertiburanakul, V Klinbuayaem, P Mootsikapun, S Nonenoy, B Piyavong, W Prasithsirikul, P Raksakulkarn.
United Kingdom (214): BG Gazzard, JG Ainsworth, J Anderson, BJ Angus, TJ Barber, MG Brook, CD Care, DR Chadwick, M Chikohora, DR Churchill, D Cornforth, DH Dockrell, PJ Easterbrook, PA Fox, R Fox, PA Gomez, MM Gompels, GM Harris, S Herman, AGA Jackson, SPR Jebakumar, MA Johnson, GR Kinghorn, KA Kuldanek, N Larbalestier, C Leen, M Lumsden, T Maher, J Mantell, R Maw, S McKernan, L McLean, S Morris, L Muromba, CM Orkin, AJ Palfreeman, BS Peters, TEA Peto, SD Portsmouth, S Rajamanoharan, A Ronan, A Schwenk, MA Slinn, CJ Stroud, RC Thomas, MH Wansbrough-Jones, HJ Whiles, DJ White, E Williams, IG Williams, M Youle.
United States (2989): DI Abrams, EA Acosta, S Adams, A Adamski, L Andrews, D Antoniskis, DR Aragon, R Arduino, R Artz, J Bailowitz, BJ Barnett, C Baroni, M Barron, JD Baxter, D Beers, M Beilke, D Bemenderfer, A Bernard, CL Besch, MT Bessesen, JT Bethel, S Blue, JD Blum, S Boarden, RK Bolan, JB Borgman, I Brar, BK Braxton, UF Bredeek, R Brennan, DE Britt, J Brockelman, S Brown, V Bruzzese, D Bulgin-Coleman, DE Bullock, V Cafaro, B Campbell, S Caras, J Carroll, KK Casey, F Chiang, G Childress, RB Cindrich, C Clark, M Climo, C Cohen, J Coley, DV Condoluci, R Contreras, J Corser, J Cozzolino, LR Crane, L Daley, D Dandridge, V D'Antuono, JG Darcourt Rizo Patron, JA DeHovitz, E DeJesus, J DesJardin, M Diaz-Linares, C Dietrich, P Dodson, E Dolce, K Elliott, D Erickson, M Estes, LL Faber, J Falbo, MJ Farrough, CF Farthing, P Ferrell-Gonzalez, H Flynn, C Frank, M Frank, KF Freeman, N French, G Friedland, N Fujita, L Gahagan, K Genther, I Gilson, MB Goetz, E Goodwin, F Graziano, CK Guity, P Gulick, ER Gunderson, CM Hale, K Hannah, H Henderson, K Hennessey, WK Henry, DT Higgins, SL Hodder, HW Horowitz, M Howe-Pittman, J Hubbard, R Hudson, H Hunter, C Hutelmyer, MT Insignares, L Jackson, L Jenny, M John, DL Johnson, G Johnson, J Johnson, L Johnson, J Kaatz, J Kaczmarski, S Kagan, C Kantor, T Kempner, K Kieckhaus, N Kimmel, BM Klaus, N Klimas, JR Koeppe, J Koirala, J Kopka, JR Kostman, MJ Kozal, A Kumar, A Labriola, H Lampiris, C Lamprecht, KM Lattanzi, J Lee, J Leggett, C Long, A Loquere, K Loveless, CJ Lucasti, R Luskin-Hawk, M MacVeigh, LH Makohon, S Mannheimer, NP Markowitz, C Marks, N Martinez, C Martorell, E McFeaters, B McGee, DM McIntyre, J McKee, E McManus, LG Melecio, D Melton, S Mercado, E Merrifield, JA Mieras, M Mogyoros, FM Moran, K Murphy, D Mushatt, S Mutic, I Nadeem, R Nahass, D Nixon, S O'Brien, A Ognjan, M O'Hearn, K O'Keefe, PC Okhuysen, E Oldfield, D Olson, R Orenstein, R Ortiz, J Osterberger, W Owen, F Parpart, V Pastore-Lange, S Paul, A Pavlatos, DD Pearce, R Pelz, G Perez, S Peterson, G Pierone Jr, D Pitrak, SL Powers, HC Pujet, JW Raaum, J Ravishankar, J Reeder, N Regevik, NA Reilly, C Reyelt, J Riddell IV, D Rimland, ML Robinson, AE Rodriguez, MC Rodriguez-Barradas, V Rodriguez Derouen, R Roland, C Rosmarin, WL Rossen, JR Rouff, JH Sampson, M Sands, C Savini, S Schrader, MM Schulte, C Scott, R Scott, H Seedhom, M Sension, A Sheble-Hall, A Sheridan, J Shuter, LN Slater, R Slotten, D Slowinski, M Smith, S Snap, C Somboonwit, DM States, M Stewart, G Stringer, J Sullivan, KK Summers, K Swanson, IB Sweeton, S Szabo, EM Tedaldi, EE Telzak, Z Temesgen, D Thomas, MA Thompson, S Thompson, C Ting Hong Bong, C Tobin, J Uy, A Vaccaro, LM Vasco, I Vecino, GK Verlinghieri, F Visnegarwala, BH Wade, V Watson, SE Weis, JA Weise, S Weissman, AM Wilkin, L Williams, JH Witter, L Wojtusic, TJ Wright, V Yeh, B Young, C Zeana, J Zeh.
Uruguay (3): E Savio, M Vacarezza.
Footnotes
Conflict of interest statement: No member of the Writing Group for this report has any financial or personal relationships with people or organizations that could inappropriately influence this work or constitute a conflict of interest, although most members of the group have, at some stage in the past, received funding from a variety of pharmaceutical companies for research, travel grants, speaking engagements or consultancy fees.
Data accepted as a poster presentation for 16th Conference on Retroviruses and Opportunistic Infections (CROI), Montreal, February 9-11th 2009, (Abstract number 0-255).
References
- 1.The Strategies for Management of Antiretroviral Therapy (SMART) Study Group. CD4+ count guided interruptions of antiretroviral therapy. N Engl J Med. 2006;355:2283–96. doi: 10.1056/NEJMoa062360. [DOI] [PubMed] [Google Scholar]
- 2.Kuller LH, Tracey R, Belloso W, et al. Activation of inflammatory and coagulation pathways is associated with mortality in patients with HIV infection. PLoS Med. 2008;5(10):e203. doi: 10.1371/journal.pmed.0050203. [DOI] [PMC free article] [PubMed] [Google Scholar]
- 3.Hata H, Xiao H, Petrucci MT, Woodliff J, Chang R, Epstein J. IL-6 gene expression in multiple myeloma: A characteristic of immature tumour cells. Blood. 1993;81:3357–64. [PubMed] [Google Scholar]
- 4.Hodge DR, Peng B, Cherry J, et al. Interleukin 6 supports the maintenance of p53 tumour suppressor gene promotor methylation. Cancer Res. 2005;65(11):4673–82. doi: 10.1158/0008-5472.CAN-04-3589. [DOI] [PubMed] [Google Scholar]
- 5.Volpato S, Guralnik JM, Ferrucci L, et al. Cardiovascular disease, interleukin-6, and risk of mortality in older women: the women's health and aging study. Circulation. 2001;103(7):947–53. doi: 10.1161/01.cir.103.7.947. [DOI] [PubMed] [Google Scholar]
- 6.Ridker PM, Hennekens CH, Buring JE, Rifai N. C-reactive protein and other markers of inflammation in the prediction of cardiovascular disease in women. N Engl J Med. 2000;342(12):836–43. doi: 10.1056/NEJM200003233421202. [DOI] [PubMed] [Google Scholar]
- 7.Pecoits-Filho R, Bárány P, Lindholm B, Heimbürger O, Stenvinkel P. Interleukin 6 is an independent predictor of mortality in patients starting dialysis treatment. Nephrol Dial Trnsplant. 2002;17:1684–1688. doi: 10.1093/ndt/17.9.1684. [DOI] [PubMed] [Google Scholar]
- 8.Honda H, Qureshi AR, Heimbürger O, et al. Serum albumin, C-reactive protein, interleukin 6, and fetuin a as predictors of malnutrition, cardiovascular disease, and mortality in patients with ESRD. Am J Kidney Dis. 2006;47(1):139–48. doi: 10.1053/j.ajkd.2005.09.014. [DOI] [PubMed] [Google Scholar]
- 9.Breen E, Rezai AR, Nakajima K, Beall GN, et al. Infection with HIV is associated with elevated IL-6 levels and production. J Immunol. 1990;144:480–484. [PubMed] [Google Scholar]
- 10.Fahey JL. Prognostic significance of plasma markers of immune activation AIDS. 1998;10(12):1581–90. doi: 10.1097/00002030-199813000-00004. [DOI] [PubMed] [Google Scholar]
- 11.Osmond DH, Shiboski S, Bacchetti P, et al. Immune activation markers and AIDS prognosis. AIDS. 1991;5:505–11. doi: 10.1097/00002030-199105000-00005. [DOI] [PubMed] [Google Scholar]
- 12.Aziz N, Parunag P, Taylor J, et al. Stability of plasma levels of cytokines and soluble activation markers in patients with HIV infection. J Infect Dis. 1999;179:843–8. doi: 10.1086/314673. [DOI] [PubMed] [Google Scholar]
- 13.Feldman JG, Goldwasser P, Holman S, DeHovitz J, Minkoff H. C-reactive protein is an independent predictor of mortality in women with HIV-1 infection. J Acquir Immune Defic Syndr. 2003;32(2):210–14. doi: 10.1097/00126334-200302010-00014. [DOI] [PubMed] [Google Scholar]
- 14.Lau B, Sharrett AR, Kingsley LA, et al. CRP is a marker for HIV disease progression. Arch Int Med. 2006;166:64–70. doi: 10.1001/archinte.166.1.64. [DOI] [PubMed] [Google Scholar]
- 15.Malle E, Sodin-Semrl S, Kovacevic A. Serum amyloid A: An acute-phase protein involved in tumour pathogenesis. [23 August 2008];Cell Mol Life Sci. doi: 10.1007/s00018-008-8321-x. [Epub ahead of print] Available at http://www.springerlink.com/content/n1w7n5016n3j1n76/ [DOI] [PMC free article] [PubMed]
- 16.Lifson AR, Belloso WH, Carey C, et al. Determination of the underlying cause of death in three multicenter international HIV clinical trials. HIV Clin Trials. 2008;9(3):177–85. doi: 10.1310/hct0903-177. [DOI] [PMC free article] [PubMed] [Google Scholar]
- 17.Lundgren JD, Babiker A, El-Sadr W, et al. Strategies for Management of Antiretroviral Therapy (SMART) Study Group Inferior clinical outcome of the CD4+ cell count-guided antiretroviral treatment interruption strategy in the SMART study: role of CD4+ Cell counts and HIV-RNA levels during follow-up. J Infect Dis. 2008;197(8):1145–55. doi: 10.1086/529523. [DOI] [PubMed] [Google Scholar]
- 18.Petruckevitch A, Del Amo J, Phillips AN, et al. Disease progression and survival following specific AIDS-defining conditions: a retrospective cohort study of 2048 HIV-infected persons in London. AIDS. 1998;12(9):1007–13. doi: 10.1097/00002030-199809000-00006. [DOI] [PubMed] [Google Scholar]
- 19.Lederman MM, Kalish LA, Asmuth D, Fiebig E, Mileno M, Busch MP. ‘Modelling’ relationships among HIV-1 replication, immune activation and CD4 T cell losses using adjusted correlative analyses. AIDS. 2000;14:951–58. doi: 10.1097/00002030-200005260-00006. [DOI] [PubMed] [Google Scholar]
- 20.Sodora DL, Silvestri G. Immune activation and AIDS pathogenesis. AIDS. 2008;22(4):439–46. doi: 10.1097/QAD.0b013e3282f2dbe7. [DOI] [PubMed] [Google Scholar]
- 21.Liu Z, Cumberland WG, Hultin LE, Prince HE, Detels R, Giorgi JV. Elevated CD38 antigen expression on CD8+ T cells is a stronger marker for the risk of chronic HIV disease progression to AIDS and death in the Multicenter AIDS Cohort Study than CD4+ cell count, soluble immune activation markers, or combinations of HLA-DR and CD38 expression. J Acquir Immune Defic Syndr. 1997;16(2):83–92. doi: 10.1097/00042560-199710010-00003. [DOI] [PubMed] [Google Scholar]
- 22.Giorgi JV, Lyles RH, Matud JL, et al. Multicenter AIDS Cohort Study. Predictive value of immunologic and virologic markers after long or short duration of HIV-1 infection. J Acquir Immune Defic Syndr. 2002;29(4):346–55. doi: 10.1097/00126334-200204010-00004. [DOI] [PubMed] [Google Scholar]
- 23.Amirayan-Chevillard N, Tissot-Dupont H, Capo C. Impact of highly active anti-retroviral therapy (HAART) on cytokine production and monocyte subsets in HIV-infected patients. Clin Exp Immunol. 2000;120(1):107–12. doi: 10.1046/j.1365-2249.2000.01201.x. [DOI] [PMC free article] [PubMed] [Google Scholar]
- 24.Wolf K, Tsakiris DA, Weber R, Erb P, Battegay M. Swiss HIV Cohort Study. Antiretroviral therapy reduces markers of endothelial and coagulation activation in patients infected with HIV. JID. 2002;185:456–62. doi: 10.1086/338572. [DOI] [PubMed] [Google Scholar]
- 25.Barton BE, Murphy TF, Adem P, Watson RA, Irwin RJ, Huang HF. IL-6 signaling by STAT3 participates in the change from hyperplasie to neoplasia in NRP-152 and NRP-154 rat prostatic epithelial cells. BMC Cancer. 2001;1:19. doi: 10.1186/1471-2407-1-19. [DOI] [PMC free article] [PubMed] [Google Scholar]
- 26.Barillari G, Buonaguro L, Fiorelli V, et al. Effects of cytokines from activated immune cells on vascular cell growth and HIV-1 gene expression. Implications for AIDS-Kaposi's sarcoma pathogenesis. J Immunol. 1992;149(11):3727–34. [PubMed] [Google Scholar]
- 27.Saldago R, Benoy I, Weytjens R, et al. Arteriovenous gradients of ILK-6 and serum VEGF and D-Dimers in human cancer. Br J Cancer. 2002;87:1437–44. doi: 10.1038/sj.bjc.6600655. [DOI] [PMC free article] [PubMed] [Google Scholar]
- 28.Bermudez LE, Wu M, Petrofsky M, Young LS. Interleukin-6 antagonizes tumor necrosis factor-mediated mycobacteriostatic and mycobactericidal activities in macrophages. Infect Immun. 1992;60(10):4245–52. doi: 10.1128/iai.60.10.4245-4252.1992. [DOI] [PMC free article] [PubMed] [Google Scholar]
- 29.Nordoy I, Muller F, Nordal KP, et al. The role of the tumour necrosis factor system and interleukin-10 during cytomegalovirus infection in renal transplant recipients. J Infect Dis. 2000;181:51–7. doi: 10.1086/315184. [DOI] [PubMed] [Google Scholar]
- 30.Pecoits-Filho R, Bárány P, Lindholm B, Heimbürger O, Stenvinkel P. Interleukin 6 is an independent predictor of mortality in patients starting dialysis treatment. Nephrol Dial Transplant. 2002;17:1684–8. doi: 10.1093/ndt/17.9.1684. [DOI] [PubMed] [Google Scholar]
- 31.Drain PK, Kupka R, Msamanga GI, Urassa W, Mugusi F, Fawzi WW. C-reactive protein independently predicts HIV-related outcomes among women and children in a resource-poor setting. AIDS. 2007;21(15):2067–75. doi: 10.1097/QAD.0b013e32826fb6c7. [DOI] [PMC free article] [PubMed] [Google Scholar]
- 32.Phillips A, CASCADE Collaboration Short-term risk of AIDS according to current CD4 cell count and viral load in antiretroviral drug-naive individuals and those treated in the monotherapy era. AIDS. 2004;18(1):51–8. doi: 10.1097/00002030-200401020-00006. [DOI] [PubMed] [Google Scholar]