Multiband Multislice GE-EPI at 7 Tesla, With 16-Fold Acceleration Using Partial Parallel Imaging With Application to High Spatial and Temporal Whole-Brain FMRI (original) (raw)
. Author manuscript; available in PMC: 2011 May 1.
Published in final edited form as: Magn Reson Med. 2010 May;63(5):1144–1153. doi: 10.1002/mrm.22361
Abstract
Parallel imaging in the form of multiband radiofrequency excitation, together with reduced _k_-space coverage in the phase-encode direction, was applied to human gradient echo functional MRI at 7 T for increased volumetric coverage and concurrent high spatial and temporal resolution. Echo planar imaging with simultaneous acquisition of four coronal slices separated by 44mm and simultaneous 4-fold phase-encoding undersampling, resulting in 16-fold acceleration and up to 16-fold maximal aliasing, was investigated. Task/stimulus-induced signal changes and temporal signal behavior under basal conditions were comparable for multiband and standard single-band excitation and longer pulse repetition times. Robust, whole-brain functional mapping at 7 T, with 2 × 2 × 2mm3 (pulse repetition time 1.25 sec) and 1 × 1 × 2mm3 (pulse repetition time 1.5 sec) resolutions, covering fields of view of 256 × 256 × 176mm3 and 192 × 172 × 176mm3, respectively, was demonstrated with current gradient performance.
Keywords: parallel imaging, 7 Tesla, fMRI, multislice excitation, GRAPPA
Since its introduction (1,2), functional MRI (fMRI) has evolved into the most commonly employed technique for mapping neuronal activity. Significant improvements in fMRI can be realized at ultrahigh magnetic fields due to gains in signal-to-noise ratio (SNR) (3), as well as increases in the magnitude and the accuracy of the functional mapping signals (e.g., (4–8) and references therein). Therefore, most fMRI studies today utilize 3 T, with an ever-increasing number of sites migrating toward 7 T.
However, the T2∗ at ultrahigh magnetic fields is short and unwanted field perturbations are large. Consequently, the advantages of ultrahigh magnetic field fMRI have been exploited to date mainly in reduced acquisition volumes and/or with long repetition times (e.g., (6,7)). Approaches such as echo volume imaging (9) (a three-dimensional extension of echo-planar imaging [EPI]) that can rapidly cover _k_-space for volume imaging are difficult to achieve at ultrahigh magnetic fields, even with aggressive use of partial parallel imaging (PPI) (10) due to the short T2∗. Multislab three-dimensional techniques, which retain in-plane single-shot acquisitions, alleviate this limitation. However, when high resolution and large volume coverage are desired, this approach can still require significant time. In addition, due to reduction in collected _k_-space data, this approach suffers large SNR losses, imposing a limitation on achievable voxel sizes.
In this paper, we report on the use of multiband radio-frequency (RF) excitation, as was previously reported for spine imaging (11), combined with parallel imaging by undersampling _k_-space in one phase encode (PE) dimension, to achieve rapid, highly accelerated, high-resolution, whole-brain coverage with gradient echo (GE)-EPI at 7 T. In this technique, multiple slices are excited and acquired simultaneously. Each RF coil channel then receives a linear combination of the signals from each of the slices, weighted by the coil sensitivity profiles, which, with a matrix inversion, can be used to reconstruct the signal for individual slices. In this approach, the number of slices acquired over the same pulse repetition time (TR) increases without an increase in gradient demand. Furthermore, since each slice is excited and sampled identically, there is no SNR loss due to reduced data collection as is encountered with parallel imaging with undersampling along the PE direction. There are, however, SNR losses associated with the g-factor due to the slice aliasing. As with undersampling of _k_-space, the g-factors achieved for unaliasing of multiple, simultaneously acquired slices is expected to improve with higher magnetic fields and a larger number of receive channels (12,13) and can possibly also be reduced by manipulating the aliasing pattern as in Controlled aliasing in parallel imaging results in higher acceleration (CAIPIRINHA) (14). When the multiband approach is combined with _k_-space undersampling along the PE direction, a two-dimensional (2D) acceleration is achieved. Here, we introduce and demonstrate this technique (15) for generating 7-T whole-brain functional images with 1-2mm resolutions (2–8mm3 voxel volumes) and 1.25- to 1.5-sec TRs with acquisition accelerations of 16 and maximum aliasing of 12–16.
MATERIALS AND METHODS
RF Coil and System
Imaging experiments were performed on a 7 T magnet (Magnex Scientific, Oxford, UK) equipped with a Siemens (Siemens, Erlangen, Germany) TIM console, Siemens Avanto body gradient hardware (rise time 200 μs and maximal gradient strength 40 mT/m), and an 8-kW RF amplifier (CPC, Hauppauge, New York). Imaging was performed on healthy volunteers who had signed a written consent form approved by the Institutional Review Board of the University of Minnesota. A 16-channel transmit/receive head coil (16) was used, with the RF power split evenly between the channels (Werlatone, Brewster, NY). To enable the use of visual stimulation hardware (Avotec Goggles), two transmission line elements centered in front of the eyes were shortened to 8 cm in length. The remaining 14 elements were each 16 cm in length. The elements were circumferentially distributed. All resonance elements were built using a 12mm-thick Teflon substrate between the coil conductor and the RF ground plane. The coil geometry allowed for maximal accelerations along the x and y direction, i.e., the directions perpendicular to the static magnetic field. The coil is similar to the “fixed-size elliptical coil” reported in Adriany et al. (17), where its performance was compared with a geometrically adjustable coil.
Simultaneous excitation of slices was performed on coronal planes using multiband excitation pulses, combining standard five-lobe sinc pulses with frequency offsets (phase ramps) applied to each constituent pulse to realize a spacing of 44mm between bands. This spacing was selected based on acceptable g-factor performance of unaliasing four simultaneously excited slices with the current RF coil employed. With a 2mm-thick slice and no interslice gaps, 22 executions of the four-band excitation were needed to cover the 44mm distance between the simultaneously excited slices, leading to a total of 22 × 4 unaliased slices to cover 176mm in the anterior-posterior direction in ~1 sec. For improved slice selection with the multiband RF pulses, a duration of 5.120 ms was used (the Siemens default duration for a traditional single-band RF-pulse is 2.560 ms). A 4-fold acceleration due to multiband excitation refers to a true 4-fold reduction in the acquired data but not necessarily the overall scan reduction, which can be less due to the lengthening of the RF pulses. Depending on the RF duration, the actual speed up factor due to multiband RF excitation for the four band studies was between 3.88 and 3.94.
Image Acquisition and Data Processing
The fMRI data were acquired in two different ways. First, the multiband multislice was run with a lower duty cycle, such that the TR was matched with a conventional single-band acquisition. Next, the multiband, multislice acquisition was employed with near-maximal duty cycle. In the first set of studies, the multiband was a recalled GE-EPI four-band acquisition (echo time/TR = 25/5000 ms, 60° flip angle, 2 × 2 × 2mm3 resolution, 88 total slices acquired as 22 four-slice packets [i.e., 22 × 4]; hence, an acquisition matrix of 128 × 32 × 22) and the single-band acquisition (echo time/TR = 25/5000 ms, 60° flip angle, 2 × 2 × 2mm3 resolution, 88 slices, an acquisition matrix of 128 × 32 × 88). Both of these studies used a field of view (FOV) of 256 × 256 × 176mm3 and a final matrix size of 128 × 128 × 88. 4-Fold undersampling was employed in the PE direction in all cases. For the fMRI time series, 60 repetitions of the 88-slice volume were acquired. With this slow repetition time, a much larger flip angle can be employed for increased SNR. However, to maintain a similar condition for the rapid volumetric acquisition that is feasible with the multiband data, the lower flip angle was retained. The functional activation paradigm used in this comparison study was an 8-Hz flickering checkerboard and simultaneous finger tapping for periods of 30 sec on/off.
The second set of studies employed the multiband strategy with near-maximal duty cycle at two different resolutions. For these studies, functional activation was achieved with a visuomotor dissociation paradigm (see “Functional Paradigm” section). The acquisition parameters were echo time/TR = 25/1250 ms, 60° nominal flip angle, 2 × 2 × 2mm3 resolution, 128 × 128 in-plane matrix size, 88 slices (i.e., 22 × 4), and, for the higher in-plane resolution studies, echo time/TR = 25/1500 ms, 60° nominal flip angle, 1 × 1 × 2mm3 resolution, and 88 slices (i.e., 22 × 4). To achieve the 1 × 1 × 2mm3 in-plane resolution, the FOV was decreased in the left-right (phase encoding) direction, covering only 192 × 172 × 176mm3 (the matrix size increased accordingly), and the shortest possible echo time was used. In both cases, the time series consisted of 252 repetitions of the 88-slice image data. Higher-resolution data were not obtained for all volunteers. For both the 2 × 2 × 2mm3 and 1 × 1 × 2mm3 acquisitions, an undersampling factor of 4 was used in the PE direction, with 32 and 43 phase-encoding lines acquired, respectively.
The readout direction was selected along the head-foot direction to facilitate optimal use of the 16 circumferentially placed elements for 2D acceleration. Each readout train included a three-line non-phase-encoded navigator echo immediately preceding the readout echo train. The 2nd and 3rd lines from each navigator were used to remove gradient timing errors using a nonlinear phase-correction algorithm (18).
The data needed for separation of the simultaneously acquired slices were obtained using a separate single-band excitation of the same slices, with otherwise identical parameters, including an undersampling factor of 4 in the PE direction. Additionally, the maximal number (124 lines for the 128 × 128 matrix resolution) of autocalibration signal (ACS) lines were acquired for the single-band scan. After slice unaliasing, the ACS data from the single-band acquisition were used for regenerating missing PE lines with the multiband acquisition. Each unaliased slice corresponded uniquely to a slice that was acquired with the single-band acquisition and was phase corrected with the 2nd and 3rd navigator lines (even and odd, respectively) initially acquired with the single-band acquisition.
Estimation of parallel imaging performance was evaluated with the SENsitivity ENcoding (SENSE) g-factor (19), which is also a good measure of how well the Generalized Autocalibration partial parallel Imaging (GRAPPA) reconstruction works (20). To obtain full FOV high-resolution GE-EPI data for estimation of sensitivity profiles, either segmented data or GRAPPA reconstructed data can be used. With GRAPPA, the _k_-space is reconstructed per channel and channel-independent full FOV data can be constructed to enable standard root-sum-of-squares estimation of sensitivity profiles. With segmented acquisitions, residual segmentation artifacts can perturb the estimation of sensitivity profiles, which is generally far less pronounced with GRAPPA reconstructed data. Therefore, for calculation of the needed sensitivity profiles, GE-EPI data with undersampling in the PE direction were reconstructed using GRAPPA (21). Individual channel data were effectively reconstructed as being sampled at the Nyquist rate, and the sensitivity profiles were estimated from the image of an individual channel divided by the root-sum-of-square over all the channels. One can note that the pattern of the aliased spatial frequencies from undersampling in the PE direction left-right (LR) is independent of the frequency distributions along the readout direction (head-toe). Similarly, the aliasing pattern from the slice aliasing in the anterior-posterior (AP) direction is also independent of the frequency distribution in the readout direction (RO). Hence, when using both PE undersampling and slice aliasing, the aliasing pattern is independent of the frequency distribution from the readout direction. A consequence of maintaining the same spacing between slices (a regular pattern) is that the aliasing pattern in the slice direction is identical to the aliasing pattern obtained with undersampling in the AP direction in a three-dimensional acquisition. The g-factor maps for a multi-band acquisition can therefore be calculated from a three-dimensional acquisition with identical FOV. The estimation of sensitivity profiles carries some error, and, following previous work (22), the highest 2% of the g-factor values are discarded for estimating the mean values.
Reconstruction of Functional Imaging Data Using Parallel Imaging
With both PE undersampling and multiband excitation, two separate aliasing directions need to be corrected. Initially, the slice aliasing was corrected, and then, independently, PE undersampled corrections were performed with GRAPPA using a 5 × 4 (width [RO] × height [PE]) interpolation kernel, similar to the sequential application of one-dimensional (1D) GRAPPA factors in Blaimer et al. (23). The separation of aliased slice signals was also performed with GRAPPA, but, in contrast to the conventional use of GRAPPA, for interpolation of missing _k_-space, the aliased slice signal was reformulated as being the result of missing Fourier components of an image with a larger FOV. This reformulation is similar to an approach introduced by Blaimer et al. (24) for three-dimensional reconstruction. Separation was accomplished by interpolating the aliased slice signal to a pseudo-_k_-space with a FOV N times as large as the number of aliased slice signals. For this type of unaliasing, ACS lines were not measured directly as with conventional GRAPPA interpolation but calculated to match with an artificial larger FOV. The calculated ACS lines were obtained using the _k_-space from a single-band RF excitation acquisition, from which a frequency space with N times the FOV can be constructed. To accomplish this, individual slices were concatenated in the spatial frequency domain and then inverse Fourier transformed. In Blaimer et al. (24), this was performed using fully sampled _k_-space for each slice; however, there is no reason to impose such a restriction. The slice unaliasing was performed on the undersampled multiband _k_-space and the single-band undersampled _k_-space was used as ACS lines for calculation of the GRAPPA interpolation weights using a 10 × 18 (width [RO] × height [PE]) kernel. After separating the simultaneously acquired slices, the static residual even/odd phase correction, as estimated from a single-band acquisition, was applied. This ensured optimal spatially specific corrections, based on the unique field inhomogeneities. Additional filtering can be applied to the unaliased _k_-space, but here no additional filtering was used. A block schematic of the processing chain is shown in Fig. 1. The appearance of the reconstructed images relative to the single-band data was used as a guide in determining data fidelity. This can be a flawed measure when prior information is migrated to the reconstructed data (e.g., keyhole and certain constrained PPI constructions), but since the unaliased time series was not reconstructed with temporal or spatial constraints, subjective image quality is a phase encoding (PE) reasonable but not a sole measure. For validating that the data processing did not distort the undersampled _k_-space, the PE-reduced _k_-space, after slice unaliasing, was visually inspected. In Fig. 2, the _k_-space (acquired with a PE reduction of 4) from four separately acquired coronal slices is displayed, together with the separated _k_-space from a four-band acquisition of the same slices.
FIG. 1.
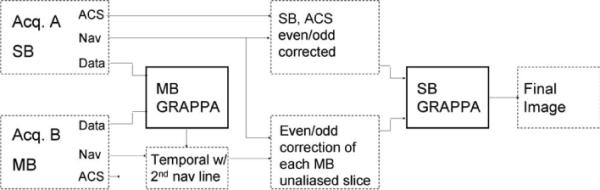
Flow diagram for unaliasing multiband EPI data with GRAPPA. The single-band data are a single time point acquisition from a separate experiment. ACSs obtained during the multiband acquisition are not used.
FIG. 2.
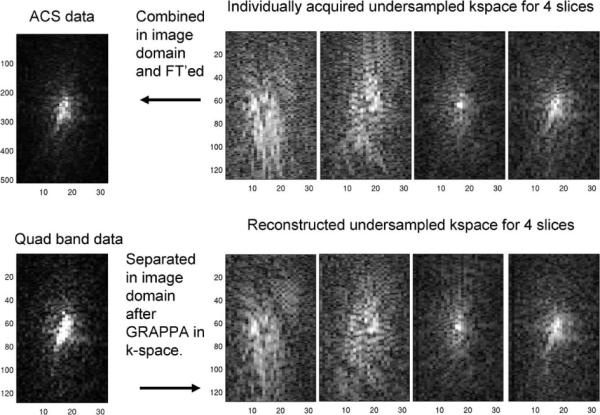
_k_-space with 4-fold undersampling in the PE direction. Top right images are _k_-space from a single channel for four individual slices, which are aliased slices in a multiband RF acquisition. Top left, the recombined _k_-space with an FOV extended by the number of RF bands. Bottom left, _k_-space for a single channel acquired with 4-fold undersampling in the PE direction and simultaneous acquisition of four slices with a multiband RF excitation. Bottom right, separation of acquired multiband _k_-space data into distinct slices, where the separation is performed with the ACS data from the top left _k_-space.
Functional Paradigm
Two activation paradigms were used, chosen in order to generate dispersed activation over a large brain volume. One of these was a visuomotor dissociation paradigm (25,26) that involved visual stimuli composed of three sequentially appearing squares colored yellow, green, and red. Using a joystick, the subjects were instructed to move a cursor inside each box in sequential order; yellow, green, and red. The cursor was determined to be inside a square if it was maintained there for 750 ms. Initially, only the yellow square was visible and was always located at the center of the visual FOV. When the yellow square disappeared, a red and green square appeared somewhere within the visual field. The task was to quickly move the cursor to the green square and, when the green square disappeared, to the red square. When the green disappeared, the red square would (30% of the time) move to a new location. The subjects were requested to perform the task as quickly and precisely as possible.
The duration of a single fMRI run was 315 sec. It was composed of an initial 70 sec of baseline acquisition with an eye-fixation task, followed by three blocks of 70-sec duration, in which the subject performed the joystick task for 35 sec, followed by 35 sec of rest. A final resting period of 35 sec was acquired after completion of the task.
Additionally, another fMRI paradigm was used to produce more focal activation in two separate regions, which are well isolated from each other. This experiment consisted of a 300-sec (30 sec on/30 sec off) finger-tapping task, along with an 8-Hz flashing-checkerboard visual stimulus. Such a task gives excellent isolated activation in the visual and motor cortices. fMRI data were acquired with this task, using both multiband and single-band acquisitions.
RESULTS
Figure 3 displays the averages of the mean g-factor from three subjects for 1 × 4, 4 × 1, 4 × 4 reductions. The g-factors were calculated for each axial slice, as a function of the location of the axial slice within a 10-cm slab along the z-direction (i.e., head to foot direction). This 10-cm slab was well within the coverage of the coil, which had 16-cm-long elements along this dimension. For parallel imaging with SENSE, better reconstructions (with lower g-factors) are obtained when the sensitivity profiles are multiplied with a binary mask encompassing the objects (due to aliasing of fewer pixels for e.g., small objects (22)). For each axial slice, a binary mask encompassing the object was therefore added to ensure that the estimated g-factors were as small as possible. Even though coronal slices with PE reduction along the L-R direction was acquired, the resultant g-factors in the isotropic volumetric data (with no gap) were used for evaluating the g-factor in axial slices. The g-factors and their spatial distribution in the axial slice varied between subjects. The mean g-factor was ~1.5 or less for the 4 × 4 reduction. For these subjects, the averaged whole brain g-factors were 1.05 ± 0.02, 1.26 ± 0.12, and 1.46 ± 0.13 for PE, multislice, and 2D undersampling, respectively.
FIG. 3.

Average from three subjects of the mean g-factors for 4-fold reduction in the PE direction, 4-fold aliasing in the slice direction, and 16-fold reduction in both PE and slice direction. The abscissa indicates the changes in the g-factor for different axial slices due to less aliasing and changes in sensitivity profiles.
Functional Imaging
Method Validation
Comparisons of multiband and the conventional single-band approaches were performed for time series acquired under baseline conditions and with a task/stimulation paradigm. As for all data acquired in this study, both the multi- and single-band data utilized 4-fold acceleration along the PE direction, resulting in 16- and 4-fold accelerations for the multi- and single-band data, respectively. For this comparison, the TR was the same for the two different approaches and was set at what was achievable for the slower single-band acquisition.
First, baseline data were analyzed for temporal signal fluctuations. Figure 4a displays two representative maps of the temporal signal stability from the multi- and single-band acquisitions in the brain of one subject for one slice. The FOV is cropped for display purposes. The ratio of the standard deviation of temporal signal fluctuations, σ, was computed and is shown as histograms in Fig. 4b for all pixels in the brain for the three different subjects. The standard deviation of temporal fluctuations normalized to signal amplitude, σ~, averaged over the three subjects, is summarized in Table 1.
FIG. 4.
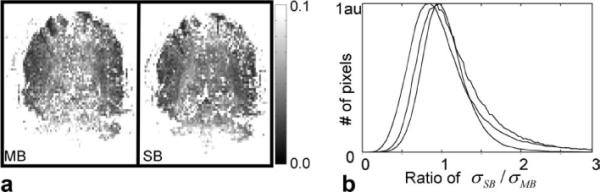
Comparison of temporal signal fluctuations between single-band and multiband acquisitions. a: Maps of the temporal fluctuations, where each pixel is the standard deviation through time, normalized by the mean signal. Left: a coronal slice from a multiband acquisition and (right) the same slice from a separate single-band acquisition. b: Histogram from three subjects, where each pixel from the signal band is compared with the same pixel from a multiband acquisition. The histogram is made with 80 equidistant bins utilizing all pixels in the brain/head, as determined using a signal intensity threshold from the single-band acquisition.
Table 1.
Normalized Temporal Stability for Three Different Subjects for Single-Band (σ~SB) and Multiband (σ~MB) Acquisition*
| Subj 1 | Subj 2 | Subj 3 | |
|---|---|---|---|
| Avg(σ~MB) | 0.056 | 0.064 | 0.074 |
| Avg(σ~SB) | 0.055 | 0.063 | 0.066 |
| Most frequent ratio of σ~SB/σ~MB | 0.98 | 0.86 | 0.94 |
Second, the multi- and single-band data were compared for fMRI data acquired during simultaneous stimulation (8-Hz flashing checkerboard) and tasking (finger tapping) implemented as five repetitions of 30 sec on/30 sec off. Matched TRs and an identical number of time points were employed. Multislice fMRI data from one subject are displayed for single-band (Fig. 5, top row) and multiband acquisitions (Fig. 5, bottom row) in four representative slices from the whole brain. Functional maps were calculated using the same statistical analysis and threshold. The background images in this figure (as in all other figures in this paper) are EPI images from a single time point in the fMRI time series. In the multi-band data, some noise amplification can be identified centrally in the EPI images, where the highest degree of aliasing resides. The functional activation maps (Fig. 5) in the multi- and single-band data were consistent with each other and with what is expected based on the task and stimuli used in this paradigm.
FIG. 5.
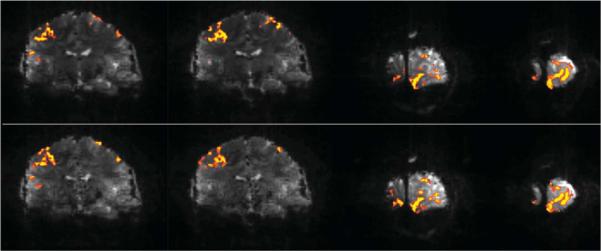
Functional activation maps (t tests, filtered with a 2D cluster of four) from two sequential finger-tapping and checkerboard visual stimulation fMRI experiments. Top row, representative coronal slices from a single-band experiment with a reduction factor of 4 in the PE direction and a TR of 5 sec. Bottom row, same coronal slices from a multiband multislice experiment, acquired with a reduction factor of 4 in the PE direction, four RF bands, and a TR of 5 sec. In the multiband technique, TR was set to match the slower single-band acquisition and thus resulted in one-forth the duty cycle as compared with the single-band approach.
Quantitative measures obtained for the single-subject experiment shown in Fig. 5 also validated the consistency of the data between the two different acquisition strategies: Fig. 6a displays histograms of σ~ calculated over the whole brain for the entire time series for the (30 sec on/30 sec off) acquisition with both the multi- and single-band methods, showing that they are virtually the same. This implies that in voxels where a task/stimulus evoked response, σ~ was biased by that response; however, when considering the entire brain, such voxels represented a small fraction. The histogram in Fig. 6b illustrates t scores for the same data set, revealing the presence of a virtually identical distribution for all pixels, consistent with the results of σ~ shown in Fig. 6a. The scatterplot between the t scores from the single- and multiband acquisitions (Fig. 6c) demonstrates that on a pixel-by-pixel basis, the t scores of the two different methods are also matched. Consistent with these observations, the “activated” regions for the four slices in Fig. 5, defined as pixels with a t score better than 2.5 (and a minimum number of connected neighbors of four pixels), consisted of 555 pixels with a mean t score of 5.86 for the single-band versus 504 activated pixels and a mean t score of 5.98 for the four-band acquisition and, as previously stated, displayed good spatial correspondence for the two methods.
FIG. 6.
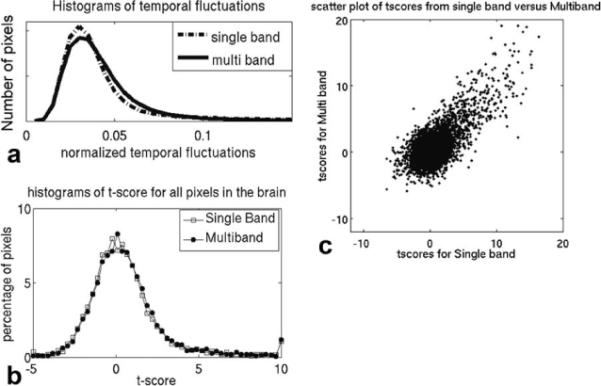
a: Histograms of the normalized temporal fluctuations in each pixel (σ~t), calculated experimentally from one study (the same as in Fig. 5), acquired with both multiband and single-band methods. b: Histograms of all the t scores in the brain (shown in Fig. 5) for both multiband and single-band acquisitions from an experiment with 2 × 2 × 2mm3 resolution and TR = 5 sec. The bulk random fluctuations are described by the bell-shaped distribution of t scores. c: Scatterplot of the t scores from the single-band versus multiband acquisitions in Fig. 5.
The presence of residual aliasing leading to temporal correlation artifacts between slices that were acquired simultaneously was also investigated. The same simultaneous finger tapping/visual stimulation paradigm employed for data in Figs. 5 and 6 was used. A set of four slices was chosen with simultaneous excitation, with the condition that only one slice is expected to display stimulus- and/or task-evoked activation. Slices through the visual cortex are expected to exhibit a strong stimulus-correlated response for the flickering checkerboard paradigm. Using an a region-of-interest (ROI) covering a subset of pixels with a strong visual response, the spatially matched ROIs (which were aliased onto each other in the original multiband acquisition) in the three other slices were analyzed for spurious activation due to residual unaliased signals. The time courses and the ROIs are depicted in Fig. 7a. A large stimulus-evoked signal change in the visual cortex ROI was observed as expected; the aliased slices were, however, free of any significant stimulus-correlated signal alteration. The robustness of the unaliasing is further emphasized because the intrinsic image signal intensity in the visual cortex ROI was ~4 to 6 times the signal intensity in the aliased ROIs and the stimulus-evoked signal change in the visual cortex ROI was comparable to the absolute signal in the aliased ROIs. Thus, any residual signal aliasing would have been easily identifiable. The analogous evaluation was also performed for PE undersampling that was employed in the L-R direction. Figure 7b shows the location of the ROIs and the time courses. In this case, the ROI selected in the visual cortex aliases onto ROIs that are outside the brain in the L-R direction. The signal amplitude in the visual cortex ROI was more than an order of magnitude larger than the signal outside the brain. The time courses outside the brain, however, did not exhibit obvious stimulus-correlated signal changes.
FIG. 7.
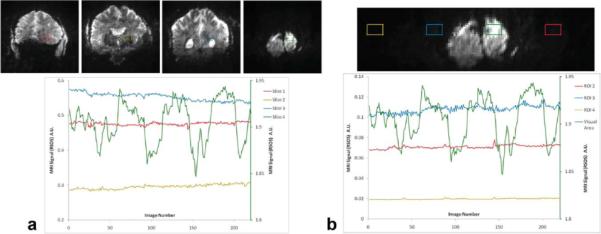
Evaluation of correlated temporal fluctuations to residual unaliasing. a: Top: Four simultaneously excited and acquired slices. Bottom: signal change from four simultaneously acquired ROIs, chosen so that the ROI in the visual cortex (rightmost slice) shows strong stimulus-induced activation. The signal from the visual cortex is ~5 times larger than the signal in the aliased slices and is the only signal measured with the y-axis on the right of the plot. The signal changes in the ROIs in the visual cortex are ±0.05 (a.u.) and the mean signal in the aliased ROIs is 0.46, 0.28, and 0.56, respectively. b: Top: coronal slice with functional signal changes in a small ROI. Bottom, signal changes in the four aliased ROIs from 4-fold undersampling in the PE direction. The signal from the visual cortex is the only signal measured with the y-axis on the right of the plot.
Application Validation
The use of multiband acquisitions enables coverage of a larger fMRI volume without increasing the repetition time. With the large FOV of 256 × 256 × 176mm3, a spatial resolution of 2 × 2 × 2mm3 was sampled in 1.25 sec, by applying a 4-fold PE undersampling and four-band acquisition, yielding a net acceleration of 16. The complex visuomotor dissociation paradigm employed is known to generate activation dispersed over the whole brain (26), and such disperse activation was observed with the 16-fold accelerated multiband data (Fig. 8). Engagement of many higher-order cognitive elements including the occipital, parietal, frontal, limbic, and temporal lobes, as well as the thalamus, basal ganglia, and the cerebellum, was detected as expected (26). Because of the complexity and the size of the data processing involved, correction for detrimental, physiologically induced fluctuations has not yet been incorporated into these data. Especially at ultrahigh magnetic fields, correction of respiratory effects is critical and is used routinely for conventional fMRI studies (27). Similarly, full-phase-reference EPI corrections, which could be used to compensate for higher-order variations in field inhomogeneities, have not yet been applied. Furthermore, the data were not corrected for potential rigid body motion. Thus, in principle, the underlying EPI images, as well as functional contrast-to-noise ratio, can be further improved.
FIG. 8.
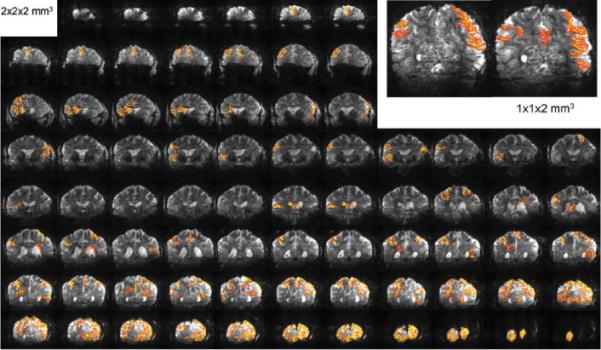
Functional activation maps based on cross-correlation and a 2D four-neighbor cluster, for a complex visuomotor dissociation task acquired for 88 slices in 1.25 sec with 2 × 2 × 2mm3 resolution. A total of 252 images were obtained with the subjects performing the task during three blocks of on-off periods. Inset: representative coronal slices from a functional scan with 1 × 1 × 2mm3 resolution and TR = 1.5 sec. The FOV was squeezed in the left-right direction, yielding an effective reduction and maximal aliasing of 16.
Even though a 4-fold reduction in the PE direction was applied, the effective maximal aliasing in the PE direction in the 2mm isotropic data (Fig. 8) was closer to 3 due to the conventionally employed extended FOV for EPI acquisitions, which was used to prevent residual aliasing of fat. Using an even tighter FOV in the PE direction and achieving maximal aliasing in both PE and slice directions, it was possible to attain single-shot in-plane resolutions of 1mm (with a slice thickness of 2mm) with a TR of 1.5 sec, again covering 88 slices. Figure 8 (inset) displays representative slices from such an fMRI study. The functional paradigm was the same as in the isotropic 2mm data. Again, activation maps in color are superimposed on EPI images from one time point in the fMRI time series. The underlying achievable image quality illustrates the SNR available at 7 T for high-resolution fMRI.
DISCUSSION
High magnetic fields and parallel imaging are complementary and synergistic techniques (13,28,29). High fields enable the use of larger reduction factors in PPI, while the field-dependent gains in SNR at high magnetic fields mitigate the SNR loss inherent in parallel imaging. At 7 T, 1D reduction factors of 4 along the PE dimension are comfortably used, attaining mean g-factors substantially less than 2 (22). The addition of an orthogonal aliasing direction provides an efficient way to further reduce the data acquisition time. To this end, we have demonstrated here the use of multibanded RF pulses to simultaneously excite and acquire multiple slices spaced sufficiently apart to allow for postprocessing separation of the aliased signals. Consequent SNR losses in this approach are smaller than what one encounters with 2D _k_-space undersampling in two orthogonal PE directions. With 1D PE undersampling and multiband slice aliasing, the impact on SNR can be described as SNRred=SNRfull(gPEgslRPE)−1, where g PE is the g-factor due to undersampling in the PE direction, R PE is the degree of undersampling in the PE direction, and g sl is the g-factor due to slice aliasing with the RF. In contrast, SNR is reduced by factor gPE1gPE2RPE1RPE2 when undersampling is employed along two orthogonal PE directions. Thus, the increase in noise of a 16-fold accelerated image achieved by 4-fold reduced phase encoding in two orthogonal directions, compared with the multiband strategy using the combination of 1D _k_-space undersampling with slice aliasing, is a factor of 2 less for a four-band acquisition. In 1D undersampling, in the PE direction, higher accelerations and thus aliasing lead to higher g-factors. Analogous increases in the g-factor for the multiband acquisition occurs as the spacing between the different bands is reduced.
The noise amplification from parallel imaging reconstruction, reported as averaged whole-brain g-factors from the three subjects, was 1.05 ± 0.02, 1.26 ± 0.12, and 1.46 ± 0.13 for 1D PE, multislice, and 2D with 1D PE together with multislice undersampling, respectively, illustrating very attractive parallel imaging performance. The 21% reduction in SNR, reflecting the average g-factor of 1.26 due to slice unaliasing, did not commensurately affect the temporal signal fluctuations with the multiband acquisition (Table 1). This indicates that with 2× 2 × 2mm3 GE-EPI at 7 T, even after SNR losses due to multiband parallel imaging, fMRI time series fluctuation is dominated by physiological “noise” contributions. Similar conclusions were reached in earlier studies of fMRI with the use of 1D acceleration along the PE direction (22,30). The histograms comparing the σ~ between the single and multiband experiments exhibited some minor variations. These small differences are likely due to the sequential acquisition of the two time series, each with slightly different contributions of physiologic fluctuations.
The parallel imaging performance achieved in this study can be compared with the previously published results of Adriany et al. (16,17) for a “geometrically adjustable coil,” which is comparable to the coil used in this study. For an effective maximal aliasing of 3 × 4 (L-R × A-P), Adriany et al. (17) reported a mean g-factor for a single axial slice to be 1.97 for conventional 2D PE acceleration; this g-factor can be compared against the g-factor of 1.46 ± 0.13 achieved for 16-fold acceleration in the current study over the whole brain. The difference, however, is largely due to the fact that maximal aliasing is not 16 or 12 in all slices for the whole-brain study. The measured 1D g-factors in this study are larger than those reported for the geometrically adjustable coil (16,17). This is in part due to the differences in construction of individual elements and the tighter fit of the geometrically adjustable coil. Thus, further gains in parallel imaging performance and fMRI coverage and/or temporal resolution can be expected with improved coils.
Due to the geometric design of our coil, the encoding capabilities are such that coronal and sagittal slices result in the most optimal implementation of the multiband approach (lowest g-factors). We used a coronal slice orientation for these experiments. Choosing the sagittal plane for multiband excitation would have resulted in fewer slices needed for whole-brain coverage, and thus shorter TR, and would have been equally feasible. However, sagittal slices with phase encoding along the A-P direction to minimize the phase-encoding steps, result in artifacts over large parts of the brain due to eye motion; with coronal slices (and a L-R PE), such artifacts are restricted to the frontal areas. The performance/feasibilities of other orientations (including oblique orientations) have yet to be investigated.
The GRAPPA reconstruction algorithm employed for this study is one option for reconstruction of the aliased data. For reconstruction of multiband GE-EPI data, the GRAPPA algorithm was readily implemented with optimal use of corrections for even/odd echoes. Inclusion of the phase is possible with a SENSE-type formulation but needs to be solved iteratively, similar to the algorithms from Liu et al. (31). Notably, as demonstrated in Moeller et al. (15) for GE imaging, both GRAPPA and SENSE reconstruction can yield similar results (data not shown) when no additional corrections are needed. The separation of reduced FOV _k_-space from aliased slices is different from conventional applications of GRAPPA. As emphasized in Keith and Heberlein et al. (32), GRAPPA can be cast in the framework of kriging, which is a direct data interpolation. Within this framework, it is not surprising that interpolation with reduced FOV data is feasible and successful. The separate unaliasing of two orthogonal directions has previously been shown to be preferable to doing a joint unaliasing of two dimensions (23). From an implementation viewpoint, each dimension can be treated separately, and the total aliasing can be allowed to exceed the number of channels. This is, however, another difference to the mathematically accurate formulation for, e.g., SENSE unaliasing. With a GRAPPA-type separation, a full FOV _k_-space is reconstructed for each channel and each slice, and additional temporal/spatial filtering or physiologic fluctuation correction dynamic off-resonance changes in k-space (DORK) (27) strategies for enhancing fMRI sensitivity should in principle also be applicable to the multiband reconstructed data.
As with conventional PPI, the use of multibanded acquisitions can be implemented at lower magnetic fields such as 3 T, albeit with higher g-factors for an identical coil and sample when compared to 7 T. PPI performance and SNR are highly dependent on the performance of the RF coil. It is likely that with improved and optimized RF coils, spatial resolutions of 2–3mm and TRs of ~1–2 sec over the entire brain may be achievable at 3 T.
Whole-brain coverage at high magnetic fields can be problematic (especially for EPI) due to ubiquitous field inhomogeneities and the difficulty in achieving a uniform field over the entire brain. In addition to conventional EPI artifacts due to inhomogeneous amplitudes of static field, there is also the potential for this effect to limit the performance of PPI reconstruction. This problem, however, is not specific to multiband approaches as it will be present in most any high-field imaging approach. Thus, careful static field shimming is paramount to the success of these types of imaging approaches.
Finally, the use of multiband RF excitation does increase the peak RF power requirements. In addition, when the use of the multiband RF excitation is employed to shorten the TR relative to a single-band acquisition while retaining the same volume coverage, the average Specific absorption rate (SAR) is also increased due to faster repetition of the RF pulses. Correspondingly, if the same TR is used, but the volume coverage is extended, the average SAR is also increased. The potentially significant increase in the SAR therefore makes the multiband RF excitation scheme suited primarily for low SAR sequences such as GE-EPI, especially at high magnetic fields. Additionally, although presented in this paper for contiguous full coverage of the head, multislice excitation can also be used for excitation of noncontiguous regions, each of which may be composed of one or more slices. In such cases, fewer slices (and less slice aliasing) are needed to achieve the same, but gapped, volumetric coverage, and the spatial separation between simultaneously excited slices is increased. Both of these modifications, while reducing SAR, will also reduce g-factor noise contribution to SNR and fMRI performance.
CONCLUSION
The use of PPI at high magnetic fields has been shown to be extremely advantageous for minimizing the many challenges for high-resolution, high-speed imaging commonly encountered at high fields. In this work, we have further demonstrated this advantage by accelerating our data acquisition along the slice direction with the use of multibanded RF pulses. In doing so, we have shown that acceleration factors of 16 on data with maximal 2D aliasing (using both PE and slice acceleration) of 12 to 16 are readily achievable at 7 T with a 16-channel coil for fMRI, allowing for isotropic spatial resolutions of 2mm or 1 × 1 × 2mm3 over the whole brain, with TRs of 1.25 sec and 1.5 sec, respectively. Notably, the resultant images retain sufficient static SNR to tolerate further SNR losses due to higher acceleration factors. As such, further increases in reduction factors and/or acceleration rates with appropriate coils at high fields should continue to provide significant advantages for fMRI.
ACKNOWLEDGMENTS
This work was supported by the W.M. Keck Foundation, and the MIND Institute.
Grant sponsor: NIH; Grant numbers: P41 RR08079, R01 MH070800, RO1 EB008645, R01 EB000331, EB 000513, CA 76535 and P30 NS057091.
Footnotes
Presented in part at the International Society of Magnetic Resonance in Medicine 2008:2366
REFERENCES
- 1.Kwong KK, Belliveau JW, Chesler DA, Goldberg IE, Weisskoff RM, Poncelet BP, Kennedy DN, Hoppel BE, Cohen MS, Turner R, et al. Dynamic magnetic resonance imaging of human brain activity during primary sensory stimulation. Proc Natl Acad Sci U|S|A. 1992;89:5675–5679. doi: 10.1073/pnas.89.12.5675. [DOI] [PMC free article] [PubMed] [Google Scholar]
- 2.Ogawa S, Tank DW, Menon R, Ellermann JM, Kim SG, Merkle H, Ugurbil K. Intrinsic signal changes accompanying sensory stimulation: functional brain mapping with magnetic resonance imaging. Proc Natl Acad Sci U|S|A. 1992;89:5951–5955. doi: 10.1073/pnas.89.13.5951. [DOI] [PMC free article] [PubMed] [Google Scholar]
- 3.Vaughan JT, Garwood M, Collins CM, Liu W, DelaBarre L, Adriany G, Andersen P, Merkle H, Goebel R, Smith MB, Ugurbil K. 7T vs. 4T: RF power, homogeneity, and signal-to-noise comparison in head images. Magn Reson Med. 2001;46:24–30. doi: 10.1002/mrm.1156. [DOI] [PubMed] [Google Scholar]
- 4.Ugurbil K, Adriany G, Akgün C, Andersen P, Chen W, Garwood M, Gruetter R, Henry P-G, Marjanska M, Moeller S, Van de Moortele PF, Prüssmann K, Tkac I, Vaughan JT, Wiesinger F, Yacoub E, Zhu XH. High magnetic fields for imaging cerebral morphology, function and biochemistry. In: Robitaille PML, Berliner LJ, editors. Biological magnetic resonance: ultra high field magnetic resonance imaging: volume 26. Springer; New York: 2006. pp. 285–342. [Google Scholar]
- 5.Ugurbil K, Adriany G, Andersen P, Chen W, Garwood M, Gruetter R, Henry PG, Kim SG, Lieu H, Tkac I, Vaughan T, Van De Moortele PF, Yacoub E, Zhu XH. Ultrahigh field magnetic resonance imaging and spectroscopy. Magn Reson Imaging. 2003;21:1263–1281. doi: 10.1016/j.mri.2003.08.027. [DOI] [PubMed] [Google Scholar]
- 6.Yacoub E, Harel N, Ugurbil K. High-field fMRI unveils orientation columns in humans. Proc Natl Acad Sci U|S|A. 2008;105:10607–10612. doi: 10.1073/pnas.0804110105. [DOI] [PMC free article] [PubMed] [Google Scholar]
- 7.Yacoub E, Shmuel A, Logothetis N, Ugurbil K. Robust detection of ocular dominance columns in humans using Hahn spin echo BOLD functional MRI at 7 tesla. Neuroimage. 2007;37:1161–1177. doi: 10.1016/j.neuroimage.2007.05.020. [DOI] [PMC free article] [PubMed] [Google Scholar]
- 8.Uludag K, Muller-Bierl B, Ugurbil K. An integrative model for neuronal activity-induced signal changes for gradient and spin echo functional imaging. Neuroimage. 2009;48:150–165. doi: 10.1016/j.neuroimage.2009.05.051. [DOI] [PubMed] [Google Scholar]
- 9.Yang Y, Mattay VS, Weinberger DR, Frank JA, Duyn JH. Localized echo-volume imaging methods for functional MRI. J Magn Reson Imaging. 1997;7:371–375. doi: 10.1002/jmri.1880070220. [DOI] [PubMed] [Google Scholar]
- 10.Rabrait C, Ciuciu P, Ribes A, Poupon C, Le Roux P, Dehaine-Lambertz G, Le Bihan D, Lethimonnier F. High temporal resolution functional MRI using parallel echo volumar imaging. J Magn Reson Imaging. 2008;27:744–753. doi: 10.1002/jmri.21329. [DOI] [PubMed] [Google Scholar]
- 11.Larkman DJ, Hajnal JV, Herlihy AH, Coutts GA, Young IR, Ehnholm G. Use of multicoil arrays for separation of signal from multiple slices simultaneously excited. J Magn Reson Imaging. 2001;13:313–317. doi: 10.1002/1522-2586(200102)13:2<313::aid-jmri1045>3.0.co;2-w. [DOI] [PubMed] [Google Scholar]
- 12.Wiesinger F, Boesiger P, Pruessmann KP. Electrodynamics and ultimate SNR in parallel MR imaging. Magn Reson Med. 2004;52:376–390. doi: 10.1002/mrm.20183. [DOI] [PubMed] [Google Scholar]
- 13.Wiesinger F, Van de Moortele PF, Adriany G, De Zanche N, Ugurbil K, Pruessmann KP. Parallel imaging performance as a function of field strength—an experimental investigation using electrodynamic scaling. Magn Reson Med. 2004;52:953–964. doi: 10.1002/mrm.20281. [DOI] [PubMed] [Google Scholar]
- 14.Breuer FA, Blaimer M, Mueller MF, et al. Controlled aliasing in volumetric parallel imaging (2D CAIPIRINHA) Magn Reson Med. 2006;55:549–56. doi: 10.1002/mrm.20787. [DOI] [PubMed] [Google Scholar]
- 15.Adriany G. A Geometrically adjustable 16 channel transceive transmission line arrays for 7tesla. ISMRM. 2005:673. [Google Scholar]
- 16.Adriany G, Van de Moortele PF, Ritter J, Moeller S, Auerbach EJ, Akgun C, Snyder CJ, Vaughan T, Ugurbil K. A geometrically adjustable 16-channel transmit/receive transmission line array for improved RF efficiency and parallel imaging performance at 7 tesla. Magn Reson Med. 2008;59:590–597. doi: 10.1002/mrm.21488. [DOI] [PubMed] [Google Scholar]
- 17.Bruder H, Fischer H, Reinfelder HE, Schmitt F. Image reconstruction for echo planar imaging with nonequidistant k-space sampling. Magn Reson Med. 1992;23:311–323. doi: 10.1002/mrm.1910230211. [DOI] [PubMed] [Google Scholar]
- 18.Pruessmann KP, Weiger M, Scheidegger MB, Boesiger P. SENSE: sensitivity encoding for fast MRI. Magn Reson Med. 1999;42:952–962. [PubMed] [Google Scholar]
- 19.Breuer F, Blaimer M, Seiberlich N, Jakob P, Griswold M. A general formulation for quantitative g-factor calculation in GRAPPA reconstructions. ISMRM. 2008:10. doi: 10.1002/mrm.22066. [DOI] [PubMed] [Google Scholar]
- 20.Griswold MA, Jakob PM, Heidemann RM, Nittka M, Jellus V, Wang J, Kiefer B, Haase A. Generalized autocalibrating partially parallel acquisitions (GRAPPA) Magn Reson Med. 2002;47:1202–1210. doi: 10.1002/mrm.10171. [DOI] [PubMed] [Google Scholar]
- 21.Moeller S, Van de Moortele PF, Goerke U, Adriany G, Ugurbil K. Application of parallel imaging to fMRI at 7 tesla utilizing a high 1D reduction factor. Magn Reson Med. 2006;56:118–129. doi: 10.1002/mrm.20934. [DOI] [PubMed] [Google Scholar]
- 22.Blaimer M, Breuer FA, Mueller M, Seiberlich N, Ebel D, Heidemann RM, Griswold MA, Jakob PM. 2D-GRAPPA-operator for faster 3D parallel MRI. Magn Reson Med. 2006;56:1359–1364. doi: 10.1002/mrm.21071. [DOI] [PubMed] [Google Scholar]
- 23.Blaimer M, Breuer FA, Seiberlich N, Mueller MF, Heidemann RM, Jellus V, Wiggins G, Wald LL, Griswold MA, Jakob PM. Accelerated volumetric MRI with a SENSE/GRAPPA combination. J Magn Reson Imaging. 2006;24:444–450. doi: 10.1002/jmri.20632. [DOI] [PubMed] [Google Scholar]
- 24.Didier Flament JME, Seong-Gi K, Kamil U, Ebner TJ. Functional magnetic resonance imaging of cerebellar activation during the learning of a visuomotor dissociation task. Hum Brain Mapp. 1996;4:210–226. doi: 10.1002/hbm.460040302. [DOI] [PubMed] [Google Scholar]
- 25.Ellermann JM, Siegal JD, Strupp JP, Ebner TJ, Ugurbil K. Activation of visuomotor systems during visually guided movements: a functional MRI study. J Magn Reson. 1998;131:272–285. doi: 10.1006/jmre.1998.1379. [DOI] [PubMed] [Google Scholar]
- 26.Pfeuffer J, Van de Moortele PF, Ugurbil K, Hu X, Glover GH. Correction of physiologically induced global off-resonance effects in dynamic echo-planar and spiral functional imaging. Magn Reson Med. 2002;47:344–353. doi: 10.1002/mrm.10065. [DOI] [PubMed] [Google Scholar]
- 27.Wiesinger F, Van de Moortele PF, Adriany G, De Zanche N, Ugurbil K, Pruessmann KP. Potential and feasibility of parallel MRI at high field. NMR Biomed. 2006;19:368–378. doi: 10.1002/nbm.1050. [DOI] [PubMed] [Google Scholar]
- 28.Ohliger MA, Grant AK, Sodickson DK. Ultimate intrinsic signal-to-noise ratio for parallel MRI: electromagnetic field considerations. Magn Reson Med. 2003;50:1018–1030. doi: 10.1002/mrm.10597. [DOI] [PubMed] [Google Scholar]
- 29.de Zwart JA, van Gelderen P, Golay X, Ikonomidou VN, Duyn JH. Accelerated parallel imaging for functional imaging of the human brain. NMR Biomed. 2006;19:342–351. doi: 10.1002/nbm.1043. [DOI] [PubMed] [Google Scholar]
- 30.Liu C, Moseley ME, Bammer R. Simultaneous phase correction and SENSE reconstruction for navigated multi-shot DWI with non-cartesian k-space sampling. Magn Reson Med. 2005;54:1412–1422. doi: 10.1002/mrm.20706. [DOI] [PubMed] [Google Scholar]
- 31.Moeller S, Auerbach E, van de Moortele P-F, Adriany G, Ugurbil K. fMRI with 16 fold reduction using multibanded multislice sampling. ISMRM. 2008:2366. [Google Scholar]
- 32.Heberlein Keith A, Hu X. Kriging and GRAPPA: a new perspective on parallel imaging reconstruction. ISMRM. 2006:2465. [Google Scholar]