Interferon Gamma Restores Breast Cancer Sensitivity to Fulvestrant by Regulating STAT1, IRF1, NFκB, BCL2 Family Members, and Signaling to Caspase-dependent Apoptosis (original) (raw)
. Author manuscript; available in PMC: 2011 May 1.
Abstract
Antiestrogens are effective therapies for the management of many estrogen receptor-alpha positive (ER+) breast cancers. Nonetheless, both de novo and acquired resistance occur and remain major problems in the clinical setting. Interferon gamma (IFNγ) is an inflammatory cytokine that induces the expression and function of Interferon Regulatory Factor-1 (IRF1), a tumor suppressor gene that can increase antiestrogen responsiveness. We show that IFNγ but not IFNα, IFNβ, or Fulvestrant (ICI; ICI 182,780; Faslodex) induces IRF1 expression in antiestrogen resistant MCF7/LCC9 and LY2 cells. Moreover, IFNγ restores the responsiveness of these cells to Fulvestrant. Increased IRF1 activation suppresses NFκB p65 (RELA) activity and inhibits the expression of prosurvival (BCL2, BCL-W), and induces the expression of proapoptotic members (BAK, mitochondrial BAX) of the BCL2 family. This molecular signaling is associated with activation of STAT1, and leads to increased mitochondrial membrane permeability, activation of CASP7, CASP8, and CASP9, and induction of apoptosis but not autophagy. While antiestrogen resistant cells are capable of inducing autophagy through IFN-mediated signaling, their ability to do so through antiestrogen-regulated signaling is lost. The abilities of IFNγ to activate CASP8, induce apoptosis, and restore antiestrogen sensitivity, are prevented by siRNA targeting IRF1, while transient overexpression of IRF1 mimics the effects of IFNγ treatment. These observations support the exploration of clinical trials combining antiestrogens and compounds that can induce IRF1, such as IFNγ, for the treatment of some ER+ breast cancers.
Keywords: apoptosis, autophagy, BCL2, breast neoplasms, caspases, cell death, drug resistance, estrogen receptor modulators, Fulvestrant, interferons, Tamoxifen
Introduction
Breast cancer is the second most common cause of cancer death in women, with more than 40,000 women dying of breast cancer in the United States each year. Over 180,000 new cases of invasive breast cancer will be diagnosed in the U.S. within the next twelve months (1), almost 70% of which will express detectable levels of the estrogen receptor-alpha (ER) protein (2). While antiestrogen or aromatase therapies are effective treatments for many of these ER+ breast cancers, a significant proportion either will fail to respond initially, or will eventually recur.
Antiestrogens inhibit the function of ER, a nuclear transcription factor that directs the expression of genes controlling cell proliferation and cell fate (2, 3). The most frequently prescribed antiestrogen is the non-steroidal selective estrogen receptor modulator (SERM) Tamoxifen (TAM), which is highly effective in both the treatment of ER+ breast tumors and in reducing breast cancer incidence in women at high risk for the disease. However, many initially sensitive ER+ tumors acquire resistance to antiestrogen therapy, whereas the remainder exhibit de novo or intrinsic resistance (4). The steroidal antiestrogen Fulvestrant (ICI; ICI 182,780; Faslodex) induces significant clinical responses in patients whose tumors are Tamoxifen resistant (5). Indeed, the effectiveness of ICI in patients with Tamoxifen-resistant disease is similar to that of the aromatase inhibitor anastrozole (6). Several clinical trials have shown ICI to be a viable alternative to non-steroidal antiestrogens and aromatase inhibitors as a first-line endocrine treatment (7).
ICI is a selective estrogen receptor down-regulator (SERD) that prevents receptor dimerization and stimulates degradation of the ERα protein (8, 9). As a pure antagonist of ER action, ICI is not associated with the increased risk for endometrial cancer seen with Tamoxifen (10). However, resistance to ICI can also arise in ER+ breast tumors (3). Understanding the mechanisms of resistance to antiestrogens, and developing novel strategies to restore sensitivity to antiestrogen therapy once resistance has developed, is essential to improving survival for many patients with ER+ breast cancer.
Breast cancer cells can acquire antiestrogen resistance through changes in the molecular signaling that controls cell proliferation and apoptosis (4). To test this hypothesis, several ER+ variant cell lines have been derived from estrogen-dependent and antiestrogen-sensitive MCF-7 breast cancer cells. MCF7/LCC1 cells are estrogen independent but remain responsive to antiestrogens (11); MCF7/LCC9 cells are derivatives of MCF7/LCC1 that were selected for acquired resistance to ICI (12). LY2 cells were derived by selecting MCF-7 cells against the Raloxifene analog LY 117018) (13, 14). Similar to what is seen in breast cancer patients with multiple endocrine resistance, MCF7/LCC9 and LY2 cells are estrogen-independent and have also acquired cross-resistance to the nonsteroidal antiestrogen Tamoxifen (12, 13).
Analysis of the transcriptomes of the MCF7/LCC1 and MCF7/LCC9 breast cancer models by serial analysis of gene expression (SAGE) and gene expression microarrays identified several differentially expressed genes likely to contribute to the endocrine resistant phenotype, including upregulation of p65 NFκB (RELA) and downregulation of interferon regulatory factor-1 (IRF1) (15).
IRF1 is a nuclear transcription factor that promotes apoptosis following DNA damage (16). IRF1 can signal to apoptosis with (17) or without induction of p21cip1 (18) or p27kip1 (19), and through caspase-1 (CASP1) (16), CASP3 (20), CASP7 (20, 21), CASP8 (20), and/or FasL (22). IRF1 also induces apoptosis in a p53-dependent or p53-independent manner (16, 18). While loss of p53 activity is common in breast cancer (23), this disease remains one of the most initially responsive solid tumors to systemic therapies (24). Thus IRF1, which can signal through both p53-dependent and p53-independent mechanisms (16, 18), may be an important signaling molecule for integrating and regulating breast cancer cell survival. A dominant negative IRF1 (dnIRF1), which lacks the carboxyl-terminal transcriptional activation domain, reduces antiestrogen sensitivity in MCF7 and T47D breast cancer cells by suppressing apoptosis (25) and altering the activity of CASP3 and/or CASP7 (20).
IRF1 was initially identified because of its transcriptional activation of type I interferon (IFN) genes. IFNs are a family of cytokines that have multiple biological effects including immunomodulatory, antiviral, antiproliferative, antigen modulation, cell differentiation, and apoptotic effects (26). Once activated by binding IFN, their specific cell membrane receptors activate the JAK-STAT pathway, which results in the regulation of IFN-stimulated genes (ISGs) including IRF1 (27, 28). Early reports described the ability of some IFNs to enhance the growth inhibitory actions of Tamoxifen (29–31) but the precise mechanisms through which this occurs have remained largely unclear. Furthermore, whether or how IFNγ affects sensitivity to ICI in antiestrogen sensitive and resistant breast cancer cells is unknown.
The principal goals of this study were to assess whether the restoration of IRF1 expression by IFNγ can reverse ICI resistance by enabling ICI to again induce breast cancer cell death, and to investigate the molecular mechanism by which ICI sensitivity is restored. We show here that treatment with a low does of IFNγ is sufficient to restore sensitivity to ICI, and synergistically enhances the induction of apoptosis in antiestrogen resistant cells. With IFNγ treatment, IRF1 protein expression and transcriptional activity are significantly increased while those of NFκB p65 are reduced. IRF1 siRNA blocks both IFNγ-mediated repression of NFκB p65 activity and impairs ICI responsiveness in sensitive MCF7/LCC1 cells. These observations imply that upregulating IRF1 may be a successful approach in the treatment of ER+ breast cancers that have acquired resistance to antiestrogen therapy. These data provide support for considering the design of clinical studies combining antiestrogens and compounds that can induce IRF1, such as IFNγ, for the treatment of ER+ breast cancers.
Materials and Methods
Cell Culture and Reagents
MCF-7 cells were routinely grown in improved minimal essential media (IMEM; Mediatech Inc, Manassas, VA) with phenol red and supplemented with 5% fetal bovine serum. MCF7/LCC1 (11), MCF7/LCC9 (12) and MCF7/LY2 cells (13, 14) were routinely cultured in phenol red-free IMEM supplemented with 5% charcoal-stripped calf serum (CCS; CCS-IMEM). All cells were maintained in a humidified atmosphere at 37°C and 95% air/5% CO2. Interferon α and β were purchased from Calbiochem (La Jolla, CA). Human recombinant interferon gamma (IFNγ) was purchased from Roche (Mannheim, Germany), and ICI 182,780 (ICI, Faslodex) from Tocris Bioscience (Ellisville, MO). All cells were shown to be free of Mycoplasma spp. contamination. We confirmed the genetic lineage of the three variant cell lines as being derived from the original MCF-7 cell line by DNA fingerprinting using genetic markers at nine different loci (CSF1PO, TPOX, TH01, vWA, D16S539, D7S820, D13S317, D5S818 and the Y chromosome-specific Amelogenin).
Cell Proliferation
Cell proliferation assays were performed using the Cell Counting Kit-8 (CCK-8; Dojindo Laboratories, Kumamoto, Japan). Cells were seeded at a density of 5–6 x 10³ cells per well in 96-well plates, and 24 h later were treated with the indicated concentrations of drug in CCS-IMEM. Cells were incubated with the drugs for 6 days, with fresh media containing either drug and/or vehicle being replaced on day 3 where appropriate. After transfection with IRF1 siRNA by Amaxa, cells were seeded at a density of 1 x 10⁴ cells per well in 96-well plates, and 24 h later were treated with the indicated concentrations of ICI or vehicle in CCS-IMEM. Cell numbers were measured as the absorbance (450 nm) of reduced WST-8.
Mitochondria Membrane Potential
Changes in mitochondrial membrane potential (MMP) were measured using the MitoProbe™ JC-1 Assay kit for flow cytometry (Invitrogen, Carlsbad, CA). Cells were first transfected with control or IRF1 siRNA by Amaxa and 24 h later seeded at a density of 2 x 10⁵ cells per well in 6-well plates. Twenty-four hours after seeding, cells were treated with the indicated concentrations of drug and/or vehicle in CCS-IMEM for 3 days, media was removed, and the cells were trypsinized and resuspended in PBS (Invitrogen). Mitochondria were stained by JC-1 according to the manufacturer’s instructions and the fluorescence detected and measured by fluorescence activated cell sorting (performed by LCCC FACS Shared Resource). Where appropriate, cells were also treated with 20 μM caspase 8 inhibitor II (Merck KGaA, Darmstadt, Germany) or DMSO vehicle, with the drugs indicated but without IRF1 siRNA, for 2 days before analysis.
Immunostaining and Confocal Microscopy
Cells (1 x 10⁵) were seeded onto 18 x 18 mm glass coverslips and the following day treated with 100 nmol/L ICI 182,780 and/or 100 IU/ml IFNγ in CCS-IMEM for 48 hours. Cells were then fixed in 4% paraformaldehyde for 20 min at room temperature and then permeabilized in 0.1% Triton X-100, 0.1% sodium citrate for 5 min at room temperature. Cells were sequentially incubated with primary antibody (anti-p65 at 1:200 dilution from Upstate Biotechnology, Charlottesville, VA; anti-IRF1 at 1:100 dilution from BD Biosciences, San Jose, CA) and fluorophore-conjugated secondary antibody Alexa Fluor® 488 goat anti-rabbit IgG and Alexa Fluor® 594 goat anti-mouse IgG (Invitrogen Molecular Probes, Eugene, OR). 4′,6-diamidino-2-phenylindole dihydrochloride (DAPI) were obtained from Molecular Probes, Inc. (Eugene, OR). Where appropriate, DAPI was added to visualize the nucleus, and non-confocal DAPI images were acquired using Hg lamp excitation and a UV filter set. Confocal microscopy was performed using an Olympus IX-70 confocal microscope with 405 nm, 488 nm, and 543 nm excitation lasers. Fluorescence emission was separately detected for each fluorophore in optical sections <1 μm in thickness (pinhole set to achieve 1 Airy unit).
Suppression of IRF1 with siRNA
To down-regulate IRF1 mRNA expression, we transfected a Silencer Select Pre-designed siRNA specific for IRF1 and a non-coding control siRNA (Applied Biosystems Inc, Foster, CA) using the Nucleofector ™ kit V from Amaxa Inc (Gaithersburg, MD). Two million cells were electroporated with 0.1 nmol of siRNA according to the manufacturer’s protocol. Twenty-four hours later, cells were split into either 96-well plates, 12-well plates, or 6-well plates, treated, and used for measuring cell proliferation, gene expression (promoter-reporter activity), MMP, or protein expression.
Transcriptional Reporter Assays
Heterologous promoter constructs containing the luciferase gene driven by tandem interferon stimulated response elements (3 x ISRE-luc reporter plasmid) or NFκB p65/RELA sites (the p65-luc reporter plasmid) were purchased from Stratagene (La Jolla, CA). The BCL2 promoter-luc plasmids (LB322: the full length, LB124: promoter-1 and upstream elements, LB334: only promoter-1, LB33)5: promoter-2 and LB556: minimal promoter-2) were a kind gift from Dr. Linda Boxer (Stanford University). The sequence of each construct can be found in the original studies (32, 33). Cells were seeded at a density of 1x 10⁵ cells per well in 12-well plates. The following day, cells were transfected with 0.65 μg of luciferase reporter plasmid and 0.02 μg phRL-SV40-Renilla (Promega) per well using the FuGENE 6 transfection reagent (Roche). Five hours post-transfection, media were changed and cells were treated with either drug and/or vehicle for 48 h. Subsequently, cells were lysed and activation of the luciferase constructs was measured using the Dual Luciferase Assay Kit (Promega). Luminescence was quantified using a Lumat LB 9501 luminometer (EG&G Berthold, Bundoora VIC, Australia). Luciferase values were normalized to Renilla luminescence. In some experiments, cells were co-transfected before drug treatment with wild type IRF1 plasmid (pcDNA3-IRF1;, a generous gift from Dr. Taniguchi, University of Tokyo, Japan) or pre-transfected with IRF1 siRNA.
Real-time RT-PCR
Cells were seeded at 2 x 10⁶ cells in T-25cm2 flasks and 24 h later treated with the drugs and/or vehicles as indicated for a further 48 h. Total RNA was extracted using the TRIzol reagent (Life Technologies, Inc., Gaithersburg, MD). Total RNA (1 μg) was used to synthesize the first-strand cDNA by SuperScript II™ First-Strand Synthesis SuperMix (Invitrogen) according to the manufacturer’s instructions.
Primers were purchased from Applied Biosystems Inc.; the ribosomal protein, large, P0 (RPLP0) was used as an internal standard. The genes and Assay ID of the primers used in this experiment are as follows: IRF1 (Hs00233698_m1); NFκB p65/RELA (Hs00153294_m1); Survivin (Hs00153353_m1); BCL2 (Hs00608023_m1); BCL-W (BCL2L2) (Hs00187848_m1); BAX (Hs00180269_m1); BAK (Hs00832876_g1); BAD (Hs00188930_m1); BID (Hs00609632_m1); BIK (Hs00609635_m1); RPLP0 (Hs99999902_m1). Probes were labeled with the reporter fluorescent dye FAM (6-carboxyfluorescein) at the 5′ end and a quencher fluorescent dye 6-carboxy-tetramethylrhodamine (TAMRA) at the 3′ end.
PCR reactions were performed using the 7900TH fast Real Time PCR System (Applied Biosystems Inc) in a total volume of 10 μl reaction mixture in 384-well plates. Real-time PCR data were plotted as the Δ_Rn_ fluorescence signal versus the cycle number. Relative quantification of gene expression using the 2-ΔΔCt method was analyzed as previously described (34).
Immunoblotting
Cells were grown in either 10-cm2 dishes or T-75 cm2 tissue culture flasks before lysis. To determine the effects of IFNs on the expression of IRF1 protein, cells were treated with 0, 10, 100, 1000 IU/ml of IFNα, β, or γ for 24 h and lysates harvested for analysis. To determine the effects of IFNγ and ICI on protein expression, cells were treated with drug and/or vehicle for 24 h and 48 h. Mitochondrial fractions were isolated using the Mitochondria Isolation Kit for Cultured Cells (Pierce, Rockford, IL). Briefly, cells were seeded in T-75 cm2 tissue culture flasks at 2 x 10⁶ and 24 h later treated with indicated drugs and/or vehicle. Forty-eight hours later, cells were trypsinized, pelleted by centrifugation, and mitochondria fractions were isolated according to the manufacturer’s instructions.
Lysate preparation and analysis was done as previously described (35). Proteins were probed with the following antibodies overnight at 4°C: STAT1 (1:1000, Cell Signaling, Beverly, MA), phospho-STAT1 Tyr701 or Ser727 (1:1000, Cell Signaling), ERK1/2 (1:1000, Cell Signaling), phospho-ERK1/2 Thr202/Tyr204 (1:1000, Cell Signaling), IKKγ (1:200; Santa Cruz Biotechnology, Santa Cruz, CA), NFκB p65 (RELA) (1:1000), IRF1 (1:500), HSP27 (1:5000, Abcam, Abcam Inc, Cambridge, MA), phospho-HSP27 Ser78 (1:2000, Abcam), BCL2 (1:1000, Stressgen, Ann Arbor, MI), BCL-xL (1:1000, Cell Signaling), BCL-W (1:1000, Cell Signaling), BAX (1:1000; Millipore, Temecula, CA), CASP7 (1:1000, Cell Signaling), cleaved CASP7 (1:1000, Cell Signaling), CASP8 (1:1000, Cell Signaling), cleaved CASP8 (1:1000, Cell Signaling), p62/SQSTM1 (1;2000, Abcam) and LC3B (1:1000, Cell Signaling). To confirm equal loading of the gels, membranes were reprobed with GAPDH antibody (1:2000; Santa Cruz Biotechnology, Santa Cruz, CA) or β-actin (1:5000, Sigma) for the whole lysates and COX IV (1:1000; Cell Signaling) for mitochondrial fractions. Semi-quantitative analysis of protein expression was performed by densitometry using NIH ImageJ software (http://rsb.info.nih.gov/ij).
Caspase Activity Assay
Cells were seeded at 1 x 10⁴ in white 96-well plates and 24 h later treated with indicated drug/vehicle for 16 h (CASP9) or 72 h (CASP7, CASP8). Caspase activity was detected using the Apo-ONE Homogeneous CASP-3/7 Assay, CASP-Glo 8 Assay and CASP-Glo 9 Assay from Promega according to the manufacturer’s instructions.
Statistical Analyses
Data are reported as mean ± standard error (S.E). Two-tailed Student’s t_-tests were used for the comparison of two groups for immunoblot, cell proliferation, and MMP assays as indicated. For luciferase reporter assays, Dunn’s post hoc t-test was used to compare all treatment groups following one-way ANOVA. Statistical significance is defined as: *p<0.05 vs. vehicle/control; #p<0.05 vs. ICI; ^_p<0.05 vs. IFNγ; &p<0.05 vs. CTRLsi or empty vector (EV) transfection.
Results
IFNγ Induces IRF1 Expression and Increases Antiestrogen Responsiveness
Fig. S1A (supplementary data) shows that IFNγ treatment induces a significant increase in IRF1 protein expression, whereas IFNα or β treatment have no significant effect (upper and middle parts of Panel A). In contrast, IRF1 expression increases 15-fold following treatment with 10 IU/ml IFNγ; a ~20-fold increase is induced by 100 and 1000 IU/ml IFNγ treatment (Fig. S1B; p<0.05).
Low doses of IFNγ (0–100 IU/ml) do not inhibit cell proliferation (Fig. 1A) but 1000 IU/ml significantly inhibits the proliferation of MCF7/LCC9 cells (p<0.05). Since 100 IU/ml IFNγ is maximally effective at inducing IRF1 (20-fold) but it has no effect on cell proliferation, we used this concentration of IFNγ in subsequent studies. We first combined 100 IU/ml IFNγ with increasing concentrations of ICI (0, 100, 1000 nmol/L) and measured the effects on cell proliferation. As shown in Fig. 1B, 100 IU/ml IFNγ increases the antiproliferative effects of ICI at all concentrations tested. We used 100 nmol/L ICI for further studies because this concentration approximates the IC50 for ICI in the parental, antiestrogen sensitive, MCF7/LCC1 cells (12).
Figure 1.

IFNγ restores, and IRF1 siRNA transfection impairs, ICI sensitivity in breast cancer cells. (a) Antiestrogen-resistant MCF7/LCC9 cells were seeded in 96-well tissue culture dishes and treated with 0–1000 IU/ml IFNγ for 6 days, at which time cell proliferation was measured using the CCK-8 reagent. (b) MCF7/LCC9 cells were seeded in 96-well tissue culture dishes and treated with 100 or 1000 nmol/L ICI in the presence or absence of 100 IU/ml IFNγ for 6 days before measuring cell proliferation as in (a). (c) Antiestrogen-resistant MCF7/LY2 cells were seeded in 96-well tissue culture dishes and treated with 0–1000 nmol/L ICI in the presence (open circles) or absence (closed circles) of 100 IU/ml IFNγ for 6 days before measuring cell proliferation as in (a). (d) and (e) Antiestrogen-sensitive MCF7/LCC1 (d) and MCF7 (e) cells were mock-transfected (closed circles), or transfected with either non-silencing control (CTRLsi, closed triangles) or IRF1-specific (IRF1si, open circles) oligonucleotides one day prior to seeding in 96-well tissue culture dishes. Cells were then treated with 0–1000 nmol/L ICI for 6 days before measuring cell proliferation as in (a). Each inset in c-e shows a representative Western blot for expression of IRF1 and the GAPDH or β–actin loading control. In all panels, data are presented as relative optical density (OD 450 nm) and represent the mean ± S.E. for a representative experiment; at least three independent experiments were performed. *p<0.05 vs. control/vehicle treatment, #p<0.05 vs. ICI treatment, and &p<0.05 vs. CTRLsi transfection.
To confirm that restoration of ICI sensitivity by IFNγ occurs in other models of antiestrogen resistance, we performed a similar experiment in MCF7/LY2 cells. LY2 cells, which were originally selected for resistance to LY117018, an analog of the non-steroidal antiestrogen Raloxifene (13, 29), are also cross-resistant to ICI. ICI has no effect on cell proliferation at concentrations up to 1 μM (Fig. 1C, upper curve, closed circles). However, when combined with 100 IU/ml IFNγ, which induces IRF1 expression (inset), ICI produces a significant decrease in cell proliferation (p<0.05 vs. ICI alone; lower curve, open circles).
To test directly whether a reduction in IRF1 expression affects sensitivity to ICI, we introduced IRF1 siRNA into the parental, ICI-sensitive MCF7/LCC1 and MCF7 cells, which have higher levels of IRF1 expression than their paired, ICI-resistant, MCF7/LCC9 cells. MCF7/LCC1 and MCF7 cells are markedly less sensitive to growth inhibition by ICI treatment following IRF1 siRNA transfection compared to no siRNA (Mock) or control siRNA (CTRL siRNA) transfection (Fig. 1D and E; p<0.05). The insets show representative immunoblots for IRF1 protein, which is undetectable after IRF1 siRNA transfection.
IRF1 is Required for the Antiproliferative Effects of Combined IFNγ and ICI Treatment
To elucidate the mechanism by which the combination of IFNγ and ICI reduces the proliferation of antiestrogen resistant cells, MCF7/LCC9 cells were transfected with control or IRF1 siRNA before treatment with 100 IU/ml IFNγ and 100 nmol/L or 1000 nmol/L ICI. The growth-inhibitory effect of the combination of IFNγ and either concentration of ICI is completely and significantly reversed by IRF1 siRNA (Fig. 2A, p<0.05). MMP, an early measure of cell death signaling, is also significantly increased by the combination treatment of IFNγ and ICI, while this effect is blocked by IRF1 siRNA (Fig. 2B, p<0.05). Western blot analysis confirms that transfection with IRF1 siRNA prior to treatment prevents IRF1 induction by IFNγ in antiestrogen resistant MCF7/LCC9 cells (Fig. 2C).
Figure 2.
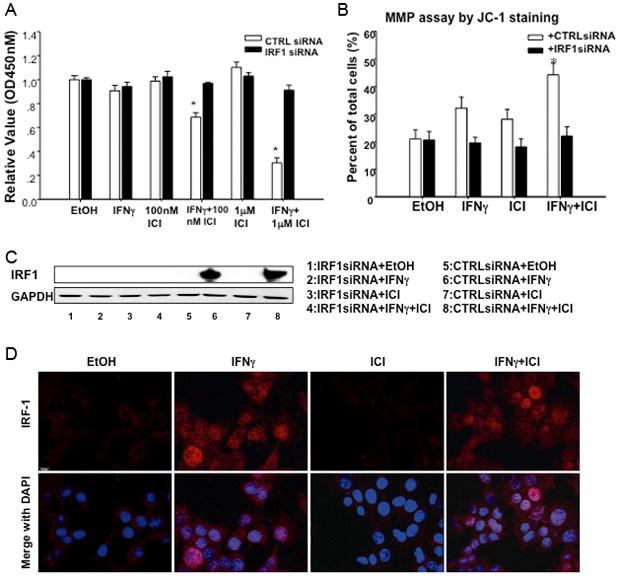
Restoration of ICI sensitivity by IFNγ induces apoptosis, requires the induction of IRF1, and induces nuclear localization of IRF1. (a) MCF7/LCC9 cells were transfected with either non-silencing control (CTRLsi, white bars) or IRF1-specific (IRF1si, black bars) oligonucleotides one day prior to seeding in 96-well tissue culture dishes. Cells were then treated with ethanol (EtOH) vehicle, 100 or 1000 nmol/L ICI in the presence or absence of 100 IU/ml IFNγ for 6 days before measuring cell proliferation. Data are presented as relative optical density (OD 450 nm) and represent the mean ± S.E. for a representative experiment; at least three independent experiments were performed. *p<0.05 vs. control/vehicle treatment. (b) MCF7/LCC9 cells were transfected with either non-silencing control (CTRLsi, white bars) or IRF1-specific (IRF1si, black bars) oligonucleotides one day prior to seeding in 6-well tissue culture dishes. Cells were then treated with ethanol (EtOH) vehicle or 100 nmol/L ICI in the presence or absence of 100 IU/ml IFNγ for 3 days before detecting apoptosis by measuring mitochondrial membrane permeability (MMP). Data are presented as percent of total cells positive for green fluorescence (indicative of MMP) and represent the mean ± S.E. for three independent experiments. *p<0.05 vs. control/vehicle treatment. (c) MCF7/LCC9 cells were transfected with CTRLsi or IRF1si one day prior to seeding in 6-well tissue culture dishes and treating with ethanol (EtOH) vehicle or 100 nmol/L ICI in the presence or absence of 100 IU/ml IFNγ for 48 h. Cells were lysed and IRF1 expression was detected by immunoblot. GAPDH serves as the loading control. (d) MCF7/LCC9 cells were seeded onto 18 mm2 glass coverslips one day prior to treatment with ethanol (EtOH) vehicle or 100 nmol/L ICI in the presence or absence of 100 IU/ml IFNγ for 48 h. The cells were then fixed, permeabilized, stained for IRF1 and DAPI, and visualized by confocal microscopy. Nuclear IRF1 expression (red staining) is observed in cells treated with IFNγ.
Combined IFNγ and ICI Treatment Increases the Expression and Nuclear Translocation of IRF1 but has No Effect on NFκB p65
The subcellular localization of IRF1 and NFκB p65 were detected by immunofluorescence using confocal microscopy in MCF7/LCC9 cells treated with 100 IU/ml IFNγ, 100 nmol/L ICI alone or in combination (Fig. 2D). DAPI staining shows the location of the nuclei; when merged with IRF1 staining (lower panel) the levels of IRF1 in IFNγ with/without ICI treated cells are seen to be higher than those in vehicle and ICI treated cells. IRF1 translocates to the nuclei following IFNγ treatment (red staining), while the location of NFκB p65 is not affected by IFNγ (not shown).
IFNγ and ICI Treatment Increases IRF1 and Decreases NFκB p65 Transcriptional Activation
To further explore the mechanism of IFNγ-mediated restoration of ICI sensitivity, we measured the transcriptional activity of IRF1 using promoter-reporter luciferase assays. As expected, the transcriptional activity of IRF1 is significantly increased by IFNγ treatment whether given alone or in combination with ICI (Fig. 3A). We then measured the transcriptional activity of NFκB p65 (RELA), which is upregulated in MCF7/LCC9 cells (where basal IRF1 expression and activity is low); NFκB p65 may play a key functional role in driving antiestrogen resistant breast cancer cell growth and survival (15, 35). The transcriptional activity of NFκB p65 is reduced following treatment with IFNγ and reduced significantly further by the combination of IFNγ and ICI (Fig. 3A; p<0.05). Basal and IFNγ-induced ISRE-luc activities are substantially reduced in MCF7/LCC9 cells (Fig. 3B) when transfected with IRF1 siRNA prior to treatment. Similarly, transfection of IRF1 siRNA partially reverses both the effect of IFNγ alone and the effect of a combination of IFNγ and ICI, on NFκB p65-luciferase activity (Fig. 3C; p=0.001 and p=0.004, respectively). To show that IRF1 can directly repress NFκB p65 transcriptional activity, we transiently transfected MCF7/LCC9 cells with an expression plasmid encoding the wild type IRF1 cDNA. Transcriptional activity of NFκB p65 is significantly reduced by ectopic IRF1 expression, whether or not the cells are treated with ICI (Fig. 3D). These data suggest that restoration of IRF1 expression may improve ICI responsiveness, likely at least partly through the downregulation of pro-survival NFκB activities (35, 36).
Figure 3.

Combined treatment with IFNγ and ICI increases ISRE transcriptional activity, and reduces NFκB transcriptional activity, in an IRF1-dependent manner. (a) MCF7/LCC9 cells were seeded in 12-well tissue culture dishes one day prior to transfection with plasmids encoding ISRE-Luc or p65-Luc in combination with the control phRL-SV40-Renilla. Cells were then treated with ethanol (EtOH) vehicle or 100 nmol/L ICI in the presence or absence of 500 IU/ml IFNγ for 48 h before lysis and analyis by dual-luciferase promoter-reporter assay. (b) MCF7/LCC9 cells were transfected with CTRLsi or IRF1si one day prior to seeding in 12-well tissue culture dishes, followed by transfection with ISRE-Luc and phRL-SV40-Renilla, treatment with vehicle or 500 IU/ml IFNγ for 48 h, and lysis/analysis as in (a). (c) MCF7/LCC9 cells were transfected with CTRLsi or IRF1si one day prior to seeding in 12-well tissue culture dishes, followed by transfection with ISRE-Luc and phRL-SV40-Renilla, treatment with ethanol (EtOH) vehicle or 100 nmol/L ICI in the presence or absence of 500 IU/ml IFNγ for 48 hours, and lysis/analysis as in (a). (d) MCF7/LCC9 cells were seeded in 12-well tissue culture dishes one day prior to co-transfection with plasmids encoding p65-Luc, phRL-SV40-Renilla, and either pcDNA3-IRF1 wild type (WT) or the empty vector (EV) control. Cells were then treated with ethanol (EtOH) vehicle or 100 nmol/L ICI for 48 h prior to lysis/analysis as in (a). For a through d, data are presented as the ratio of luciferase-to-Renilla signal (Relative Light Units, RLU) and represent the mean ± S.E. for a representative experiment performed in quadruplicate. At least three independent experiments were performed. *p<0.05 vs. control, ^p<0.05 vs. IFNγ, and &p<0.05 vs. CTRLsi or empty vector (EV) transfection.
IFNγ and ICI Treatment Decreases Pro-survival Gene Expression While Increasing That of Pro-apoptotic Mitochondrial BAX
Consistent with increased IRF1 protein expression following IFNγ stimulation (Fig. S1), IRF1 mRNA expression is significantly increased by IFNγ treatment (Fig. 4A). In contrast, the mRNA of several key pro-survival genes such as BCL2, BCL-W (BCL2L2) and survivin (BIRC5) is significantly reduced by 60%, 75%, and 73%, respectively, with IFNγ and ICI treatment. Conversely, the expression of pro-apoptotic genes including BAK and BAX is increased 2-fold with IFNγ and ICI treatment (Fig. 4B); the expression of BIK and BAD does not change (not shown). To validate the changes in mRNA expression, whole-cell lysates were prepared and the proteins detected by Western blot. The protein levels of NFκB p65, BCL2, BCL-XL (BCL2L1) and BCL-W (BCL2L2) are each significantly reduced with IFNγ and ICI treatment (Fig. 5A and B: p<0.05).
Figure 4.
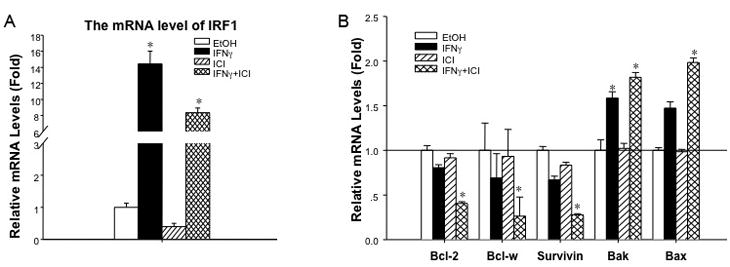
Combined treatment with IFNγ and ICI decreases the mRNA expression of pro-survival genes while increasing expression of pro-apoptotic genes in MCF7/LCC9 cells. (a) IRF1 mRNA expression is induced by IFNγ MCF7/LCC9 cells were seeded in T-25 cm2 tissue culture flasks one day prior to treatment with ethanol (EtOH) vehicle or 100 nmol/L ICI in the presence or absence of 100 IU/ml IFNγ for an additional 48 hours. Total RNA was extracted, reverse transcribed, and assayed for IRF1 expression by qRT-PCR. RPLP0 serves as the housekeeping gene. Data are presented as a ratio of IRF1:RPLP0 expression (relative mRNA levels) and represent the mean ± S.E. for a representative experiment; at least three independent experiments were performed. *p<0.05 vs. control/vehicle treatment. (b) BCL2, BCL-W, and survivin are reduced, while BAK and BAX are increased by IFNγ MCF7/LCC9 cells were seeded, treated, and assayed as in (a). Data are presented as a ratio of target gene:RPLP0 expression (relative mRNA levels) and represent the mean ± S.E. for a representative experiment; at least three independent experiments were performed. *p<0.05 vs. control/vehicle treatment.
Figure 5.

Effects of IFNγ and ICI on the protein expression of pro-apoptotic and anti-apoptotic signaling molecules in MCF7/LCC9 cells. (a and b) Cells were seeded in T-75cm2 tissue culture flasks one day prior to treatment with ethanol (EtOH) vehicle or 100 nmol/L ICI in the presence or absence of 100 IU/ml IFNγ for an additional 48 hours. Whole-cell lysates were prepared and analyzed by immunoblot for the indicated proteins; GAPDH serves as the loading control. Representative images are shown in (a), while densitometric analysis from at least three independent experiments is shown in (b). *p<0.05 vs. control/vehicle treatment. (c and d) IFNγ increases mitochondria-associated BAX. MCF7/LCC9 cells were seeded and treated as described in (a). Mitochondrial and cytosolic fractions were isolated and analyzed by immunoblot for BAX, GAPDH (loading control for cytosolic fraction), and cytochrome c oxidase IV (COX IV; loading control for mitochondrial fraction). A representative image is shown in (c), while densitometric analysis from at least three independent experiments is shown in (d). *p<0.05 vs. control/vehicle treatment, and ^p<0.05 vs. IFNγ.
To explore the most likely upstream regulator of pathway affected by IFNγ, the levels of total STAT1 and phospho-STAT1 were measured by immunoblotting. Protein levels of total STAT1 and phospho-STAT1 (Tyr701 or Ser727) are substantially increased by IFNγ treatment as expected (37), with or without concurrent ICI treatment. We also detect expression of IKKγ a key regulator of NFκB p65 (RELA) expression and activity. As shown in Fig. 5A and B, the protein level of IKKγ is reduced ≥50% with IFNγ and ICI treatment. We then measured the levels of total and phospho-ERK1/2 and phospho-HSP27, which are strongly associated with proliferative status. Protein levels of phospho-ERK1/2 (Thr702/Tyr704) and phospho-HSP27 (Ser78) are reduced by combined IFNγ and ICI treatment, while the total protein levels do not change (Fig. 5A and B). BAX mRNA is increased by IFNγ and ICI but there is no significant change in BAX protein expression in the whole-cell lysates. However, BAX expression in the mitochondrial fraction increases significantly with IFNγ ± ICI treatment, whereas there is no change in cytosolic BAX levels (Fig. 5C and D; p<0.05).
Combined IFNγ and ICI Treatment Inhibits the BCL2 P1 but not P2 Promoter
BCL2 expression is induced by 17β-estradiol (estrogen; E2) and decreased by antiestrogens (38, 39). Transcription from the BCL2 gene is driven by two promoters (P1 and P2) (33). Analysis of the proximal promoter region (−3kb) of BCL2 by the MatInspector algorithm (40) reveals three consensus ISREs (one in P1 and two in P2). To determine whether the inhibition of BCL2 mRNA expression by IFNγ/ICI treatment is due to reduced BCL2 transcription, we transfected MCF7/LCC9 cells with various BCL2 promoter-reporter constructs. Activity of the full-length BCL2 5′ untranslated region (UTR; contains both P1 and P2 sequences) is significantly reduced by IFNγ and ICI treatment (Fig. 6A; p<0.05). Activity of the BCL2 P1 promoter is also significantly reduced by IFNγ and ICI treatment, whereas the activity of the BCL2 promoter P2 is not affected.
Figure 6.
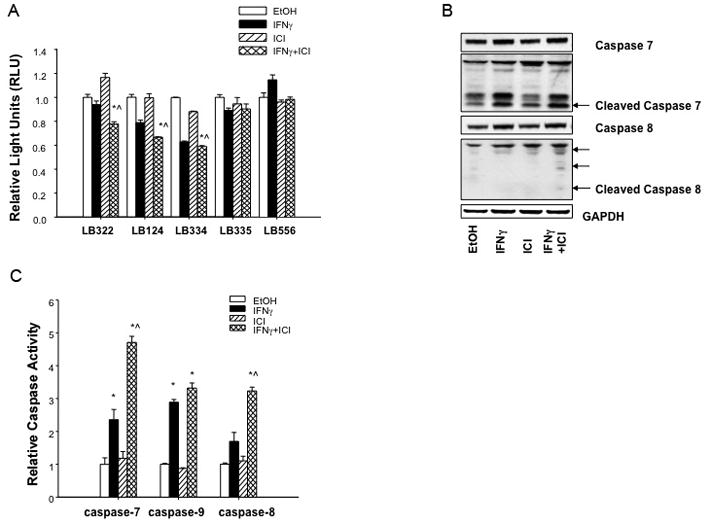
Combined treatment with IFNγ and ICI inhibits the BCL2 P1 promoter and increases the activation of CASP7, CASP8, and CASP9 in MCF7/LCC9 cells. (a) MCF7/LCC9 cells were seeded in 12-well plates one day prior to transfection with different BCL2 promoter-reporter and phRL-SV40-Renilla constructs and treatment with 100 IU/ml IFNγ or 100 nmol/L ICI (singly or in combination), or ethanol vehicle for 48 h. Data are presented as Relative Light Units (RLU) and represent mean ± S.E. for a representative experiment; three independent experiments were performed. *p<0.05 vs. control, and ^p<0.05 vs. IFNγ. (b) Protein levels of CASP7, cleaved CASP7, CASP8, and cleaved CASP8 were detected by immunoblot in MCF7/LCC9 cell lysates after 48 h of treatment with ethanol (EtOH) vehicle or 100 nmol/L ICI in the presence or absence of 100 IU/ml IFNγ A representative image is shown. (c) MCF7/LCC9 cells were seeded in white, 96-well tissue culture dishes one day prior to treatment with ethanol (EtOH) vehicle or 100 nmol/L ICI in the presence or absence of 100 IU/ml IFNγ Sixteen (CASP9) or 72 (CASP7, CASP8) hours later, caspase activity was detected using colorimetric or luminescent assay as described in the Methods. Data are normalized to the vehicle-treated control and represent the mean ± S.E. for three independent experiments. *p<0.05 vs. control, and ^p<0.05 vs. IFNγ.
Combined IFNγ and ICI Treatment Increases CASP 7, CASP8, and CASP9 Activation
The data above imply that IFNγ and ICI induce an apoptotic, caspase-mediated cell death. Thus, we measured the expression and activity of CASP7, CASP8, and CASP9 by immunoblotting and colorimetric caspase assays. As shown in Fig. 6B, cleaved CASP7 and CASP8 were detected after IFNγ and ICI treatment; cleaved CASP9 was not detected (not shown). The activity of these three caspases is significantly increased by combined IFNγ and ICI treatment (Fig. 6C; p<0.05). CASP7 and CASP9 expression are also increased by IFNγ alone, but this induction is less than that seen in combination with ICI.
We also measured the induction of autophagy in MCF7/LCC9 cells treated by IFNγ and/or ICI. As shown in Fig. S2A (supplementary data), the protein level of SQSTM1/p62 is reduced by IFNγ alone or combined with ICI treatment, while cleavage of LC3B is increased. However, there is no significant difference in the levels of autophagy between IFNγ alone and when combined with ICI. These observations indicate that, while antiestrogen resistant cells are capable of inducing autophagy through IFN-mediated signaling, their ability to do so through antiestrogen-regulated signaling is lost, and this is not restored by the combination of IFNγ and ICI. When IFNγ restores antiestrogen sensitivity the primary increase in cell death appears to result from increased apoptosis (Fig 2B), despite the ability of cells to induce autophagy through IFNγ. CASP8 activation can occur during extrinsic apoptosis and is a critical mediator of this process (36). To determine further the signaling involved in this regulation of apoptosis, we used a CASP8 inhibitor and measured its effects on MMP and apoptosis. As shown in Fig. S2B (supplementary data), the CASP8 inhibitor prevents the apoptosis induced by combined IFNγ and ICI treatment in MCF7/LCC9 cells.
Discussion
IRF1 expression is efficiently induced by the type II IFNγ in many cell types. We and others have demonstrated previously that overexpression of IRF1 in breast cancer cells can induce apoptosis (20, 25, 41–43) and inhibit breast tumorigenesis (20, 44). Furthermore, endogenous IRF1 expression is significantly reduced in antiestrogen-resistant MCF7/LCC9 breast cancer cells (15). While both IRF1 and IRF2 are expressed in breast cancer (45, 46), we detect increased IRF1 expression but the expression of IRF-2 remains constant (data not shown), maintaining a high ratio of IRF1:IRF-2. Thus, it is unlikely that IRF2 plays a major role in the regulation of responsiveness to antiestrogens in breast cancer.
We now show that treatment with IFNγ rescues or enhances IRF1 expression in MCF7/LCC9 and MCF7/LY2 cells and restores their sensitivity to ICI-mediated apoptosis. This restoration of antiestrogen sensitivity is driven by an IRF1-dependent increase in mitochondrial outer membrane permeability and activation of the intrinsic (mitochondrial) apoptotic pathway in the absence of any change in the level of autophagy. Mechanistically, the effects of IFNγ in resistant cells are mediated by differential alterations in the signaling of both prosurvival (BCL2; BCL-W) and proapoptotic BCL2 family members (BAK; BAX), and other prosurvival signaling including that affected by survivin, NFκB p65, phospho-ERK1/2 and phospho-HSP27.
The upstream regulation of these events is most likely the consequence of IFNγ-receptor activation of STAT1, a potent regulator of IRF1 transcription. However, it is also evident that NFκB, a transcription factor implicated in the regulation of cell proliferation and in resistance to cytotoxic drugs (47), is also a key player in this signaling. Both the mRNA and protein expression of NFκB is increased in MCF7/LCC9 cells when compared with its parental antiestrogen-sensitive MCF7/LCC1 cells (15, 35). Sustained NFκB activity is necessary for maintenance of the antiestrogen resistant phenotype (36). IRF1 and NFκB form productive heterodimers and cooperate in regulating gene expression (48, 49). Furthermore, upregulation of NFκB expression is associated with E2-independence (50, 51). We show that the combination of IFNγ and ICI reduces both NFκB protein expression and transcriptional activation, and that this requires the induction of IRF1 by IFNγ. A significant inverse association between nuclear IRF1n and NFκB is evident in some ER+ breast cancers (46). Future studies will focus on this inverse relationship and its consequences for predicting endocrine responsiveness.
The BCL2 gene family comprises both pro-survival proteins (such as BCL2, BCL-XL, BCL-W) and pro-apoptosis proteins (including BAD, BAK, BAX, BID, BIK), and is functionally involved in the regulation of cell fate (52). A central output from the sum or prosurvival and proapoptotic signaling through this family is an alteration in MMP, which affects cytosolic cytochrome c concentrations and the level of apoptosis as executed by selected caspases. The regulation of several members of the BCL2 family is known to be affected by NFκB (35, 36), consistent with the regulation of NFκB described above. Expression of the pro-survival genes BCL2, survivin, and BCL-W is reduced by the combination of IFNγ and ICI, whereas that of the pro-apoptotic genes BAK and BAX is increased. The ratio of BCL2 to BAX can alter the rate of apoptosis in response to treatment (53). For BAX protein expression, there is no change in total expression in whole-cell lysates but BAX expression is significantly increased in the mitochondrial fraction, consistent with the modifications seen in MMP. Reduced expression of BCL2, BCL-W (54), and survivin, in the presence of increased BAK and BAX expression, likely generates a dominant signal in favor of cell death.
In conclusion, our studies show that treatment with IFNγ restores ICI-induced apoptosis in breast cancer cells that have acquired resistance to this antiestrogen. IFNγ action is dependent upon its induction of IRF1 expression and involves regulation of NFκB, specific BCL2 family members, and downstream caspases. While antiestrogen resistant cells retain the ability to induce autophagy in response to IFN, the restoration of antiestrogen responsiveness by IFN appears to be driven primarily through increasing apoptosis. Overall, these observations suggest that a combination of antiestrogens and compounds that can induce IRF1, such as low dose IFNγ, may be useful for the treatment of some ER+ breast cancers that have acquired resistance to antiestrogen therapy.
Supplementary Material
1
2
3
Acknowledgments
This work was generously supported by research awards funding from the Susan G. Komen Foundation award KG090245, Public Health Service awards R01-CA096483 and R01-CA131465 from the National Cancer Institute, BC030280 from the Department of Defense Breast Cancer Research Program (R. Clarke), and postdoctoral fellowships from the Susan G. Komen Foundation award PDF0503551 (R.B. Riggins), and 30900716 from the National Natural Science Foundation of China (Y. Ning).
This research was supported by a postdoctoral fellowship under the State Scholarship Fund from the China Scholarship Council (CSC) and the National Natural Science Foundation of China (30900716) for Dr. Y. Ning, a postdoctoral fellowship from the Susan G. Komen Foundation (PDF0503551) for Dr. R.B. Riggins, and research awards from the Susan G. Komen Foundation (KG090245) and U.S. Department of Health and Human Services (R01-CA131465) to Dr. R. Clarke. Technical services were provided by the Flow Cytometry, Macromolecular Analysis, Microscopy & Imaging, and Tissue Culture Shared Resources, which are supported by Public Health Service award P30-CA-51008 (Cancer Center Support Grant to the Lombardi Comprehensive Cancer Center, Georgetown University).
References
- 1.Jemal A, Siegel R, Ward E, Hao Y, Xu J, Murray T, et al. Cancer statistics. CA Cancer J Clin. 2008;58:71–96. doi: 10.3322/CA.2007.0010. [DOI] [PubMed] [Google Scholar]
- 2.Clarke R, Liu MC, Bouker KB, Gu Z, Lee RY, Zhu Y, et al. Antiestrogen resistance in breast cancer and the role of estrogen receptor signaling. Oncogene. 2003;22:7316–39. doi: 10.1038/sj.onc.1206937. [DOI] [PubMed] [Google Scholar]
- 3.Clarke R, Leonessa F, Welch JN, Skaar TC. Cellular and molecular pharmacology of antiestrogen action and resistance. Pharmacol Rev. 2001;53:25–71. [PubMed] [Google Scholar]
- 4.Riggins R, Bouton AH, Liu MC, Clarke R. Antiestrogens, aromatase inhibitors, and apoptosis in breast cancer. Vitam Horm. 2005;71:201–37. doi: 10.1016/S0083-6729(05)71007-4. [DOI] [PubMed] [Google Scholar]
- 5.Howell A, DeFriend D, Robertson JFR, Blamey RW, Walton P. Response to a specific antioestrogen (ICI 182,780) in tamoxifen-resistant breast cancer. Lancet. 1995;345:29–30. doi: 10.1016/s0140-6736(95)91156-1. [DOI] [PubMed] [Google Scholar]
- 6.Robertson JF, Osborne CK, Howell A, Jones SE, Mauriac L, Ellis M, et al. Fulvestrant versus anastrozole for the treatment of advanced breast carcinoma in postmenopausal women: a prospective combined analysis of two multicenter trials. Cancer. 2003;98:229–38. doi: 10.1002/cncr.11468. [DOI] [PubMed] [Google Scholar]
- 7.Vergote I, Robertson JF. Fulvestrant is an effective and well-tolerated endocrine therapy for postmenopausal women with advanced breast cancer: results from clinical trials. Br J Cancer. 2004;90 (Suppl 1):S11–S14. doi: 10.1038/sj.bjc.6601631. [DOI] [PMC free article] [PubMed] [Google Scholar]
- 8.Fawell SE, White R, Hoare S, Sydenham M, Page M, Parker MG. Inhibition of estrogen receptor-DNA binding by the “pure” antiestrogen ICI 164,384 appears to be mediated by impaired receptor dimerization. Proc Natl Acad Sci USA. 1990;87:6883–7. doi: 10.1073/pnas.87.17.6883. [DOI] [PMC free article] [PubMed] [Google Scholar]
- 9.Dauvois S, Danielian PS, White R, Parker MG. Antiestrogen ICI 164,384 reduces cellular estrogen receptor content by increasing its turnover. Proc Natl Acad Sci USA. 1992;89:4037–41. doi: 10.1073/pnas.89.9.4037. [DOI] [PMC free article] [PubMed] [Google Scholar]
- 10.Wakeling AE, Bowler J. Novel antioestrogens without partial agonist activity. J Steroid Biochem. 1988;31:645–53. doi: 10.1016/0022-4731(88)90014-3. [DOI] [PubMed] [Google Scholar]
- 11.Brunner N, Boulay V, Fojo A, Freter CE, Lippman ME, Clarke R. Acquisition of hormone-independent growth in MCF-7 cells is accompanied by increased expression of estrogen-regulated genes but without detectable DNA amplifications. Cancer Res. 1993;53:283–90. [PubMed] [Google Scholar]
- 12.Brunner N, Boysen B, Jirus S, Skaar TC, Holst-Hansen C, Lippman J, et al. MCF7/LCC9: an antiestrogen resistant MCF-7 variant in which acquired resistance to the steroidal antiestrogen ICI 182,780 confers an early crossresistance to the non-steroidal antiestrogen tamoxifen. Cancer Res. 1997;57:3486–93. [PubMed] [Google Scholar]
- 13.Bronzert DA, Greene GL, Lippman ME. Selection and characterization of a breast cancer cell line resistant to the antiestrogen LY 117018. Endocrinology. 1985;117:1409–17. doi: 10.1210/endo-117-4-1409. [DOI] [PubMed] [Google Scholar]
- 14.Clarke R, Brunner N, Thompson EW, Glanz P, Katz D, Dickson RB, et al. The inter-relationships between ovarian-independent growth, antiestrogen resistance and invasiveness in the malignant progression of human breast cancer. J Endocrinol. 1989;122:331–40. doi: 10.1677/joe.0.1220331. [DOI] [PubMed] [Google Scholar]
- 15.Gu Z, Lee RY, Skaar TC, Bouker KB, Welch JN, Lu J, et al. Association of interferon regulatory factor-1, nucleophosmin, nuclear factor-kappaB, and cyclic AMP response element binding with acquired resistance to faslodex (ICI 182,780) Cancer Res. 2002;62:3428–37. [PubMed] [Google Scholar]
- 16.Tamura T, Ishihara M, Lamphier MS, Tanaka N, Oishi I, Alzawa S, et al. An IRF1-dependent pathway of DNA damage-induced apoptosis in mitogen-activated T lymphocytes. Nature. 1995;376:596–9. doi: 10.1038/376596a0. [DOI] [PubMed] [Google Scholar]
- 17.Tanaka N, Ishihara M, Kitagawa M, Harada H, Kimura T, Matsuyama T, et al. Cellular commitment to oncogene-induced transformation or apoptosis is dependent on the transcription factor IRF1. Cell. 1994;77:829–39. doi: 10.1016/0092-8674(94)90132-5. [DOI] [PubMed] [Google Scholar]
- 18.Tanaka N, Ishihara M, Lamphier MS, Nozawa H, Matsuyama T, Mak TW, et al. Cooperation of the tumour suppressors IRF1 and p53 in response to DNA damage. Nature. 1996;382:816–8. doi: 10.1038/382816a0. [DOI] [PubMed] [Google Scholar]
- 19.Moro A, Santos A, Arana MJ, Perea SE. Activation of the human p27(Kip1) promoter by IFNalpha 2b. Biochem Biophys Res Commun. 2000;269:31–4. doi: 10.1006/bbrc.2000.2256. [DOI] [PubMed] [Google Scholar]
- 20.Bouker KB, Skaar TC, Riggins R, Harburger DS, Fernandez DR, Zwart A, et al. Interferon regulatory factor-1 (IRF1) exhibits tumor suppressor activities in breast cancer associated with caspase activation and induction of apoptosis. Carcinogenesis. 2005;26:1527–35. doi: 10.1093/carcin/bgi113. [DOI] [PubMed] [Google Scholar]
- 21.Sanceau J, Hiscott J, Delattre O, Wietzerbin J. IFN-beta induces serine phosphorylation of Stat-1 in Ewing’s sarcoma cells and mediates apoptosis via induction of IRF1 and activation of caspase-7. Oncogene. 2000;19:3372–83. doi: 10.1038/sj.onc.1203670. [DOI] [PubMed] [Google Scholar]
- 22.Chow WA, Fang JJ, Yee JK. The IFN regulatory factor family participates in regulation of Fas ligand gene expression in T cells. J Immunol. 2000;164:3512–8. doi: 10.4049/jimmunol.164.7.3512. [DOI] [PubMed] [Google Scholar]
- 23.Elledge RM, Allred DC. The p53 tumor suppressor gene in breast cancer. Breast Cancer Res Treat. 1994;32:39–47. doi: 10.1007/BF00666204. [DOI] [PubMed] [Google Scholar]
- 24.Early Breast Cancer Trialists Collaborative Group. Systemic treatment of early breast cancer by hormonal, cytotoxic or immune therapy. Lancet. 1992;399:1–15. [PubMed] [Google Scholar]
- 25.Bouker KB, Skaar TC, Fernandez DR, O’Brien KA, Clarke R. Interferon regulatory factor-1 mediates the proapoptotic but not cell cycle arrest effects of the steroidal antiestrogen ICI 182,780 (Faslodex, Fulvestrant) Cancer Res. 2004;64:4030–9. doi: 10.1158/0008-5472.CAN-03-3602. [DOI] [PubMed] [Google Scholar]
- 26.Pestka S, Langer JA, Zoon KC, Samuel CE. Interferons and their actions. Annu Rev Biochem. 1987;56:727–77. doi: 10.1146/annurev.bi.56.070187.003455. [DOI] [PubMed] [Google Scholar]
- 27.Darnell JE, Jr, Kerr IM, Stark GR. Jak-STAT pathways and transcriptional activation in response to IFNs and other extracellular signaling proteins. Science. 1994;264:1415–21. doi: 10.1126/science.8197455. [DOI] [PubMed] [Google Scholar]
- 28.Li X, Leung S, Qureshi S, Darnell JE, Jr, Stark GR. Formation of STAT1-STAT2 heterodimers and their role in the activation of IRF1 gene transcription by interferon-alpha. J Biol Chem. 1996;271:5790–4. doi: 10.1074/jbc.271.10.5790. [DOI] [PubMed] [Google Scholar]
- 29.van den Berg HW, Leahey WJ, Lynch M, Clarke R, Nelson J. Recombinant human interferon alpha increases oestrogen receptor expression in human breast cancer cells (ZR-75-1) and sensitises them to the anti-proliferative effects of tamoxifen. Br J Cancer. 1987;55:255–7. doi: 10.1038/bjc.1987.49. [DOI] [PMC free article] [PubMed] [Google Scholar]
- 30.Sica G, Natoli V, Stella C, Del Bianco S. Effect of natural beta-interferon on cell proliferation and steroid receptor level in human breast cancer cells. Cancer. 1987;60:2419–23. doi: 10.1002/1097-0142(19871115)60:10<2419::aid-cncr2820601011>3.0.co;2-s. [DOI] [PubMed] [Google Scholar]
- 31.Goldstein D, Bushmeyer SM, Witt PL, Jordan VC, Borden EC. Effects of type I and II interferons on cultured human breast cells: interactions with estrogen receptors and with tamoxifen. Cancer Res. 1989;49:2698–702. [PubMed] [Google Scholar]
- 32.Wilson BE, Mochon E, Boxer LM. Induction of BCL2 expression by phosphorylated CREB proteins during B-cell activation and rescue from apoptosis. Mol Cell Biol. 1996;16:5546–56. doi: 10.1128/mcb.16.10.5546. [DOI] [PMC free article] [PubMed] [Google Scholar]
- 33.Heckman CA, Mehew JW, Ying GG, Introna M, Golay J, Boxer LM. A-Myb up-regulates BCL2 through a Cdx binding site in t(14;18) lymphoma cells. J Biol Chem. 2000;275:6499–508. doi: 10.1074/jbc.275.9.6499. [DOI] [PubMed] [Google Scholar]
- 34.Ning Y, Chen S, Li X, Ma Y, Zhao F, Yin L. Cholesterol, LDL, and 25-hydroxycholesterol regulate expression of the steroidogenic acute regulatory protein in microvascular endothelial cell line (bEnd.3) Biochem Biophys Res Commun. 2006;342:1249–56. doi: 10.1016/j.bbrc.2006.02.093. [DOI] [PubMed] [Google Scholar]
- 35.Riggins R, Zwart A, Nehra R, Agarwal P, Clarke R. The NFκB inhibitor parthenolide restores ICI 182,780 (Faslodex; Fulvestrant)-induced apoptosis in antiestrogen resistant breast cancer cells. Mol Cancer Ther. 2005;4:33–41. [PubMed] [Google Scholar]
- 36.Nehra R, RIggins RB, Shajahan AN, Zwart A, Crawford AC, Clarke R. BCL2 and CASP8 regulation by NFkB differentially affect mitochondrial function and cell fate in antiestrogen senstiive and resistant breast cancer cells. FASEB J. 2010 Feb 12; doi: 10.1096/fj.09-138305. [epub before print; PMID 20154269] [DOI] [PMC free article] [PubMed] [Google Scholar]
- 37.Kovarik P, Stoiber D, Novy M, Decker T. Stat1 combines signals derived from IFN-gamma and LPS receptors during macrophage activation. EMBO J. 1998;17:3660–8. doi: 10.1093/emboj/17.13.3660. [DOI] [PMC free article] [PubMed] [Google Scholar]
- 38.Lim KB, Ng CY, Ong CK, Ong CS, Tran E, Nguyen TT, et al. Induction of apoptosis in mammary gland by a pure anti-estrogen ICI 182780. Breast Cancer Res Treat. 2001;68:127–38. doi: 10.1023/a:1011929222555. [DOI] [PubMed] [Google Scholar]
- 39.Somai S, Chaouat M, Jacob D, Perrot JY, Rostene W, Forgez P, et al. Antiestrogens are pro-apoptotic in normal human breast epithelial cells. Int J Cancer. 2003;105:607–12. doi: 10.1002/ijc.11147. [DOI] [PubMed] [Google Scholar]
- 40.Cartharius K, Frech K, Grote K, Klocke B, Haltmeier M, Klingenhoff A, et al. MatInspector and beyond: promoter analysis based on transcription factor binding sites. Bioinformatics. 2005;21:2933–42. doi: 10.1093/bioinformatics/bti473. [DOI] [PubMed] [Google Scholar]
- 41.Pizzoferrato E, Liu Y, Gambotto A, Armstrong MJ, Stang MT, Gooding WE, et al. Ectopic expression of interferon regulatory factor-1 promotes human breast cancer cell death and results in reduced expression of survivin. Cancer Res. 2004;64:8381–8. doi: 10.1158/0008-5472.CAN-04-2223. [DOI] [PubMed] [Google Scholar]
- 42.Stang MT, Armstrong MJ, Watson GA, Sung KY, Liu Y, Ren B, et al. Interferon regulatory factor-1-induced apoptosis mediated by a ligand-independent fas-associated death domain pathway in breast cancer cells. Oncogene. 2007;26:6420–30. doi: 10.1038/sj.onc.1210470. [DOI] [PubMed] [Google Scholar]
- 43.Bowie ML, Dietze EC, Delrow J, Bean GR, Troch MM, Marjoram RJ, et al. Interferon-regulatory factor-1 is critical for tamoxifen-mediated apoptosis in human mammary epithelial cells. Oncogene. 2004;23:8743–55. doi: 10.1038/sj.onc.1208120. [DOI] [PubMed] [Google Scholar]
- 44.Kim PKM, Armstrong M, Liu Y, Yan P, Bucher B, Zuckerbraun BS, et al. IRF1 expression induces apoptosis and inhibits tumor growth in mouse mammary cancer cells in vitro and in vivo. Oncogene. 2004;23:1125–35. doi: 10.1038/sj.onc.1207023. [DOI] [PubMed] [Google Scholar]
- 45.Connett JM, Badri L, Giordano TJ, Connett WC, Doherty GM. Interferon regulatory factor 1 (IRF1) and IRF-2 expression in breast cancer tissue microarrays. J Interferon Cytokine Res. 2005;25:587–94. doi: 10.1089/jir.2005.25.587. [DOI] [PubMed] [Google Scholar]
- 46.Zhu Y, Singh B, Hewitt S, Liu A, Gomez B, Wang A, et al. Expression patterns among interferon regulatory factor-1, human X-box binding protein-1, nuclear factor kappa B, nucleophosmin, estrogen receptor alpha and progesterone receptor proteins in breast cancer tissue microarrays. Int J Oncol. 2006;28:67–76. [PubMed] [Google Scholar]
- 47.Baldwin AS. Control of oncogenesis and cancer therapy resistance by the transcription factor NF-kappaB. J Clin Invest. 2001;107:241–6. doi: 10.1172/JCI11991. [DOI] [PMC free article] [PubMed] [Google Scholar]
- 48.Pine R. Convergence of TNFalpha and IFNgamma signalling pathways through synergistic induction of IRF1/ISGF-2 is mediated by a composite GAS/kappaB promoter element. Nucleic Acids Res. 1997;25:4346–54. doi: 10.1093/nar/25.21.4346. [DOI] [PMC free article] [PubMed] [Google Scholar]
- 49.Kumar A, Yang Y-L, Flati V, Der S, Kadereit S, Deb A, et al. Deficient cytokine signaling in mouse embryo fibroblasts with a targeted deletion of the PKR gene: role of IRF1 and NFkB. EMBO J. 1997;16:406–16. doi: 10.1093/emboj/16.2.406. [DOI] [PMC free article] [PubMed] [Google Scholar]
- 50.Nakshatri H, Bhat-Nakshatri P, Martin DA, Goulet RJ, Sledge GW. Constitutive activation of NF-kappaB during progression of breast cancer to hormone-independent growth. Mol Cell Biol. 1997;17:3629–39. doi: 10.1128/mcb.17.7.3629. [DOI] [PMC free article] [PubMed] [Google Scholar]
- 51.Pratt MAC, Bishop TE, White D, Yasvinski G, Menard M, Niu MY, et al. Estrogen withdrawal-induced NF-kappaB activity and bcl-3 expression in breast cancer cells: roles in growth and hormone independence. Mol Cell Biol. 2003;23:6887–900. doi: 10.1128/MCB.23.19.6887-6900.2003. [DOI] [PMC free article] [PubMed] [Google Scholar]
- 52.Youle RJ, Strasser A. The BCL2 protein family: opposing activities that mediate cell death. Nat Rev Mol Cell Biol. 2008;9:47–59. doi: 10.1038/nrm2308. [DOI] [PubMed] [Google Scholar]
- 53.Mirjolet JF, Barberi-Heyob M, Didelot C, Peyrat JP, Abecassis J, Millon R, et al. BCL2/Bax protein ratio predicts 5-fluorouracil sensitivity independently of p53 status. Br J Cancer. 2000;83:1380–6. doi: 10.1054/bjoc.2000.1455. [DOI] [PMC free article] [PubMed] [Google Scholar]
- 54.Crawford AC, Riggins RB, Shajahan AN, Zwart A, Clarke R. Co-inhibition of BCL-W and BCL2 restores antiestrogen sensitivity through BECN1 and promotes an autophagy-associated necrosis. PLoS ONE. 2010;5(1):e8604. doi: 10.1371/journal.pone.0008604. [DOI] [PMC free article] [PubMed] [Google Scholar]
Associated Data
This section collects any data citations, data availability statements, or supplementary materials included in this article.
Supplementary Materials
1
2
3