MetaPhOrs: orthology and paralogy predictions from multiple phylogenetic evidence using a consistency-based confidence score (original) (raw)
Abstract
Reliable prediction of orthology is central to comparative genomics. Approaches based on phylogenetic analyses closely resemble the original definition of orthology and paralogy and are known to be highly accurate. However, the large computational cost associated to these analyses is a limiting factor that often prevents its use at genomic scales. Recently, several projects have addressed the reconstruction of large collections of high-quality phylogenetic trees from which orthology and paralogy relationships can be inferred. This provides us with the opportunity to infer the evolutionary relationships of genes from multiple, independent, phylogenetic trees. Using such strategy, we combine phylogenetic information derived from different databases, to predict orthology and paralogy relationships for 4.1 million proteins in 829 fully sequenced genomes. We show that the number of independent sources from which a prediction is made, as well as the level of consistency across predictions, can be used as reliable confidence scores. A webserver has been developed to easily access these data (http://orthology.phylomedb.org), which provides users with a global repository of phylogeny-based orthology and paralogy predictions.
INTRODUCTION
Homologous sequences, those sharing common ancestry, can be further divided into orthologs and paralogs, according to how they diverged from their common ancestor. As originally defined (1), orthologs are homologous sequences derived through speciation, whereas paralogs result from a duplication event. The availability of a growing number of sequences from diverse organisms have prompted the development of a plethora of methods that automatically predict orthology relationships among organisms (2,3). Among these, methods based on the analysis of gene phylogenies have the advantage that they closely resemble the original definition of orthology and that they readily inform on both orthology and paralogy (4). Despite the limitations imposed by the large computational demands of accurate phylogenetic analyses, several recent efforts have shown that it is feasible to obtain large collections of phylogenetic trees from which orthology and paralogy relationships can be inferred (5–9). These databases can be used as independent sources of phylogenetic information for a set of sequences, provided that there is a certain level of overlap in the species covered by each repository. Moreover, some databases, particularly PhylomeDB, can contain many independent phylogenetic reconstructions that inform on the evolutionary relationships of the same pair of sequences. Indeed, while most phylogenetic databases rely on an initial clustering phase so that a single phylogenetic tree is reconstructed for each gene family, PhylomeDB uses a gene-based approach in which a tree is reconstructed for each single gene in the genome, resulting in several trees for multigene families. Moreover, PhylomeDB hosts many different phylomes, each representing an independent source of phylogenetic data, since different phylogenetic pipelines and species scopes are used.
These independent phylogenetic data, which provide information for the same set of sequences, can be used to ascertain whether a phylogeny-based prediction of orthology is consistent among different gene trees. This, in turn, can be regarded as a measure of reliability of the orthology prediction. Such consistency-based approaches have been used, for instance, for assessing the reliability of multiple sequence alignments produced by different programs (10,11) or for creating a consensus from heterogeneous gene prediction methods (12), but, to our knowledge, have so far never been used in the context of phylogeny-based orthology and paralogy prediction. Note that the type of consistency used here is different from standard re-sampling methods such as bootstrapping, since here the raw data are independent from each other. In order to exploit such potential and to provide an integrated repository for phylogeny-based predictions of orthology and paralogy, we have developed a system that considers phylogenetic information from various sources. In this system, a score is assigned to each orthology and paralogy prediction based on its level of consistency across different sources of phylogenetic information. Currently, these sources include trees stored in PhylomeDB (6), EnsemblCompara (7), TreeFam (9) and yeast Orthogroups (13). Additionally, we have reconstructed Maximum Likelihood (ML) trees from alignments or protein families stored in EggNOG (8), OrthoMCL (14) and COG (15) databases. This integrated dataset provides phylogeny-based orthology and paralogy predictions for 4.1 million proteins in 829 fully sequenced genomes, with 65% of all predictions being based on more than a single phylogenetic tree. Using different benchmarks, we show that the integration of various phylogenetic datasets allows increasing the accuracy of orthology predictions. A webserver has been developed (http://orthology.phylomedb.org), which provides users with a global repository of highly reliable orthology and paralogy predictions.
MATERIALS AND METHODS
Phylogenetic trees sources
Phylogenetic data used to compute MetaPhOrs predictions were retrieved or generated from information contained in six different repositories: PhylomeDB (as of September 2010), Ensembl Compara (release 59), TreeFam-A (version 8), eukaryotic groups from EggNOG (euNOG and KOG, version 2.0), COG (as of April 2010), Fungal Orthogroups (as of July 2010) and OrthoMCL (release 4). Although EggNOG provides ML trees for its families, only consensus trees, usually containing multi-furcations, were available. Given that no multifurcations are allowed when using the species overlap algorithm, we recomputed new ML trees for each family. For this, we used the multiple sequence alignments provided by EggNog, and the PhyML phylogenetic inference program (16). In all cases a JTT model and a 4-categories rate distribution were used, where the gamma shape parameter and the proportion of invariant sites were estimated from the data. In order to root EggNog trees, taxa present in these trees were grouped accordingly to their evolutionary history (starting from most recent): hominids, primates, mammals, amniota, amphibians, vertebrates, metazoans, opistokonts and basal eukaryotes. Trees for OrthoMCL and COG orthologous groups were reconstructed as follows. Sets of homologous protein sequences containing at least three members were aligned using MUSCLE v3.6 (17), gap-rich regions in the alignment were removed with trimAl 1.2 (11) using a gap threshold of 0.9 and a conservation threshold of 0.66. The evolutionary model best-fitting the data was chosen among seven alternative models (JTT, WAG, MtREV, VT, LG, Blosum62 and Dayhoff) based on a likelihood estimation of a topology reconstructed with BioNJ, as implemented in PhyML aLRT version (16). The best model was determined by comparing the likelihood of the used models according to the AIC criterion (18). This model was used in a ML reconstruction as implemented in PhyML, using a discrete gamma-distribution model with four rate categories plus invariant positions. The gamma parameter and the fraction of invariant positions were estimated from the data. Resulting trees were rooted using a mid-point approach.
Sequence mapping
To establish correspondences between proteins present in all datasets, identifiers were cross linked among all databases. For this, we used the conversion tables provided by the different databases and blastp (19) comparisons between pairs of sequences (e-value <1E-05, low complexity filter disabled, query coverage ≥99%, identities ≥99%). MetaPhOrs results are shown, when available, using UniProt (August 2010 release) or Ensembl IDs (release 59). These mappings will be updated regularly.
Phylogenetic tree filters
PhylomeDB provides ML trees reconstructed using various evolutionary models and selects the best-fitting model by comparing the corresponding likelihoods using the Akaike criterion (18). In order to discard trees reconstructed with sub-optimal models, a likelihood filter was applied. Such filter compares the likelihoods of all trees of the protein pair under investigation, and rejects trees having a likelihood value three times smaller than the likelihood of the best model tree. NJ trees in PhylomeDB were not used as they do not provide likelihood estimations. Additional filters, based on branch supports were considered but were not included in the final implementation because they were not found to improve the accuracy of the predictions (data not shown).
Orthology and paralogy predictions
Speciations and duplications were mapped onto internal nodes using a previously described species overlap algorithm (5), as implemented in ETE (20) using a species overlap score (SOS) of 0.0. In brief, the algorithm scans the topology of all gene phylogenies and evaluates the level of species overlap between each daughter branch of a given node. Nodes for which daughter branches share at least one species (SOS > 0.0) are dubbed duplication nodes, whereas those that share no species are considered speciation nodes. According to their original definition (1), orthology and paralogy relationships between two sequences are derived from such trees based on which evolutionary event (speciation or duplication, respectively) is assigned for their last common ancestor.
Consistency score
Combined orthology/paralogy assignment is based on a single value, the orthology consistency score (CSo). CS is the ratio of the number of trees confirming orthology relationship over the total number of trees that were used to infer a relationship between given protein pair:
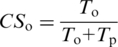
where _T_o and _T_p stand for the number of trees predicting orthology and paralogy, respectively, for this pair of sequences. If CS is equal or higher than a threshold (by default 0.5), the protein pair is mapped as an orthologous pair, otherwise they are considered as paralogs. Similarly, a paralogy consistency score (CSp) can be computed:
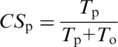
Note that, CSo + CSp = 1.0. This CSp is used in the MetaPhOrs website, when providing paralogy predictions, in order to facilitate an intuitive interpretation of the results. In addition, MetaPhOrs provides some values that inform on the quality of a prediction; the total number of trees explored for a given pair of sequences, the number of trees rejected by the filters, and the evidence level (EL). Evidence level is defined as the number of independent sources (external repositories or phylomes), in which trees confirming each prediction have been found. In general the higher EL, the higher the reliability of the prediction as more sources were used to infer it.
Benchmarking
Two reference sets have been used to compute the number of true positives (TP), false positives (FP), and false negatives (FN) for any given method and set of parameters used. First reference set consists of genome-wide, synteny-based orthology predictions between Saccharomyces cerevisiae, Candida glabrata and Ashbya gossipii retrieved from Yeast Gene Order Browser (YGOB) (21). This dataset consisted of 4510 and 4862 orthologous pairs between S. cerevisiae-C. glabrata and S. cerevisiae-A. gossipii, respectively. Secondly, a phylogeny-based dataset based on TreeFam-A (version 7) (9). This reference set consists of 497 human proteins and their orthologs (one-to-one and one-to-many) from 3 model species: closely related mouse, medium-related zebra-fish and distantly related fruit fly. The accuracy of several popular methods were compared using this dataset as a golden reference set. Recall (R) and precision, (P) have been calculated as follows: R = TP/(TP + FN) and P = TP/(TP + FP). The F-score, or harmonic mean, was used as a combined measure of the accuracy. F-score is computed as follows:

where β indicates the relative importance given to recall over precision. That is, β = 1 if both parameters have equal weight, whereas β = 0.5 if precision is weighted two times more than recall.
Finally, an additional benchmark was performed based on a previously reported phylogeny-based strategy (22). In brief, this benchmark measures the distance of a gene tree reconstructed from orthologous sequences to a reference species tree. Although, this benchmark is not able to report the recall or the amount of FN produced by the different methods, it has the advantage of assessing the precision using similar criteria in different datasets. In this benchmark PhylomeDB (phylomes: 1, human, 3, yeast and 18, E. coli) and metaPhOrs (EL cut-off of 1, 2 and 3) were tested independently, in order to test whether groups of orthologous predicted from redundant trees (MetaPhOrs) give more accurate species tree reconstruction as compared to orthologs based on a single tree. Orthologs from 393 species were used in 3 independent species trees for: Eukaryota (50 species divided into six taxonomic groups), Fungi (11 species divided into six taxonomic groups) and Bacteria (343 species divided into seven taxonomic groups). This benchmark is described in detail in (22). ML trees were derived from the alignments using PhyML_aLRT. The evolutionary model best fitting the data was determined as explained above for the COG and OrthoMCL datasets.
RESULTS AND DISCUSSION
Using multiple phylogenetic evidence to derive orthology and paralogy predictions
The existing phylogenetic repositories have been built with different purposes, and they usually differ in phylogenetic methods used, species scope or the number of trees provided. Considering their size, species coverage and quality of the information provided, we selected four repositories from which to extract phylogenetic data, namely PhylomeDB (6), EnsemblCompara (7), EnsemblGenomes, TreeFam-A (9) and yeast Orthogroups (13). Among them, PhylomeDB is probably the largest repository of phylogenetic trees available, EnsemblCompara hosts family trees involving most sequenced vertebrate genomes, EnsemblGenomes hosts family trees for Bacteria, Fungi, Metazoa, Plants and Protists and TreeFam includes a set of manually curated trees. Additionally, we derived ML trees from three repositories that provide clusters of orthologous groups, which include in-paralogs: eukaryotic groups in EggNOG (8), the popular COG (15) and the comprehensive OrthoMCL database (14).
Since many of these repositories overlap, partially, in terms of genomes covered, it is often the case that phylogenetic information regarding a pair of proteins can be found in several databases. Moreover, some databases, such as PhylomeDB, do inherently contain many partially overlapping phylogenetic trees (i.e. they share some proteins). Such level of information redundancy can be exploited to assess the robustness of a given orthology or paralogy prediction to changes in the phylogenetic settings (e.g. using different models or sets of proteins to construct the tree). Note that the use of the word redundancy here does not imply identical copies or exact replicas of the same dataset, but rather different phylogenetic reconstructions using different parameters or partially overlapping datasets. Intuitively, a prediction that is not affected by such settings will be considered more reliable. This phylogenetic redundancy can be currently exploited through the manual inspection of the different trees available for a given protein family. Nevertheless, no automatic approaches are implemented to perform the same analysis at large scale. In order to fill in this gap, we have developed MetaPhOrs—MetaPhylogenyBasedOrthologs—a pipeline for automatically exploiting this potential and to provide orthology and paralogy predictions based on multiple phylogenetic evidence.
The MetaPhOrs pipeline basically proceeds as follows: for any given pair of sequences, all phylogenetic trees that contain these sequences are retrieved. A filtering step may discard phylogenetic trees made with suboptimal evolutionary models (see below). Subsequently, a previously described species overlap algorithm (5), as implemented in ETE (20), is used on every single tree to predict the type of homology relationship between this sequence pair. It is important to note that our pipeline does not combine different orthology prediction methods, but it uses raw phylogenetic data to predict speciation and duplication events using the same methodology in all cases (see ‘Materials and Methods’ section). A consistency score (CSo) for an orthology prediction is then calculated as the fraction of trees predicting an orthology relationship over the total of trees considered. Thus, this value ranges from 0 (all trees predict a paralogy relationship between the sequences) to 1 (all trees predict an orthology relationship). Conversely, a consistency score can be computed for a paralogy prediction (CSp). Note that CSp + CSo = 1. In addition, a so-called evidence level index (EL) is provided that indicates how many independent sources (databases or phylomes) have been used for the prediction.
Parameter evaluation
To evaluate the significance of the computed consistency score and to establish the different thresholds used we ran two different benchmark analyses: one based on comparison to the set of manually curated trees in TreeFam (9) and another one based on the level of conservation of gene order among orthologs of yeast genes using the YGOB (21). These two benchmark datasets have been previously used to assess the accuracy of phylogeny-based orthology prediction (23–25) and target predictions with different phylogenetic scope. YGOB benchmark can only be applied for orthology predictions across yeast species, whereas TreeFam-A is centered around vertebrate species. In addition, we evaluated the precision of the final MetaPhOrs approach in metazoans, fungi and bacteria, using a phylogeny-based assessment described recently (22). These three independent benchmarks allow us to use complementary criteria (curated phylogeny, consistency with a species tree, and gene order conservation) to assess the level of prediction accuracy, something that is recommended for the assessment of orthology prediction approaches (2). For parameter evaluation, a benchmark based solely on phylomeDB trees was carried out. This approach was used because PhylomeDB has the highest level of redundancy among all databases used and some of the thresholds of the pipeline are only applied to this database (e.g likelihood threshold).
For a given set of homologous sequences, PhylomeDB hosts several ML trees based on different evolutionary models, from which the best-fitting model is subsequently selected based on the AIC approach (18). Variations between nearly optimal topologies might be informative regarding the accuracy of an orthology assessment and, therefore, we wished to include trees reconstructed with sub-optimal models in our pipeline. However, using trees for which the model is clearly wrongly specified and for which the quality is low may introduce more noise than information. For this reason we included a likelihood-based threshold to decide which of the trees reconstructed using sub-optimal models were worth to include. For each group of redundant phylogenies, we measured the likelihood difference between each suboptimal tree and the best fitting model tree. For this, we calculated the ratio between the logarithm of the likelihood of the tree reconstructed with the best-fitting model and that of the suboptimal tree considered. Figure 1A shows the effect of using different likelihood ratio thresholds on the reliability of predictions. Note that F-score (harmonic mean) is a measure that combines both precision and recall. As can be seen in Supplementary Table S1, increasing the likelihood ratio threshold only improves the precision, although, over a certain limit, this improvement is very minor. Based on our benchmarks, a safe threshold of 3.0 in the likelihood ratio was used to maximize the contribution of suboptimal phylogenies. In other words, trees reconstructed using a sub-optimal model in which the likelihood estimation is 3-times smaller than that of the tree reconstructed using the best-fitting model would be discarded.
Figure 1.

Parameter evaluation. The accuracy of predictions were investigated applying various cut-offs for the likelihood filter (A), orthology consistency score (B) and EL (C). The harmonic mean (F1.0, precision and recall equally weighted, see ‘Materials and Methods’ section) was calculated based on a subset of TreeFam-A reference set for human–mouse, human–zebra fish and human–fruit fly [100 orthogroups as in (24)] and YGOB reference set for S. cerevisiae-C. glabrata, and S. cerevisiae-A. gossypii. For the sets evaluated on TreeFam-A benchmark we did not use trees coming from this database.
A central parameter in the MetaPhOrs approach is the orthology consistency score (CSo). We assessed the effect of using different consistency-score cut-offs for the accuracy and sensitivity of orthology predictions. Our results (Figure 1B) show that, for most scenarios, the F-score remains stable over a wide range of consistency scores, dropping at very large values (>0.7). However, in the human–fruit fly scenario the optimal compromise between accuracy and sensitivity (i.e. the maximum F-score) is reached around CSo cut-off of 0.5 (i.e. at least half of the trees support an orthology relationship between these sequences). In this case, setting stricter CSo thresholds slightly increased the level of precision, but usually at a severe cost of recall (Supplementary Table S1). Finally, we measured the effect of using multiple independent sources (i.e. different databases or phylomes) for deriving a prediction. Figure 1C shows that the optimal F-scores vary for different datasets. For human–mouse, human–fruit fly and human–zebrafish, the best precision/recall compromises are achieved when two or three independent sources are used. In these cases, limiting predictions to those having a EL of 3 or higher, increases precision at a high cost of recall (Supplementary Table S1), since fewer protein pairs are present in trees from more than three independent datasets. In contrast, F-scores for fungal orthology relationships remain high up to an EL of 5, probably due to the fact that many different fungal datasets are present in the combined database (5 phylomes in PhylomeDB, fungal groups in EggNOG, Fungal orthogroups and OrthoMCL provide information on fungal orthology relationships).
Gaining genome coverage and prediction accuracy with MetaPhOrs-orthology
We then applied the pipeline over the total set of phylogenetic trees available at the above mentioned combined repository. In total, we analyzed 705 123 phylogenetic trees, of which 459 447 are from PhylomeDB, 122 003 from Ensembl, 8983 from fungal Orthogroups, 16 064 from TreeFam, 4875 from COG, 76 673 from OrthoMCL and 17 085 from EggNOG. Considering all predictions resulting from the analysis of each independent source of phylogenetic information, a total of 93 695 882 orthologous, and 213 938 235 paralogous pairs were predicted (using an orthology and paralogy consistency score cut-offs of ≥0.5 and >0.5, respectively), corresponding to 829 fully sequenced genomes. A phylogenetic distribution of the coverage of predictions for all genomes considered is shown in Figure 2. As expected, combining different sources of information provides a much higher coverage in terms of orthology and paralogy prediction (the contribution of each source to the increase of coverage can be explored in the on-line version of the figure at http://orthology.phylomedb.org/?q=stats).
Figure 2.

MetaPhOrs statistics. The orthology assignments for 829 complete genomes were mapped onto the tree of life (NCBI taxonomy tree). Bar charts around the tree represent the fraction of each genome for which orthologs have been identified (green) and with no orthologs identified (grey). The total length of each bar (grey + green fractions) is proportional to the logarithm of the number of genes in the genome. A higher resolution, interactive figure, showing the coverage of each independent dataset (PhylomeDB, Ensembl, EggNOG, Fungal Orthogroups, COG and TreeFAM) is available online (MetaPhOrs Overview at: http://orthology.phylomedb.org/?q=stats). The figure was constructed using iTOL MetaPhOrs statistics. Detailed statistics of MetaPhOrs and all of its subsequent databases are provided in Supplementary Table S2.
To assess whether the increase in coverage is accompanied by an improvement of precision and recall of predictions, we benchmarked our MetaPhOrs orthology predictions and compared them with the results of the individual databases and the results of combining only some of the databases (Figure 3). As it can be seen, all possible source combinations (red dots) lead to a significant increase in recall as compared with the individual databases (blue dots). However, this is generally achieved at the expense of precision. This loss of precision can be overcome, however, by increasing the EL threshold. Indeed, an optimal F-score is achieved with EL = 2, if precision and re-call are equally weighted (F1.0). Similarly, if precision is given a weight of 2 (F0.5), EL = 3 will be optimal. Thus, the MetaPhOrs pipeline provides a straightforward way of increasing both the precision and recall over that of any of the individual datasets included. Finally, we tested the performance of the MetaPhOrs implementation (using a CSo=0.5 and several EL thresholds) on a recently reported phylogeny-based benchmark (22) (Supplementary Table S3). This benchmark is based on the agreement (measured as the fraction of correct splits) between gene-trees generated from predicted orthologous sequences and a reference species tree. Although, this benchmark has several drawbacks such as the fact that it provides no information on the fraction of FN (true orthologs that are not predicted) or the assumption of a reference tree (specially problematic in bacteria), it nevertheless provides a common framework in which to evaluate predictions across a wide set of organisms. Our results provide a high fraction of correct splits for eukaryotes (90–92.9%, depending on the EL) and fungi (89.8–92.4%). Consistent with results from other databases (22), performance on bacteria is rather low (52.9–49%), which may point to problems of the use of a species tree as a benchmark for bacterial orthology. This might be related to problems caused by horizontal gene transfer events, which affect both phylogeny-based and graph-based orthology prediction methods (3). Indeed, it is remarkable that the bacterial dataset is the only one in which the fraction of correct splits decreases as more stringent EL is used (Supplementary Material).
Figure 3.

Accuracy of the MetaPhOrs approach using different datasets. Recall and precision scores of our pipeline applied to individual datasets (blue rhombus), combined datasets (red squares) and the full MetaPhOrs approach (black double triangles) were calculated based on TreeFam-A reference set (see ‘Materials and Methods’ section). Note that results on accuracy do not correspond to predictions as given by a given repository (e.g. OrthoMCL), but to our phylogeny-based approach based on trees derived for data contained in such repository (e.g. species-overlap algorithm applied on trees derived from OrthoMCL families). In order to avoid circularity in our benchmark, trees coming from TreeFam-A were not considered in any dataset. For the combined methods, predictions from two or more sources were summed together: orthology was assigned if confirmed by at least one repository, paralogy was assumed only if there were more paralogy signals than orthology. For the full MetaPhOrs approach, we used several level (EL) thresholds; for instance, for EL = 2 only predictions confirmed by any combination of 2 independent sources (phylomes or databases) are taken into account. A consistency threshold (CSo) of 0.5 is applied. Plotted curves represent combinations of recall and precision providing identical Fβ scores as the best performing method. Two scenarios are considered: recall and precision are equally weighted (blue thin line, F1.0 = 0.817); or precision is two times more important than recall (grey thick line, F0.5 = 0.837). The ranking of the best methods can be defined based on relative distance of each method to the curve representing F score of the best scoring method. MetaPhOrs with EL cut-off of 2 (MO el = 2; F1.0 = 0.817) and MetaPhOrs with EL cut-off of 3 (MO el = 3; F1.0 = 0.797) are the best performing approaches in the first scenario. In the second scenario, MetaPhOrs with EL cut-off of 3 (MO el = 3; F0.5 = 0.837), MetaPhOrs with EL cut-off of 4 (MO el = 4; F0.5 = 0.824) and MetaPhOrs with Evidence level cut-off of 2 (MO el = 2; F0.5 = 0.807) perform the best.
The MetaPhOrs web server
To facilitate public access to this resource, we have developed a website that allows accessing all pre-computed homology data (http://orthology.phylomedb.org). Using the web interface, orthology and paralogy predictions can be retrieved in three ways: (i) searching for all predictions for a particular protein; (ii) downloading all genome-wide predictions for a given pair of species; or (iii) downloading the predictions for multiple proteins. Moreover, the results can be filtered using various consistency score and EL thresholds. When the EL filter is set, only predictions that have been confirmed by a given number of independent sources will be retrieved. By default, EL threshold is set to 1, meaning that all predictions will be returned. Each results page displays the predicted orthology and paralogy relationships together with their consistency score, EL and number of processed trees. In addition, the structure of orthology/paralogy relationship (i.e. one-to-one, one-to-many or many-to-many) is shown. Finally, all trees used for a given prediction can be explored by following the link to the original phylogenetic repository.
CONCLUDING REMARKS
Currently, a plethora of orthology prediction methods and repositories do exist that have different focuses. The scope of orthology relationships required, will always depend on the underlying question that one wants to address. Considering this, there is probably no single repository or method that is suitable to address all questions, and thus a certain diversity of choice will always be beneficial. Our approach to this issue has been to integrate phylogenetic and homology information contained in various sources, while using a common phylogeny-based criterion to define orthology and paralogy relationships. Different repositories partially overlap and some databases contain redundant information for the same pair of sequences. Such partial redundancy can be exploited in two ways by combining different sources: first, given the different focuses of the alternative databases, the coverage of predictions over fully sequenced genomes increases when more than one source is used; secondly, the level of consistency across predictions from different sources can be used to assess the reliability of a given orthology or paralogy assignment. Here, by combining information from alternative sources of phylogenetic information, we have shown that, besides increasing the coverage of predictions, both the EL and the consistency score are appropriate measures for the expected reliability of a given prediction. Thus, MetaPhOrs can serve as a global repository of highly accurate, phylogeny-based orthology and paralogy predictions. We plan to update the MetaPhOrs web server every few months, to cope with the constant upgrading of the underlying source databases. In the future, we plan to broaden the scope of MetaPhOrs orthology predictions by incorporating additional phylogenetic sources.
SUPPLEMENTARY DATA
Supplementary Data are available at NAR Online.
Supplementary Data
FUNDING
La Caixa pre-doctoral fellowship to L.P.; partial support by a grant from the Spanish Ministry of Science (BFU2009-09168) for T.G.’s research. Funding for open access charge: Spanish Ministry of Science (BFU2009-09168).
Conflict of interest statement. None declared.
ACKNOWLEDGEMENTS
The authors want to acknowledge Diego Kormes and Salvador Capella-Gutíerrez for their help with phylogenetic reconstruction of EggNOG, OrthoMCL and COG families.
REFERENCES
- 1.Fitch WM. Distinguishing homologous from analogous proteins. Syst. Zool. 1970;19:99–113. [PubMed] [Google Scholar]
- 2.Gabaldón T, Dessimoz C, Huxley-Jones J, Vilella AJ, Sonnhammer EL, Lewis S. Joining forces in the quest for orthologs. Genome Biol. 2009;10:403. doi: 10.1186/gb-2009-10-9-403. [DOI] [PMC free article] [PubMed] [Google Scholar]
- 3.Kuzniar A, van Ham RC, Pongor S, Leunissen JA. The quest for orthologs: finding the corresponding gene across genomes. Trends Genet. 2008;24:539–551. doi: 10.1016/j.tig.2008.08.009. [DOI] [PubMed] [Google Scholar]
- 4.Gabaldón T. Large-scale assignment of orthology: back to phylogenetics? Genome Biol. 2008;9:235. doi: 10.1186/gb-2008-9-10-235. [DOI] [PMC free article] [PubMed] [Google Scholar]
- 5.Huerta-Cepas J, Dopazo H, Dopazo J, Gabaldón T. The human phylome. Genome Biol. 2007;8:R109. doi: 10.1186/gb-2007-8-6-r109. [DOI] [PMC free article] [PubMed] [Google Scholar]
- 6.Huerta-Cepas J, Bueno A, Dopazo J, Gabaldón T. PhylomeDB: a database for genome-wide collections of gene phylogenies. Nucleic Acids Res. 2008;36:D491–D496. doi: 10.1093/nar/gkm899. [DOI] [PMC free article] [PubMed] [Google Scholar]
- 7.Vilella AJ, Severin J, Ureta-Vidal A, Heng L, Durbin R, Birney E. EnsemblCompara GeneTrees: complete, duplication-aware phylogenetic trees in vertebrates. Genome Res. 2009;19:327–335. doi: 10.1101/gr.073585.107. [DOI] [PMC free article] [PubMed] [Google Scholar]
- 8.Muller J, Szklarczyk D, Julien P, Letunic I, Roth A, Kuhn M, Powell S, von Mering C, Doerks T, Jensen LJ, et al. eggNOG v2.0: extending the evolutionary genealogy of genes with enhanced non-supervised orthologous groups, species and functional annotations. Nucleic Acids Res. 2010;38:D190–D195. doi: 10.1093/nar/gkp951. [DOI] [PMC free article] [PubMed] [Google Scholar]
- 9.Ruan J, Li H, Chen Z, Coghlan A, Coin LJ, Guo Y, Heriche JK, Hu Y, Kristiansen K, Li R, et al. TreeFam: 2008 Update. Nucleic Acids Res. 2008;36:D735–D740. doi: 10.1093/nar/gkm1005. [DOI] [PMC free article] [PubMed] [Google Scholar]
- 10.Wallace IM, O’Sullivan O, Higgins DG, Notredame C. M-Coffee: combining multiple sequence alignment methods with T-Coffee. Nucleic Acids Res. 2006;34:1692–1699. doi: 10.1093/nar/gkl091. [DOI] [PMC free article] [PubMed] [Google Scholar]
- 11.Capella-Gutierrez S, Silla-Martinez JM, Gabaldón T. trimAl: a tool for automated alignment trimming in large-scale phylogenetic analyses. Bioinformatics. 2009;25:1972–1973. doi: 10.1093/bioinformatics/btp348. [DOI] [PMC free article] [PubMed] [Google Scholar]
- 12.Elsik CG, Mackey AJ, Reese JT, Milshina NV, Roos DS, Weinstock GM. Creating a honey bee consensus gene set. Genome Biol. 2007;8:R13. doi: 10.1186/gb-2007-8-1-r13. [DOI] [PMC free article] [PubMed] [Google Scholar]
- 13.Wapinski I, Pfeffer A, Friedman N, Regev A. Natural history and evolutionary principles of gene duplication in fungi. Nature. 2007;449:54–61. doi: 10.1038/nature06107. [DOI] [PubMed] [Google Scholar]
- 14.Chen F, Mackey AJ, Stoeckert CJ, Jr, Roos DS. OrthoMCL-DB: querying a comprehensive multi-species collection of ortholog groups. Nucleic Acids Res. 2006;34:D363–D368. doi: 10.1093/nar/gkj123. [DOI] [PMC free article] [PubMed] [Google Scholar]
- 15.Tatusov RL, Fedorova ND, Jackson JJ, Jacobs AR, Kiryutin B, Koonin EV, Krylov DM, Mazumder R, Mekhedov SL, Nikolskaya AN, et al. The COG database: an updated version includes eukaryotes. BMC Bioinformatics. 2003;4:41. doi: 10.1186/1471-2105-4-41. [DOI] [PMC free article] [PubMed] [Google Scholar]
- 16.Guindon S, Gascuel O. A simple, fast, and accurate algorithm to estimate large phylogenies by maximum likelihood. Syst. Biol. 2003;52:696–704. doi: 10.1080/10635150390235520. [DOI] [PubMed] [Google Scholar]
- 17.Edgar RC. MUSCLE: a multiple sequence alignment method with reduced time and space complexity. BMC Bioinformatics. 2004;5:113. doi: 10.1186/1471-2105-5-113. [DOI] [PMC free article] [PubMed] [Google Scholar]
- 18.Akaike H. Proceedings of the 2nd International Symposium on Information Theory. Budapest, Hungary: 1973. Information theory and an extension of the maximum likelihood principle; pp. 267–281. [Google Scholar]
- 19.Altschul SF, Gish W, Miller W, Myers EW, Lipman DJ. Basic local alignment search tool. J. Mol. Biol. 1990;215:403–410. doi: 10.1016/S0022-2836(05)80360-2. [DOI] [PubMed] [Google Scholar]
- 20.Huerta-Cepas J, Dopazo J, Gabaldón T. ETE: a python Environment for tree exploration. BMC Bioinformatics. 2010;11:24. doi: 10.1186/1471-2105-11-24. [DOI] [PMC free article] [PubMed] [Google Scholar]
- 21.Byrne KP, Wolfe KH. Visualizing syntenic relationships among the hemiascomycetes with the Yeast Gene Order Browser. Nucleic Acids Res. 2006;34:D452–D455. doi: 10.1093/nar/gkj041. [DOI] [PMC free article] [PubMed] [Google Scholar]
- 22.Altenhoff AM, Dessimoz C. Phylogenetic and functional assessment of orthologs inference projects and methods. PLoS Comput. Biol. 2009;5:e1000262. doi: 10.1371/journal.pcbi.1000262. [DOI] [PMC free article] [PubMed] [Google Scholar]
- 23.Marcet-Houben M, Gabaldón T. The tree versus the forest: the fungal tree of life and the topological diversity within the yeast phylome. PLoS One. 2009;4:e4357. doi: 10.1371/journal.pone.0004357. [DOI] [PMC free article] [PubMed] [Google Scholar]
- 24.Datta RS, Meacham C, Samad B, Neyer C, Sjolander K. Berkeley PHOG: PhyloFacts orthology group prediction web server. Nucleic Acids Res. 2009;37:W84–W89. doi: 10.1093/nar/gkp373. [DOI] [PMC free article] [PubMed] [Google Scholar]
- 25.Wapinski I, Pfeffer A, Friedman N, Regev A. Automatic genome-wide reconstruction of phylogenetic gene trees. Bioinformatics. 2007;23:i549–i558. doi: 10.1093/bioinformatics/btm193. [DOI] [PubMed] [Google Scholar]
Associated Data
This section collects any data citations, data availability statements, or supplementary materials included in this article.
Supplementary Materials
Supplementary Data