A cross-platform analysis of 14,177 expression quantitative trait loci derived from lymphoblastoid cell lines (original) (raw)
Abstract
Gene expression levels can be an important link DNA between variation and phenotypic manifestations. Our previous map of global gene expression, based on ∼400K single nucleotide polymorphisms (SNPs) and 50K transcripts in 400 sib pairs from the MRCA family panel, has been widely used to interpret the results of genome-wide association studies (GWASs). Here, we more than double the size of our initial data set with expression data on 550 additional individuals from the MRCE family panel using the Illumina whole-genome expression array. We have used new statistical methods for dimension reduction to account for nongenetic effects in estimates of expression levels, and we have also included SNPs imputed from the 1000 Genomes Project. Our methods reduced false-discovery rates and increased the number of expression quantitative trait loci (eQTLs) mapped either locally or at a distance (i.e., in cis or trans) from 1534 in the MRCA data set to 4452 (with <5% FDR). Imputation of 1000 Genomes SNPs further increased the number of eQTLs to 7302. Using the same methods and imputed SNPs in the newly acquired MRCE data set, we identified eQTLs for 9000 genes. The combined results identify strong local and distant effects for transcripts from 14,177 genes. Our eQTL database based on these results is freely available to help define the function of disease-associated variants.
Expression quantitative trait loci (eQTLs) provide insights into the regulation of transcription and aid in interpretation of genome-wide association studies (GWASs) (Stranger et al. 2005, 2007a,b; Dixon et al. 2007; Moffatt et al. 2007; Cookson et al. 2009; Heid et al. 2010; Hsu et al. 2010; Lango Allen et al. 2010; Speliotes et al. 2010; Chu et al. 2011). Transcript abundances for 40%–70% of genes are heritable, but only 25%–35% of the heritable component in expression levels has been explained by the eQTLs so far identified (Dixon et al. 2007; Goring et al. 2007; Stranger et al. 2007a,b; Emilsson et al. 2008).
The lack of eQTLs for many heritable transcript abundances may be due to multiple factors. These include the limited sample sizes of previous studies, high signal noise in microarray measurements of transcript abundances, variation in biological and technical factors that increase measurement errors in gene expression abundance, limited coverage of genetic variation using commercial genotyping platforms, and incomplete coverage of the transcriptome by gene expression arrays.
In order to increase the power of eQTL mapping and to build a more complete map of single nucleotide polymorphisms (SNPs) influencing gene expression, we have expanded our previous analysis (Dixon et al. 2007) by including data generated using newer whole-genome gene expression arrays. We have refined our analyses using newly developed statistical methods (Leek and Storey 2007; Stegle et al. 2010) together with an expanded catalog of genetic variation generated by the 1000 Genomes Project. In this introduction, we first briefly review the rationale for each of these refinements.
Variation in the conditions and timing of experiments and operator characteristics may introduce variation in the measurements of transcript abundances, as may batch effects on the manufacture of microarray chips (Akey et al. 2007). Biological conditions such as stage of the cells when RNA is extracted and other unknown factors may also form important influences on the measurement of gene expression. Despite these confounders, the deep information among the thousands of transcripts on microarrays may be used to improve the accuracy of gene expression measurements. All probes on an individual microarray undergo identical experimental conditions that can be summarized by dimension reduction methods, such as principal components analysis (PCA) or factor analysis (Leek and Storey 2007; Stegle et al. 2010). We systematically evaluate this strategy in our data sets and show that the top principal components (PCs) of gene expression are highly correlated with RNA extraction and cDNA synthesis dates, the date that the sample was fragmented, and the date of chip hybridization. We go on to show that including these PCs in downstream analyses reduces false positives and increases power for both local and distant eQTLs.
Commonly used gene expression microarrays are manufactured using chip designs that may lead to differential coverage of the transcriptome. For example, the probesets on the Affymetrix U133 Plus 2 chip consist of multiple probes, each 25 bp long. The probeset level intensity combining all probes is used as the measure of transcript abundance. On the other hand, the Illumina Human6 V1 array has only one probe of 50 bp long per transcript. Affymetrix and Illumina probes may sit in different positions in a gene and, as a consequence, produce different intensities of gene expression measurements. In addition, the genes that are represented on an array may differ between platforms, so that only 7601 genes are covered by both the Affymetrix and Illumina microarrays discussed above. Newer chip designs such as the Affymetrix Human Gene 1.0 ST arrays are more inclusive, and RNA sequencing can now provide comprehensive cover of the transcriptome, although its cost and complexity still limits its utility. While waiting for the technology to evolve, it is of importance to recognize that individual eQTL detection may be limited by the experimental platform chosen.
Genotype imputation is commonly used to increase the power and coverage of individual GWASs and to facilitate meta-analysis across studies utilizing different genotyping platforms (Scott et al. 2007; Wellcome Trust Case Control Consortium 2007; Sanna et al. 2008; Willer et al. 2008). To date, most studies using genotype imputation have used HapMap samples as a template reference panel (Frazer et al. 2007). The 1000 Genomes Project Consortium (in the following text abbreviated as 1000G) (1000 Genomes Project Consortium 2010; http://www.1000genomes.org) aims at developing a comprehensive catalog of human genetic variants of SNP and structure variants with allele frequency down to 1%. One immediate benefit from this project is a deeper and broader reference panel of variants for genotype imputation. Common SNPs that were implicitly tested for association by being tagged by one or more HapMap SNPs may now be directly imputed and tested.
In this study we use two large gene expression data sets from nuclear families ascertained through a child with asthma using the Affymetrix Hu133A platform (the MRCA panel) (Dixon et al. 2007) or eczema using the Illumina bead array platform (the MRCE panel) (Morar et al. 2007). The study of families allows estimations of heritability for each expression trait. We compare the power of eQTL mapping using imputation of the new reference panel of 8 million SNPs and imputation of HapMap SNPs. We are able to identify new eQTLs and categorize them by allele frequency, genome coverage, effect size, and trait heritability.
We have defined local associations as expression SNP (eSNP) and gene within 1 Mb on the same chromosome (the equivalent of cis), and distant associations as eSNP and gene >1 Mb away from gene, either on the same chromosome or on different chromosomes (the equivalent of trans).
Results
The first sample (MRCA) contained 206 siblings of British descent (Dixon et al. 2007). Global gene expression in lymphoblastoid cell lines (LCLs) was measured using Affymetrix HG-U133 Plus 2.0 chips. All siblings were genotyped using the Illumina Sentrix HumanHap300 BeadChip (ILMN300K), the Illumina Sentrix Human-1 Genotyping BeadChip (ILMN100K), or both. The second sample (MRCE) of 950 individuals from 320 families of British descent was genotyped using the Illumina Sentrix HumanHap300 Genotyping BeadChip. Expression arrays using Illumina Human 6 BeadChips were available on 550 children. As Illumina probe and Affymetrix probesets annotated to the same gene may target different transcripts, we have first analyzed the data as individual transcripts identified by their respective Illumina or Affymetrix identification.
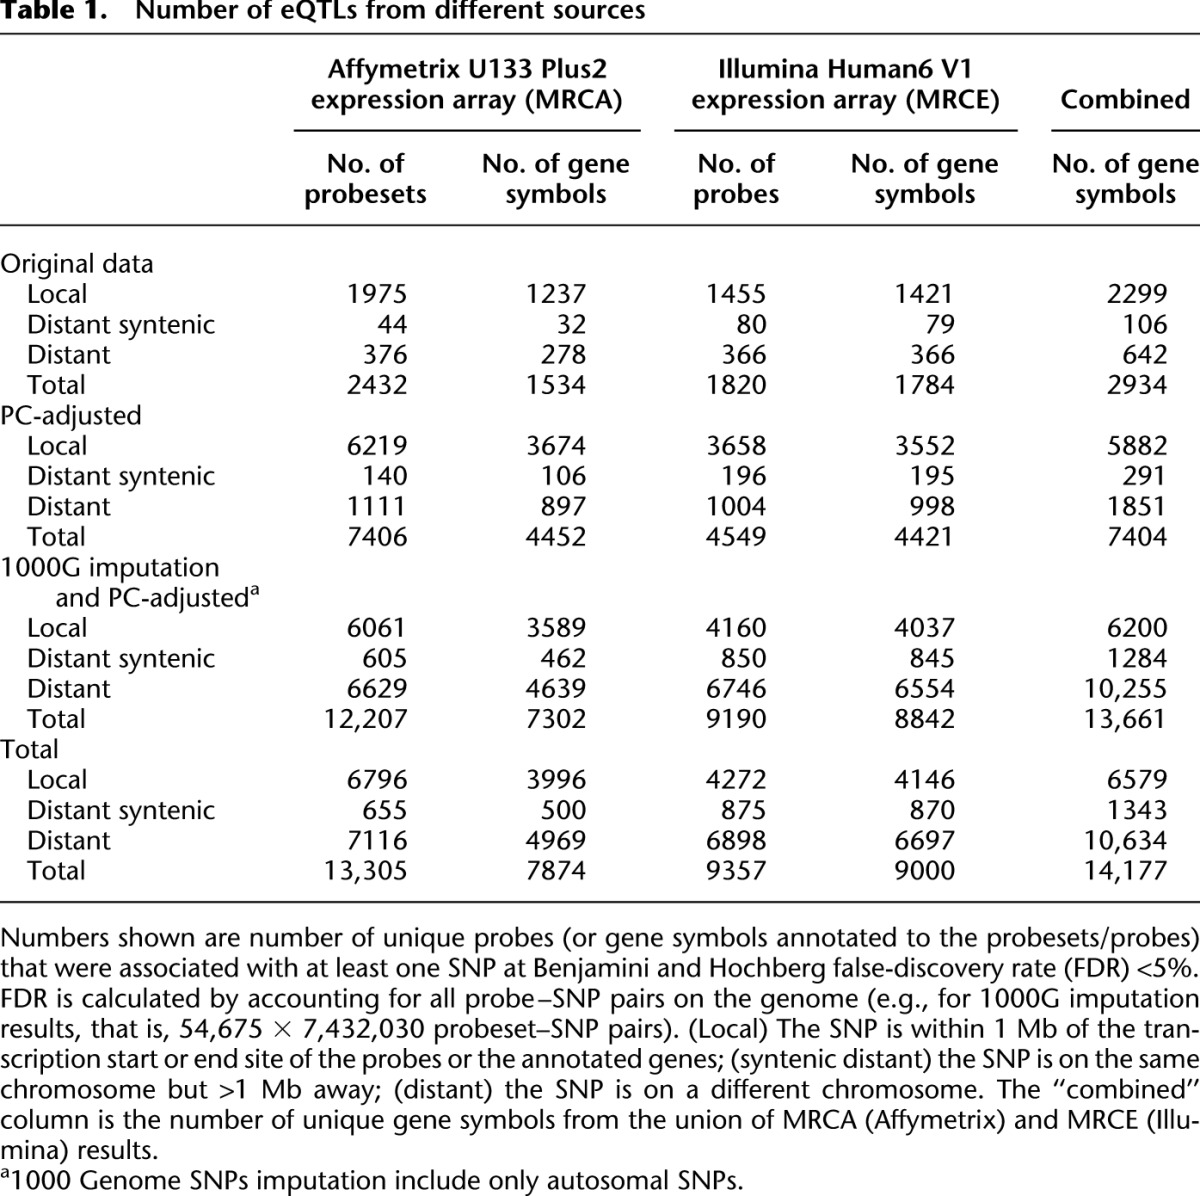
We carried out variance component-based association analysis at each SNP (Abecasis et al. 2002; Abecasis and Wigginton 2005). Before adjustments for nongenetic effects and imputation, we mapped eQTLs for 1534 genes (corresponding to 2432 Affymetrix probesets), either locally or at a distance for the MRCA data set, and 1784 eQTLs (corresponding to 1820 Illumina probes) for the MRCE data set (Table 1). We found 2934 individual eQTLs in the combined data set (Table 1).
Table 1.
Number of eQTLs from different sources
Adjusting for nongenetic effects improves power of eQTL mapping
We estimated PCs from the gene expression values in the family panels, and progressively included the top PCs in the eQTL regression model as covariates until the number of transcripts mapped locally no longer increased. In the final models, we included the top 69 PCs in the MRCA (Affymetrix) expression data set and the top 61 PCs in the MRCE (Illumina) data set. Including data on batch and experimental conditions in the model did not change the findings, indicating that the PCs adjusted well for these factors. Overall, including PCs in the MRCA model identified eQTLs for 7406 probesets (6219 mapped locally) compared with 2432 probesets (1975 mapped locally) in the original data set (Table 1).
Previous studies have suggested that the majority of human eQTLs map locally and that distant eQTL are less likely to replicate (Dixon et al. 2007; Schadt et al. 2008). We therefore used the proportion of distant effects among highly significant eQTLs as an initial conservative estimate of the false-discovery rate (conservativeFDR). Among the top 1200 eQTLs, both our new analysis and the original analysis detected a similar number of distant eQTLs (Fig. 1). However, as the number of eQTLs increased, the fraction of distant eQTL and the estimated conservativeFDR increased rapidly for our original analysis but not for the PC-adjusted analysis. Among the top 3000 eQTLs, the conservativeFDR estimate in the original analysis was ∼30% compared with 1% for the PC-adjusted analysis.
Figure 1.

Empirical estimate of false discovery rate. (noPC) Using original expression value; (PC) adjusting nongenetic effect using the top 69 principal components; (1000G) imputation using SNPs from the 1000 Genomes project; (HapMap) imputation using HapMap2 SNPs; (300K) using autosomal SNPs from the Illumina 300K panel.
To further assess the false-discovery rate (FDR) for local and distant eQTLs, we divided the MRCA sample into two independent data sets with approximately 200 subjects per data set. One data set was used for discovery; the other, for replication. For multiple significance thresholds, we calculated the proportion of discovered eQTLs that could be replicated in the second data set with LOD > 3 (_P_-value of < ∼2 × 10⁻⁴) (Fig. 2). Local and distant syntenic effects had higher replication rates even when using low thresholds for significance, confirming prior observations that local eQTLs are more likely to represent true associations. The PC-adjusted analysis gave higher replication rates for both local and distant eQTLs, indicating that PC-improved analysis helps define reliable distant eQTLs (note that the replication rate here is likely underestimated due to sample size limitation) (Ding et al. 2010).
Figure 2.

Replication rate by distance from the eQTL to the transcript. (Red lines) Replication of eQTL. (A) Local effect; (B) distant syntenic effect (>1 Mb but gene and SNP on the same chromosome); and (C) distant effect (on a different chromosome). The analysis is based on autosomal SNPs from the Illumina 300K panel.
Encouraged by the low FDR of our PC-adjusted analysis, we used a sequential search to determine the number of PC that maximized power (Supplemental Fig. 1; Liang et al. 2009). The number of genes mapped locally (LOD > 6 or P < 1.5 × 10⁻⁷, the threshold we previously used to define genome-wide significance in the same data set) (Dixon et al. 2007) was used as an indicator of power. In the MRCA data set, as we gradually included additional PCs in the model, the number of local eQTLs (autosomes plus chromosome X) increased gradually from 2175 (with no PCs) to 6238 (when 69 PCs were used to control for nongenetic variation). Further increases in the number of PCs led to decreases in the number of eQTLs detected (and likely power). This eventual decrease in power may be explained because the later PCs are dominated by contributions from a few transcripts. The optimal number of PCs seems to vary by sample (e.g., 61 for the MRCE panel) and can be estimated in other data by using a similar procedure to that used here (Supplemental Fig. 1).
Imputation accuracy
We used the MaCH program to identify stretches of haplotypes shared between the study samples and the HapMap or 1000G SNPs reference panel and to impute their SNPs into the study sample. In both cases, SNP imputation achieved high estimated imputation accuracy, with 2,492,059 and 7,432,030 SNPs imputed with _R_2 > 0.3, respectively, in the MRCA data set, and 2,429,403 and 7,378,292 SNPs, respectively, in the MRCE data set with _R_2 > 0.3. (The R2 measure estimates the correlation between imputed and true genotypes, based on the residual uncertainty in estimated genotypes.) We further assessed the accuracy of genotype imputation by comparing imputed and experimentally derived genotypes on a genomic scale. In the first sample (MRCA), individuals were genotyped on two platforms (Illumina 300K or ILMN300K and Illumina 100K or ILMN100K). The ILMN300K genotypes were used to drive imputation. We then used genotypes for markers in the ILMN100K panel but not present in the ILMN300K panel to assess the accuracy of imputed genotypes. Accuracy was measured by correlation between true allele counts and imputed allele counts.
After QC filtering the ILMN100K SNPs and removing SNPs used for imputation, we find 58,819 autosomal SNPs from the ILMN100K panel overlap with the HapMap, and 69,555 SNPs overlap with the 1000G panel. In the background of Figure 3A, we plot the correlation (_R_2) between ILMN100K allele counts and 1000G imputed allele dosage by minor allele frequency (MAF; estimated from ILMN100K genotypes). Most of the SNPs have high imputation accuracy, including rare SNPs. We then calculated the LOESS (locally weighted polynomial regression) smooth curve of _R_2 by MAF for three settings: (1) SNPs present on HapMap and imputed using the HapMap reference panel (red line, _R_2 calculated using HapMap imputation), (2) SNPs present on HapMap but imputed using the 1000G reference panel (blue line), and (3) SNPs not present on HapMap and imputed using the 1000G reference panel (green line). At the HapMap SNPs (settings 1 and 2), imputation using the 1000G reference achieved slightly lower quality compared with using the HapMap reference. This is probably because microarray-based genotyping is still more reliable than the low-coverage, next-generation sequencing used in the 1000 Genomes Project pilot 1 study. At the non-HapMap sites, 1000G imputation still achieved high quality, but the reduction of imputation accuracy was more noticeable. For rare variants (MAF > 1%), average _R_2 remained above 0.6. The relationship between imputation quality and allele frequency does not change if we used allele frequencies from the reference panel (Fig. 3B).
Figure 3.

Imputation accuracy by minor allele frequency (MAF; MRCA panel). (A) Correlation (_R_2) between 1000G imputed allele dosage derived from Illumina 300K arrays and true allele counts measured by Illumina 100K arrays, plotted by MAF. (B) Histogram of correlation with true allele counts by MAF in sample (upper panels) and minor allele counts in the 1000G reference haplotype. Note that there are no data in the bottom left panel following removal of singletons from the reference haplotype.
Power gain from genotype imputation
The global assessment of mRNA transcript levels includes a variety of traits, each with an unknown genetic architecture. We therefore used our data set as an exemplar to explore the power of different analytical strategies by tallying the number of local signals that reach genome-wide significance levels.
We investigated six strategies: traditional and PC-adjusted expression analysis, each combined with three marker panels (Illumina 300K genotype, HapMap2 imputation, and 1000G imputation). For each strategy, we estimated the significance threshold for 5% FDR accounting for the number of all transcript–SNP pairs. We then counted the number of transcripts for which at least one SNP within 1 Mb exceeds that threshold as an indicator of the power of that strategy (Fig. 4).
Figure 4.

Comparison of number of local eQTLs identified by directly genotyped SNPs, imputed HapMap2 SNPs, and imputed SNPs from the 1000 Genomes Project. (A) Results from Affymetrix expression data in the MRCA panel. (B) Results from Illumina expression data in the MRCE panel. (Blue bars) Original unadjusted expression; (red bars) expression values adjusted by the top principal components.
Across all three SNP panels, adjusting for nongenetic effects using PC generated threefold more eQTLs than the unadjusted analysis. For either adjusted or unadjusted expression data, imputing 2.4M HapMap SNPs gained 6%–7% additional signals, while imputing the ∼8M 1000G SNPs further increased the number of signals by 5%–8% (a total increment of 12%–15%). Power gain from increased marker density thus appeared to be largely independent of the beneficial effects of reducing measurement error.
The increase of power through imputation and PC adjustment was largest for transcripts with heritability (H2; narrow sense total heritability) (Dixon et al. 2007) in the middle range (Fig. 5). The biggest gain in the MRCA data set was observed at 52% of transcripts with H2 between 0.6 and 0.7 mapped in locally or at a distance after PC adjustment and imputation compared with 20% before the improved analysis. For the MRCE data set, the most improved category was for H2 between 0.3 and 0.4, with increments from 15% to 66%.
Figure 5.

Proportion of significant transcripts by overall heritability. (A) Unadjusted expression data and SNPs from the Illumina 300K panel in the MRCA subjects. (B) PC-adjusted expression data and the imputation of 1000G SNPs in the MRCA subjects. (C) Unadjusted expression data and SNPs from the Illumina 300K panel in the MRCE subjects. (D) PC-adjusted expression data and the imputation of 1000G SNPs in the MRCE subjects. The number of transcripts in each heritability category is given at the bottom of each bar.
In addition to the gain in power, genotype imputation also produced a much denser and better localized map of eQTLs, as illustrated by the TIMM22 locus from the MRCA data set (Fig. 6). In this example, HapMap imputation produced minimal additional information, but the 1000G imputation increased the maximum –log10(P) from nine to 23 and allowed finer localization of the peak effect to the 3′ UTR of TIMM22.
Figure 6.

cis eQTL of the gene TIMM22. A map of association of SNPs to transcript abundance of the TIMM22 gene exemplifies the progressive increase in information for the experimental genotypes (A), experimental plus HapMap imputed SNPs (B), and experimental, HapMap imputed and 1000G imputed SNPs (C). The gray vertical bar at the gene TIMM22 indicates the position of the Affymetrix probe
Characteristics of new hits
We next characterized the source of power gains from the 1000G SNP panel compared with the HapMap SNP panel, focusing on transcripts not associated with SNPs in the HapMap imputation but mapped locally within 1 Mb with at least one 1000G imputed SNP. We paired the peak SNP in the 1000G panel with the peak SNP in the HapMap panel for each transcript and calculated both the linkage disequilibrium (LD) (evaluated using the 1000G haplotypes) between them and the difference in association significance [–log10(P)]. We found most missed hits were due to low LD between HapMap SNPs and the peak SNP identified after 1000G imputation (Supplemental Fig. 4).
The peak-SNPs for these eQTLs showed a full spectrum of minor allele frequencies with a skew toward relatively rare variants (MAF < 5%) (Supplemental Fig. 3). This indicates that the inclusion of rare variants in the 1000G imputation reference panel does help identify their contribution to eQTLs. Many low-frequency variants explain a large fraction of the expression trait variance (Supplemental Fig. 4), some of which can account for 30%–50% of the total variation in an expression trait. This suggests that the application of 1000G SNP-based imputation to existing GWASs may resolve part of the missing heritability complex traits.
Cross-platform comparisons
The association analyses above were carried out with individual transcripts, identified by Affymetrix or Illumina probes. In order to facilitate comparison between platforms, we next analyzed the results at the level of individual genes, identified by the Affymetrix or Illumina annotation. We defined that a gene was associated with an eSNP if any probe belonging to the gene was significantly (FDR < 5%) associated with the SNP. We note that Illumina and Affymetrix probesets annotated to the same gene may target different transcripts of that gene with the possibility of different association results (Veyrieras et al. 2012).
Using a common set of markers from 1000 Genomes SNP imputation, the MRCA (Affymetrix) and the MRCE (Illumina) data together identified genome-wide significant (Benjamini and Hochberg FDR < 5%) (Benjamini and Hochberg 1995) eQTLs for transcripts from 13,661 autosomal genes. We found shared eQTLs for 2483 genes in both MRCA and MRCE data set, while 4819 genes were only mapped by the MRCA data and 6358 genes were specific to MRCE data (Supplemental Fig. 5). For particular gene–SNP associations, there were 136,466 gene–SNP pairs mapped in both MRCA and MRCE, while 416,952 were specific to MRCA and 492,861 were specific to MRCE.
The large fraction of eQTLs specific to each platform is likely due to their particular designs (Veyrieras et al. 2012). There are 7601 genes queried by at least one probe in both Affymetrix U133 Plus2 and Illumina Human6 V1 chips. Among these, 5625 genes were associated with an eQTL, and 2483 of them were mapped in both MRCA and MRCE (986 genes specific to MRCA and 2156 genes specific to MRCE). These findings are consistent with other studies that suggest that these Affymetrix and Illumina arrays provide complementary information for gene expression (Pedotti et al. 2008).
We carried out a fixed effect meta-analysis on eQTLs with FDR < 5% in both platforms, testing whether a SNP is associated with the expression of any possible transcripts belong to the gene. Although this did not provide effect sizes that were easily interpretable biologically, the power to detect associations to many transcripts was increased (Supplemental Fig. 5).
Functional analysis of identified eQTLs
We sought information of the function of the eQTLs identified in this study by taking the pooled Affymetrix and Illumina expression results and grouping them into Gene Ontology (GO) categories using annotation information downloaded from the manufacturer's website. We counted the percentage of probes mapped by at least one SNP (probes representing one of the 14,177 genes in Table 1) for each GO category and tested whether this percentage was significantly higher than a random category of probes of the same size. Both _Z_-score and permutation-based _P_-values were used to assess significance. Accounting for 461 GO terms and a 5% family-wise false-positive rate, the Bonferroni correction gave a significant _P_-value threshold of 1.08 × 10⁻⁴. We found that transcripts with the strongest eQTLs were associated with the regulation of transcription (Supplemental Table 1). Highly significant enrichment was also found for categories concerning protein, lipid, and carbohydrate metabolism. While the evolutionary value of genetic variation in metabolism is clear, it was unexpected that the most variably expressed genes in the human genome may be regulators of transcription. Immune response genes were significantly overrepresented among eQTLs, although to a lesser extent, reflecting the genome response to a different kind of environmental pressure.
We also examined the known SNPs from GWASs of complex diseases and traits (downloaded from http://www.genome.gov/GWAStudies/ on August 15, 2012). Considering the diseases and traits with more than 10 GWAS significant SNPs (Supplemental Table 2), we found that that autoimmune disease–associated SNPs were most likely to influence eQTLs, whereas psychological and psychiatric associations showed minimal enrichment of eQTLs. This may be because our eQTLs are derived from LCL, whereas neuropsychiatric traits derive from functional variation in brain tissue. Alternatively, neuropsychiatric traits may be more often due to rare coding variants or private mutations.
We have systematically tabulated which GWAS SNPs are also eSNPs (Supplemental Table 3). These data may be sorted and searched by disease or chromosomal position and contain numerous examples where the eQTL data either confirms the suspected gene or strongly suggests an alternative.
Discussion
In this study we generated two large eQTL databases for LCLs that identify robust local and distant eQTLs for more than 14,000 genes. This is more than six times larger than our previous eQTL database (Dixon et al. 2007), which has been used to identify association with expression for SNPs associated with asthma (Moffatt et al. 2007), Crohn's disease (Libioulle et al. 2007), and type 1 diabetes (Plagnol et al. 2009). Even before publication, our two newly developed eQTL databases have been used to interpret findings from large-scale GWAS, including human height (Lango Allen et al. 2010), body mass index (Speliotes et al. 2010), waist–hip ratio (Heid et al. 2010), osteoporosis-related traits (Hsu et al. 2010), Graves' disease (Chu et al. 2011), pancreatic cancer (Wu et al. 2012), and pathways associated with basal cell skin carcinoma (Zhang et al. 2012). Our systematic investigation of the GWAS database presented in Supplemental Table 3 suggests that eQTL analyses may add to the understanding of many other loci mapped for complex genetic diseases.
Expression QTL results can be used to prioritize genes in a region of association before undertaking laborious and expensive analysis in animal models and other systems (Teslovich et al. 2010). Current results suggest that many eQTLs could be shared across tissues (Ding et al. 2010) and that constructing a comprehensive catalog may increase the chances of capturing relevant transcripts for diseases that primarily affect particular organs and for which the relevant transcripts are only incidentally expressed in blood. Tissue-specific eQTLs nevertheless remain the gold standard when they are not limited by availability of appropriate biological samples.
The full spectrum of genetic architectures represented by gene expression traits provides a unique opportunity to empirically assess the power of different designs for association studies. We have shown here, for example, that reduction in gene expression measurement noise by PC analysis can markedly improve the ability to identify novel eQTLs.
Similar approaches have previously been shown to improve power for eQTL mapping (Leek and Storey 2007; Choy et al. 2008; Kang et al. 2008; Listgarten et al. 2010; Pickrell et al. 2010; Stegle et al. 2010). Compared to the linear mixed model analyses (Kang et al. 2008; Listgarten et al. 2010), our approach is more similar to surrogate variable analysis (SVA) (Leek and Storey 2007) or to the Bayesian factor analysis model (VBQTL) used by Stegle et al. (2010) and Pickrell et al. (2010), in that the unobserved confounders are modeled explicitly. Our analysis differs from these principal component analysis (PCA) or VBQTL models in their control of model complexity. For genome-wide eQTL analysis, SVA chooses significant PCs based on permutation based _P_-value without involving SNP information. Stegle et al. (2010) uses automatic relevance detection (ARD) prior to switching off unused factors, and Pickrell et al. (2010) chooses the number of PCs that gives the largest number of eQTLs. Our approach selects the number of PCs that gives the largest number of local-eQTLs (defined as a SNP within 1 Mb of a gene). We show above (Fig. 2) that for a given _P_-value threshold, local-eQTL are more reliable than distant-eQTL. Consequently local-eQTL should give a more reliable estimate of statistical power and a better indicator of the number of PCs to adjust for unmeasured confounders. Unfortunately, we have not found SVA and VBQTL to be computationally feasible for genome-wide eQTL mapping, because in practice, SVA will ignore SNPs in order to estimate significant surrogate variables and the fast estimates of VBQTL (fVBQTL) required for genome-wide analyses will also ignore SNPs to estimate nonzero factors.
We have also shown the improvement in mapping power that can be gained by the choice of genotype imputation strategy and characterized the source of gains in power. These findings are generally applicable to GWAS as, despite more than 900 studies that have detected disease susceptibility loci at genome-wide significant level (Hindorff et al. 2009), these discoveries have only explained a small portion of familial clustering for many traits (Manolio et al. 2009). Genotype imputation has been widely used in the past 2 yr to aid in fine mapping of candidate regions, to help improve power of GWASs, and to facilitate meta-analysis of results from studies using different genotyping platforms (Marchini et al. 2007; Servin and Stephens 2007; Li et al. 2009, 2010; Gaffney et al. 2012). We have shown here that 1000G imputation (based on 112 CEU [Utah residents {CEPH} with Northern and Western European ancestry] haplotypes available from the 1000 Genomes pilot phase) (1000 Genomes Project Consortium 2010) produces substantial increases in the number of loci that can be mapped, that it improves the fine resolution of genetic effects at individual loci, and that it provides particular improvements in association to SNPs with MAF > 5%. The full scale of the 1000 Genomes Project, which will sequence more than 2000 individuals, should further increase this gain in power (Li et al. 2010).
Methods
Genotyping and gene expression processing
Global gene expression data were measured by two techniques in two independent samples. The first sample (MRCA) contained 405 children of British descent (Dixon et al. 2007). The 405 children are organized into 206 sibships, including 297 sib pairs and 11 half-sib pairs. The families were identified through a proband with childhood asthma, and siblings were included regardless of disease status. Global gene expression in LCLs was measured using Affymetrix HG-U133 Plus 2.0 chips. LCL cultures were harvested at log phase in the first growth after Epstein-Barr virus (EBV) transformation. Robust multi-array averaging (RMA) (Bolstad et al. 2003; Irizarry et al. 2003) was used for background correction and normalization and to compute expression values. All 405 children and their parents were genotyped using the Illumina Sentrix Human-1 Genotyping BeadChip (ILMN100K, including 105,713 autosomal SNPs), and 378 children were also genotyped using Illumina Sentrix HumanHap300 BeadChip (ILMN300K, including 307,981 autosomal SNPs) according to the manufacturers' instructions (Dixon et al. 2007; Moffatt et al. 2007). Before analysis, we excluded 4050 SNPs with a call rate <95%, 96 SNPs with Hardy-Weinberg equilibrium _P_-value <10−6, and 4310 SNPs with MAF < 2% from ILMN100K (a total of 8313 SNPs excluded), and 3921 SNPs with call rate <95%, 34 SNPs with Hardy-Weinberg equilibrium _P_-value <10−6, and 483 SNPs with MAF < 2% from ILMN300K (a total of 4420 SNPs excluded).
The second sample (MRCE) of 950 individuals from 320 families of British descent identified through a proband with atopic dermatitis (eczema) was genotyped using the Illumina Sentrix HumanHap300 Genotyping BeadChip. The genotyped sample contained 487 subjects with atopic dermatitis (and 347 subjects with asthma and 259 subjects with both diseases). Of the 314,552 SNPs with annotation available in the UCSC Genome Browser (hg18, Mar 2006), 8345 with <95% genotyping success rate or deviating from Hardy-Weinberg (_P_ < 10−6) were excluded. We retained 306,207 SNPs and 296,533,535 genotypes (99.1% call rate) for further analyses. There were only 0.204 Mendelian errors per SNP: These genotypes were excluded from subsequent analyses. Expression arrays using Illumina Human 6 BeadChips were available on 550 children (atopic dermatitis probands and their siblings, among them 496 are genotyped). Expression values were estimated using BeadStudio (Illumina), and bead summary data were used for downstream analysis. From the total of 47,293 probes, we excluded 30,806 probes called as “absent” (detection score less than 0.95) in >80% arrays to eliminate noise. We retained 16,487 probes representing 15,576 genes for analysis. The data were then normalized using quantile normalization (Bolstad et al. 2003). We performed parallel analysis on both samples and observed similar results. The research has been approved by the United Kingdom National MREC, and written fully informed consent was obtained from all subjects or their parents.
Genotype imputation
We performed genotype imputation in the MRCA and MRCE samples independently. We used the ILMN300K genotypes to mimic the data that might be used in a typical GWAS and to impute the polymorphic SNPs in the Phase II HapMap. We imputed genotypes for all polymorphic HapMap SNPs by using a hidden Markov model programmed in MaCH (Li et al. 2010). The method combines genotypes from the study samples with the HapMap CEU sample (July 2006 phased haplotype release) and identifies the stretches of haplotype shared between the study samples and the HapMap sample. For each individual, the genotype at the untyped SNP can be summarized by taking (1) the most likely genotype according to the posterior probability of the three possible genotypes and (2) allele dosage, the expected number of copies of the reference allele (a fractional value between 0 and 2). To take into account the uncertainty of imputation, we used allele dosage in downstream analysis.
We also imputed SNPs from 1000 Genomes Project pilot 1 calls obtained from Sanger Institute (August 12, 2009) based on 112 chromosomes from the HapMap CEU samples. This call set of SNPs contains 8,221,074 SNPs, and 6,625,013 of them have MAF > 5% in the imputed sample. In both the HapMap SNP and 1000 Genomes SNP imputation, we excluded SNPs with MACH R-square <0.3 from downstream analysis.
Adjusting nongenetic effects in gene expression
We estimated nongenetic contributions in gene expression measures using PC analysis (Leek and Storey 2007; Stegle et al. 2010). PCs were estimated from the gene expression values, ignoring the family relationship in the data. Top PCs were included in the eQTL regression model as covariates. In order to determine the optimal number of PCs to use, we used genotyped SNPs and, starting with the first PC, included other PCs one at a time until the number of transcripts mapped locally no longer increased. Finally, the top 69 PCs were used in the Affymetrix expression data set (MRCA), and the top 61 PCs were used for the Illumina expression data set (MRCE).
Association analysis
An inverse normal transformation was applied to the results for each transcript to avoid the effect of outliers. Briefly, the procedure involves first transforming all observations to ranks and then converting these ranks to deviates from a standard normal distribution. Narrow-sense heritability for each transcript was estimated by using a variance component model, and a variance component–based score test was used to evaluate the evidence for association at each SNP (Chen and Abecasis 2007). This variance component–based association analysis results in an estimate of the additive genetic effect at each SNP and accounts for the correlation in phenotypes between siblings. Both procedures are implemented in MERLIN (Abecasis et al. 2002; Abecasis and Wigginton 2005).
GO enrichment analysis
The Affymetrix and Illumina expression probes were pooled together and grouped into GO categories using annotation information downloaded from the manufacturer's website. We considered that a probe could be mapped as an eQTL if it represents one gene symbol among the 14,177 genes in Table 1; i.e., the probe can be mapped by either 1000 Genomes imputation SNPs on autosome or by genotyped SNPs on chromosome X. For each GO category, we calculated the percentage of probes mapped by eQTL, denoted as  for the _i_th GO category. The _Z_-score for the _i_th GO category is
 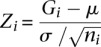 , where
  is the overall percent of probes mapped by eQTL,
  is the standard deviation of the indicator variable whether a probe can be mapped or not, and
  is the number of probes for the _i_th GO category. The _P_-value is computed by comparing the _Z_-score with a standard normal distribution for one side test.
We also computed the permutation based _P_-value by shuffling the correspondence between probes and GO categories. From 10,000 permutations, we counted how many times ( ) the percentage of mapped probes were larger than
  . The permutation based _P_-value is
Data access
The database of our results is available to the public through our website at http://www.hsph.harvard.edu/faculty/liming-liang/software/eqtl/. The gene expression data for the MRCA and MRCE cohorts are available through the European Bioinformatics Institute (EBI) (http://www.ebi.ac.uk) under accession number E-MTAB-1425 for MRCA, and accession number E-MTAB-1428 for MRCE. The genotyping data for the subjects is accessible through the European Genome-Phenome Archive (EGA) (https://www.ebi.ac.uk/ega/), which is also hosted by the European Bioinformatics Institute (accession number EGAS00000000137 for both MRCA and MRCE samples).
Acknowledgments
We much appreciate our communication with Dr. Richard Durbin for the concept of principal component analysis to adjust nongenetic effects in microarray-based gene expression data. The study was funded by the Wellcome Trust, the Medical Research Council, the French Ministry of Higher Education and Research, and the US National Institutes of Health (the National Human Genome Research Institute and the National Heart, Lung and Blood Institute).
Footnotes
[Supplemental material is available for this article.]
References
- The 1000 Genomes Project Consortium 2010. A map of human genome variation from population-scale sequencing. Nature 467: 1061–1073 [DOI] [PMC free article] [PubMed] [Google Scholar]
- Abecasis GR, Wigginton JE 2005. Handling marker-marker linkage disequilibrium: Pedigree analysis with clustered markers. Am J Hum Genet 77: 754–767 [DOI] [PMC free article] [PubMed] [Google Scholar]
- Abecasis GR, Cherny SS, Cookson WO, Cardon LR 2002. Merlin–rapid analysis of dense genetic maps using sparse gene flow trees. Nat Genet 30: 97–101 [DOI] [PubMed] [Google Scholar]
- Akey JM, Biswas S, Leek JT, Storey JD 2007. On the design and analysis of gene expression studies in human populations. Nat Genet 39: 807–808 [DOI] [PubMed] [Google Scholar]
- Benjamini Y, Hochberg Y 1995. Controlling the false discovery rate: A practical and powerful approach to multiple testing. J R Stat Soc Ser B Methodol 57: 289–300 [Google Scholar]
- Bolstad BM, Irizarry RA, Astrand M, Speed TP 2003. A comparison of normalization methods for high density oligonucleotide array data based on variance and bias. Bioinformatics 19: 185–193 [DOI] [PubMed] [Google Scholar]
- Chen WM, Abecasis GR 2007. Family-based association tests for genomewide association scans. Am J Hum Genet 81: 913–926 [DOI] [PMC free article] [PubMed] [Google Scholar]
- Choy E, Yelensky R, Bonakdar S, Plenge RM, Saxena R, De Jager PL, Shaw SY, Wolfish CS, Slavik JM, Cotsapas C, et al. 2008. Genetic analysis of human traits in vitro: Drug response and gene expression in lymphoblastoid cell lines. PLoS Genet 4: e1000287. [DOI] [PMC free article] [PubMed] [Google Scholar]
- Chu X, Pan CM, Zhao SX, Liang J, Gao GQ, Zhang XM, Yuan GY, Li CG, Xue LQ, Shen M, et al. 2011. A genome-wide association study identifies two new risk loci for Graves' disease. Nat Genet 43: 897–901 [DOI] [PubMed] [Google Scholar]
- Cookson W, Liang L, Abecasis G, Moffatt M, Lathrop M 2009. Mapping complex disease traits with global gene expression. Nat Rev Genet 10: 184–194 [DOI] [PMC free article] [PubMed] [Google Scholar]
- Ding J, Gudjonsson JE, Liang L, Stuart PE, Li Y, Chen W, Weichenthal M, Ellinghaus E, Franke A, Cookson W, et al. 2010. Gene expression in skin and lymphoblastoid cells: Refined statistical method reveals extensive overlap in _cis_-eQTL signals. Am J Hum Genet 87: 779–789 [DOI] [PMC free article] [PubMed] [Google Scholar]
- Dixon AL, Liang L, Moffatt MF, Chen W, Heath S, Wong KC, Taylor J, Burnett E, Gut I, Farrall M, et al. 2007. A genome-wide association study of global gene expression. Nat Genet 39: 1202–1207 [DOI] [PubMed] [Google Scholar]
- Emilsson V, Thorleifsson G, Zhang B, Leonardson AS, Zink F, Zhu J, Carlson S, Helgason A, Walters GB, Gunnarsdottir S, et al. 2008. Genetics of gene expression and its effect on disease. Nature 452: 423–428 [DOI] [PubMed] [Google Scholar]
- Frazer KA, Ballinger DG, Cox DR, Hinds DA, Stuve LL, Gibbs RA, Belmont JW, Boudreau A, Hardenbol P, Leal SM, et al. 2007. A second generation human haplotype map of over 3.1 million SNPs. Nature 449: 851–861 [DOI] [PMC free article] [PubMed] [Google Scholar]
- Gaffney D, Veyrieras J-B, Degner J, Pique-Regi R, Pai A, Crawford G, Stephens M, Gilad Y, Pritchard J 2012. Dissecting the regulatory architecture of gene expression QTLs. Genome Biol 13: R7. [DOI] [PMC free article] [PubMed] [Google Scholar]
- Goring HH, Curran JE, Johnson MP, Dyer TD, Charlesworth J, Cole SA, Jowett JB, Abraham LJ, Rainwater DL, Comuzzie AG, et al. 2007. Discovery of expression QTLs using large-scale transcriptional profiling in human lymphocytes. Nat Genet 39: 1208–1216 [DOI] [PubMed] [Google Scholar]
- Heid IM, Jackson AU, Randall JC, Winkler TW, Qi L, Steinthorsdottir V, Thorleifsson G, Zillikens MC, Speliotes EK, Magi R, et al. 2010. Meta-analysis identifies 13 new loci associated with waist-hip ratio and reveals sexual dimorphism in the genetic basis of fat distribution. Nat Genet 42: 949–960 [DOI] [PMC free article] [PubMed] [Google Scholar]
- Hindorff LA, Sethupathy P, Junkins HA, Ramos EM, Mehta JP, Collins FS, Manolio TA 2009. Potential etiologic and functional implications of genome-wide association loci for human diseases and traits. Proc Natl Acad Sci 106: 9362–9367 [DOI] [PMC free article] [PubMed] [Google Scholar]
- Hsu YH, Zillikens MC, Wilson SG, Farber CR, Demissie S, Soranzo N, Bianchi EN, Grundberg E, Liang L, Richards JB, et al. 2010. An integration of genome-wide association study and gene expression profiling to prioritize the discovery of novel susceptibility loci for osteoporosis-related traits. PLoS Genet 6: e1000977. [DOI] [PMC free article] [PubMed] [Google Scholar]
- Irizarry RA, Hobbs B, Collin F, Beazer-Barclay YD, Antonellis KJ, Scherf U, Speed TP 2003. Exploration, normalization, and summaries of high density oligonucleotide array probe level data. Biostatistics 4: 249–264 [DOI] [PubMed] [Google Scholar]
- Kang HM, Ye C, Eskin E 2008. Accurate discovery of expression quantitative trait loci under confounding from spurious and genuine regulatory hotspots. Genetics 180: 1909–1925 [DOI] [PMC free article] [PubMed] [Google Scholar]
- Lango Allen H, Estrada K, Lettre G, Berndt SI, Weedon MN, Rivadeneira F, Willer CJ, Jackson AU, Vedantam S, Raychaudhuri S, et al. 2010. Hundreds of variants clustered in genomic loci and biological pathways affect human height. Nature 467: 832–838 [DOI] [PMC free article] [PubMed] [Google Scholar]
- Leek JT, Storey JD 2007. Capturing heterogeneity in gene expression studies by surrogate variable analysis. PLoS Genet 3: 1724–1735 [DOI] [PMC free article] [PubMed] [Google Scholar]
- Li Y, Willer C, Sanna S, Abecasis G 2009. Genotype imputation. Annu Rev Genomics Hum Genet 10: 387–406 [DOI] [PMC free article] [PubMed] [Google Scholar]
- Li Y, Willer CJ, Ding J, Scheet P, Abecasis GR 2010. MaCH: Using sequence and genotype data to estimate haplotypes and unobserved genotypes. Genet Epidemiol 34: 816–834 [DOI] [PMC free article] [PubMed] [Google Scholar]
- Liang L, Dixon AL, Moffatt MF, Chen W, Heath S, Lathrop GM, Cookson WOC, Abecasis GR 2009. Enhancing the power of eQTL mapping: A catalog of 6000 cis eQTLs in lymphocytes. In ASHG 2009 Annual Meeting, poster 2834/F. American Society of Human Genetics Annual Meeting, Bethesda, MD [Google Scholar]
- Libioulle C, Louis E, Hansoul S, Sandor C, Farnir F, Franchimont D, Vermeire S, Dewit O, de Vos M, Dixon A, et al. 2007. Novel Crohn disease locus identified by genome-wide association maps to a gene desert on 5p13.1 and modulates expression of PTGER4. PLoS Genet 3: e58. [DOI] [PMC free article] [PubMed] [Google Scholar]
- Listgarten J, Kadie C, Schadt EE, Heckerman D 2010. Correction for hidden confounders in the genetic analysis of gene expression. Proc Natl Acad Sci 107: 16465–16470 [DOI] [PMC free article] [PubMed] [Google Scholar]
- Manolio TA, Collins FS, Cox NJ, Goldstein DB, Hindorff LA, Hunter DJ, McCarthy MI, Ramos EM, Cardon LR, Chakravarti A, et al. 2009. Finding the missing heritability of complex diseases. Nature 461: 747–753 [DOI] [PMC free article] [PubMed] [Google Scholar]
- Marchini J, Howie B, Myers S, McVean G, Donnelly P 2007. A new multipoint method for genome-wide association studies by imputation of genotypes. Nat Genet 39: 906–913 [DOI] [PubMed] [Google Scholar]
- Moffatt MF, Kabesch M, Liang L, Dixon AL, Strachan D, Heath S, Depner M, von Berg A, Bufe A, Rietschel E, et al. 2007. Genetic variants regulating ORMDL3 expression contribute to the risk of childhood asthma. Nature 448: 470–473 [DOI] [PubMed] [Google Scholar]
- Morar N, Cookson WO, Harper JI, Moffatt MF 2007. Filaggrin mutations in children with severe atopic dermatitis. J Invest Dermatol 127: 1667–1672 [DOI] [PubMed] [Google Scholar]
- Pedotti P, ‘t Hoen PA, Vreugdenhil E, Schenk GJ, Vossen RH, Ariyurek Y, de Hollander M, Kuiper R, van Ommen GJ, den Dunnen JT, et al. 2008. Can subtle changes in gene expression be consistently detected with different microarray platforms? BMC Genomics 9: 124. [DOI] [PMC free article] [PubMed] [Google Scholar]
- Pickrell JK, Marioni JC, Pai AA, Degner JF, Engelhardt BE, Nkadori E, Veyrieras J-B, Stephens M, Gilad Y, Pritchard JK 2010. Understanding mechanisms underlying human gene expression variation with RNA sequencing. Nature 464: 768–772 [DOI] [PMC free article] [PubMed] [Google Scholar]
- Plagnol V, Smyth DJ, Todd JA, Clayton DG 2009. Statistical independence of the colocalized association signals for type 1 diabetes and RPS26 gene expression on chromosome 12q13. Biostatistics 10: 327–334 [DOI] [PMC free article] [PubMed] [Google Scholar]
- Sanna S, Jackson AU, Nagaraja R, Willer CJ, Chen WM, Bonnycastle LL, Shen H, Timpson N, Lettre G, Usala G, et al. 2008. Common variants in the GDF5-UQCC region are associated with variation in human height. Nat Genet 40: 198–203 [DOI] [PMC free article] [PubMed] [Google Scholar]
- Schadt EE, Molony C, Chudin E, Hao K, Yang X, Lum PY, Kasarskis A, Zhang B, Wang S, Suver C, et al. 2008. Mapping the genetic architecture of gene expression in human liver. PLoS Biol 6: e107. [DOI] [PMC free article] [PubMed] [Google Scholar]
- Scott LJ, Mohlke KL, Bonnycastle LL, Willer CJ, Li Y, Duren WL, Erdos MR, Stringham HM, Chines PS, Jackson AU, et al. 2007. A genome-wide association study of type 2 diabetes in Finns detects multiple susceptibility variants. Science 316: 1341–1345 [DOI] [PMC free article] [PubMed] [Google Scholar]
- Servin B, Stephens M 2007. Imputation-based analysis of association studies: Candidate regions and quantitative traits. PLoS Genet 3: e114. [DOI] [PMC free article] [PubMed] [Google Scholar]
- Speliotes EK, Willer CJ, Berndt SI, Monda KL, Thorleifsson G, Jackson AU, Allen HL, Lindgren CM, Luan J, Magi R, et al. 2010. Association analyses of 249,796 individuals reveal 18 new loci associated with body mass index. Nat Genet 42: 937–948 [DOI] [PMC free article] [PubMed] [Google Scholar]
- Stegle O, Parts L, Durbin R, Winn J 2010. A Bayesian framework to account for complex non-genetic factors in gene expression levels greatly increases power in eQTL studies. PLoS Comput Biol 6: e1000770. [DOI] [PMC free article] [PubMed] [Google Scholar]
- Stranger BE, Forrest MS, Clark AG, Minichiello MJ, Deutsch S, Lyle R, Hunt S, Kahl B, Antonarakis SE, Tavare S, et al. 2005. Genome-wide associations of gene expression variation in humans. PLoS Genet 1: e78. [DOI] [PMC free article] [PubMed] [Google Scholar]
- Stranger BE, Forrest MS, Dunning M, Ingle CE, Beazley C, Thorne N, Redon R, Bird CP, de Grassi A, Lee C, et al. 2007a. Relative impact of nucleotide and copy number variation on gene expression phenotypes. Science 315: 848–853 [DOI] [PMC free article] [PubMed] [Google Scholar]
- Stranger BE, Nica AC, Forrest MS, Dimas A, Bird CP, Beazley C, Ingle CE, Dunning M, Flicek P, Koller D, et al. 2007b. Population genomics of human gene expression. Nat Genet 39: 1217–1224 [DOI] [PMC free article] [PubMed] [Google Scholar]
- Teslovich TM, Musunuru K, Smith AV, Edmondson AC, Stylianou IM, Koseki M, Pirruccello JP, Ripatti S, Chasman DI, Willer CJ, et al. 2010. Biological, clinical and population relevance of 95 loci for blood lipids. Nature 466: 707–713 [DOI] [PMC free article] [PubMed] [Google Scholar]
- Veyrieras JB, Gaffney DJ, Pickrell JK, Gilad Y, Stephens M, Pritchard JK 2012. Exon-specific QTLs skew the inferred distribution of expression QTLs detected using gene expression array data. PLoS ONE 7: e30629. [DOI] [PMC free article] [PubMed] [Google Scholar]
- The Wellcome Trust Case Control Consortium 2007. Genome-wide association study of 14,000 cases of seven common diseases and 3,000 shared controls. Nature 447: 661–678 [DOI] [PMC free article] [PubMed] [Google Scholar]
- Willer CJ, Sanna S, Jackson AU, Scuteri A, Bonnycastle LL, Clarke R, Heath SC, Timpson NJ, Najjar SS, Stringham HM, et al. 2008. Newly identified loci that influence lipid concentrations and risk of coronary artery disease. Nat Genet 40: 161–169 [DOI] [PMC free article] [PubMed] [Google Scholar]
- Wu C, Miao X, Huang L, Che X, Jiang G, Yu D, Yang X, Cao G, Hu Z, Zhou Y, et al. 2012. Genome-wide association study identifies five loci associated with susceptibility to pancreatic cancer in Chinese populations. Nat Genet 44: 62–66 [DOI] [PubMed] [Google Scholar]
- Zhang M, Liang L, Morar N, Dixon AL, Lathrop GM, Ding J, Moffatt MF, Cookson WO, Kraft P, Qureshi AA, et al. 2012. Integrating pathway analysis and genetics of gene expression for genome-wide association study of basal cell carcinoma. Hum Genet 131: 615–623 [DOI] [PMC free article] [PubMed] [Google Scholar]