Activation of Hedgehog signaling by loss of GNAS causes heterotopic ossification (original) (raw)
. Author manuscript; available in PMC: 2014 May 1.
Published in final edited form as: Nat Med. 2013 Sep 29;19(11):1505–1512. doi: 10.1038/nm.3314
Abstract
Bone formation is exquisitely controlled in space and time. Heterotopic ossification (HO), the pathologic formation of extra-skeletal bone, occurs as a common complication of trauma or in genetic disorders and can be disabling and lethal. However, the underlying molecular mechanisms are largely unknown. Here we demonstrate that Gαs restricts bone formation to the skeleton by inhibiting Hedgehog (Hh) signaling in mesenchymal progenitor cells. In progressive osseous heteroplasia (POH), a human disease caused by null mutations in GNAS that encodes Gαs, HH signaling is upregulated in ectopic osteoblasts and progenitor cells. Ectopic Hh signaling is sufficient to induce HO, while Hh signaling inhibition blocks HO in animal models. As our previous work has shown that GNAS gain of function mutations upregulate WNT/β-Catenin signaling in fibrous dysplasia (FD), our findings identify Gαs as a critical regulator of osteoblast differentiation by maintaining a balance between two key signaling pathways: Wnt/β-catenin and Hh. HH signaling inhibitors developed for cancer therapy may be repurposed to treat HO and other diseases caused by GNAS inactivation.
The human skeleton is a complex organ that forms during embryogenesis, grows during childhood, remodels throughout adult life, and regenerates following injury. The spatial boundaries of its temporal existence are exquisitely regulated. Extraskeletal or heterotopic ossification (HO) occurs sporadically or in several rare, but illustrative genetic disorders1. As in normal skeletal morphogenesis, HO can form through either an intramembranous or endochondral process, suggesting that multiple mechanisms are involved 1. The cellular defect lies in aberrant cell-fate determination of mesenchymal progenitor cells in soft tissues, resulting in inappropriate formation of chondrocytes or osteoblasts, or both. HO is illustrated by two rare genetic disorders that are clinically characterized by extensive and progressive extraskeletal bone formation: fibrodysplasia ossificans progressiva (FOP) and progressive osseous heteroplasia (POH). In FOP (OMIM#135100), activating mutations in activin receptor type-1, a bone morphogenetic protein type I receptor, induce HO through endochondral ossification2. Ectopic BMP signaling induces ectopic chondrocyte differentiation prior to bone formation and HO is preceded by ectopic cartilage formation in FOP3. In POH (OMIM#166350) and Albright hereditary osteodystrophy (AHO, OMIM#103580), however, HO occurs predominantly through an intramembranous process4,5 and ectopic osteoblasts differentiate from mesenchymal progenitors independently of chondrocytes in these disorders. Clinically, POH presents during infancy with dermal and subcutaneous ossifications that progress during childhood into skeletal muscle and deep connective tissues (e.g. tendon, ligaments, fascia). Over time, ectopic ossifications lead to ankylosis of affected joints and growth retardation of affected limbs. By contrast, ectopic bone in AHO presents later in life and is largely restricted to cutaneous and subcutaneous tissue6. POH and AHO are caused by inactivating mutations in GNAS4,5,7,8, which encodes Gαs that transduces signals from G protein coupled receptors (GPCRs). However, unlike FOP, the molecular mechanism underlying POH and AHO remains unknown as the connection between Gαs and a signaling pathway that is both necessary and sufficient to control intramembranous ossification has not been determined.
Gαs has emerged as a seminal regulator of mesenchymal progenitors in the skeletal system. Activating mutations in GNAS cause fibrous dysplasia (FD) (OMIM# 174800), in which osteoblast differentiation from mesenchymal progenitors is impaired9. We have found previously that activated Gα proteins are playing important roles during skeletal development and in disease by modulating Wnt/β-catenin signaling strength10. The activating GNAS mutations that cause FD potentiate Wnt/β-catenin signaling, and activation of Wnt/β-catenin signaling in osteoblast progenitors results in an FD-like phenotype10. It is intriguing that POH or AHO does not mirror FD phenotypically or molecularly. Removal of Gnas in mice weakened Wnt/β-catenin signaling and commitment of mesenchymal progenitors to the osteoblast lineage and bone formation10,11. Therefore, weak Wnt/β-catenin signaling due to GNAS inactivation cannot be the cause of POH or AHO.
Gαs is a physiological activator of PKA, an inhibitor of Hh signaling that governs a wide variety of processes during development12-14. However, Hh signaling has not been found to be required for intramembranous ossification as occurs in POH15. In addition, a causal link between Gαs and Hh signaling has never been established in any genetic system16-18. Furthermore, although activated Gαi has been implicated in promoting Hh signaling activity in Drosophila19, it is neither sufficient nor necessary for Hh signaling at least in vertebrates20,21.
Trauma-associated non-hereditary HO is a common complication in adults22, which represents a major unresolved medical challenge. Genetic forms of HO provide the opportunity to identify the molecular mechanisms whereby bone formation is spatially restricted. We therefore investigated which molecular pathway(s) regulated by Gαs induces ectopic osteoblast differentiation in animal models of POH.
Results
Loss of Gnas leads to POH-like skeletal anomalies
Unlike the POH patients, heterozygous loss of Gnas function in Gnas+/− mice only caused osteoma cutis late in life, a cutaneous condition characterized by the presence of bone within the skin, through an unknown mechanism23,24. Because HO in the Gnas+/− mice lacks the two critical POH features of early onset and progressive invasion into deep tissues, we hypothesized that a further reduction of Gnas was required. Therefore, we completely removed Gnas in limb mesenchymal progenitor cells using the Prx1-Cre line. While the Prx1-Cre; Gnasf/+ mice appeared normal, homozygous loss of Gαs in the Prx1-Cre; Gnasf/− or Prx1-Cre; Gnasf/f mice resulted in numerous skeletal anomalies as well as severe and progressive HO resembling the phenotypes of POH (Fig. 1). Gαs was efficiently removed in the limbs, but not in the axial tissue by Prx1-Cre at E14.5 as assayed by mRNA expression, gene deletion in the genome and protein levels (Supplemental Fig. 1a–c). The Prx1-Cre; Gnasf/− and the Prx1-Cre; Gnasf/f mice showed similar phenotypes and were born with soft tissue syndactyly (webbing between the digits), fused joints and progressive HO in soft tissues (Fig. 1). Extra-skeletal mineralization was first detected between embryonic day (E) 16.5 and 17.5, accelerated perinatally, and was extensive by postnatal day 4 (P4). HO was noted in the interdigital regions and between radius and ulna, which resulted in bone fusions by P4 (Fig. 1a,b). Progressive mineralization continued to P20 when most mutant pups died with extensive bone and joint fusions and tendon mineralization (Fig. 1c,d). Similar HO phenotypes were also observed when Gnas was removed using either the Dermo1-Cre or Ap2-Cre, which excises more broadly in mesenchymal tissues outside of the limb (Supplementary Fig. 2a,b). Therefore, Gnas is required in multiple mesenchymal tissues to suppress ectopic mineralization.
Figure 1. Loss of Gnas in limb mesenchyme leads to HO.
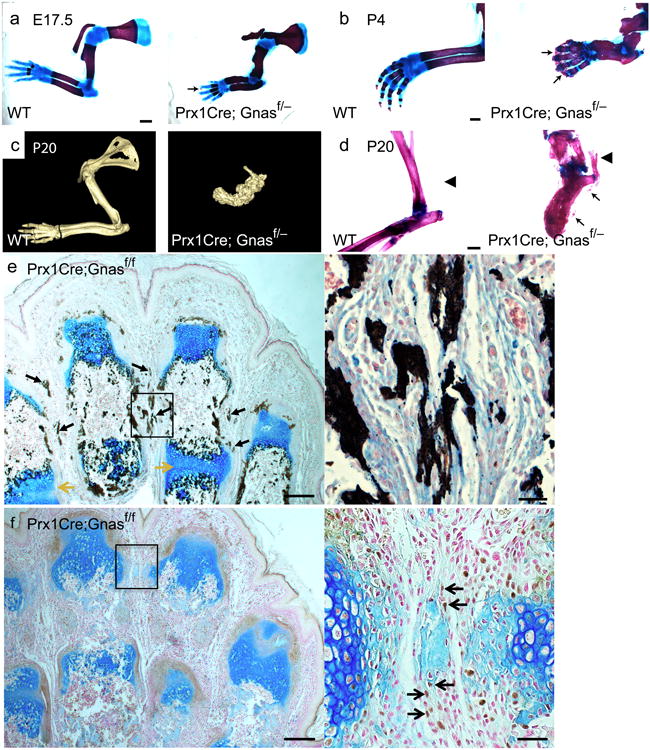
(a, b) Representative alizarin red and alcian blue staining of forelimbs from wild-type littermate control (WT) and Prx1-Cre;Gnasf/− mutant mice at E17.5 (a) and P4 (b). Regions of initiating HO (a) and overt HO (b) are indicated (arrows). Scale bar, 1 mm. (c) Representative computed tomography (CT) scans of forelimbs from P20 WT littermate and Prx1-Cre;Gnasf/− mutant mice. (d) Representative alizarin red and alcian blue staining of hindlimbs from P20 WT littermate and Prx1-Cre;Gnasf/− mutant mice. A region of unmineralized Achilles tendon (left) and of ossified Achilles tendon (right) are indicated (arrowheads). Regions of HO are also indicated (arrows). Scale bar, 0.5 mm. (e, f) Longitudinal sections of the autopod of a P4 Prx1-Cre;Gnasf/f mouse counterstained with alcian blue and Sirius red and processed by Von Kossa staining (e) or by Osx immunohistochemistry (DAB, brown) (f). Regions of ectopic mineralization (black arrows) and chondrocyte hypertrophy and joint fusion (yellow arrows) are indicated (e), as are the brown nuclear staining of Osx-positive cells (black arrows) in interdigital regions of surrounding light-blued stained ossicles (f). The boxed interdigital regions in each panel are shown in higher magnification on the right. Scale bars, 0.2 mm (left), 0.05 mm (right).
To demonstrate that the ectopic mineralization is associated with osteoblast differentiation during ossification, Von Kossa staining and immunohistochemistry of early osteoblast marker Osterix (Osx)25 and mature osteoblast marker osteocalcin (Oc) was performed (Fig. 1e,f and Supplementary Fig. 2c). In P4 mutant limbs, Von Kossa staining confirmed the presence of extensive mineralization in the Prx1-Cre;Gnasf/f mice (Fig. 1e). Osx-positive and Oc-positive cells were detected in the ectopic bone tissues, in both subcutaneous and interdigital regions, where ectopic cartilage was not found (Fig. 1f and Supplementary Fig. 2c). These data demonstrate that loss of Gnas in mesenchymal progenitor cells induce ectopic osteoblast differentiation through a progressive non-cartilaginous intramembranous bone formation process. The Prx1-Cre;Gnasf/− or Prx1-Cre;Gnasf/f mouse is a mouse model of POH that allows us to investigate the molecular and cellular mechanism of Gnas in restricting bone formation.
Loss of Gnas promotes ectopic osteoblast differentiation
Because HO often occurs in adults22, we determined if loss of Gnas in adult subcutaneous mesenchymal tissues could also lead to HO. We injected Cre- or GFP-containing adenoviruses (Ad-Cre or Ad-GFP) subcutaneously into 4 week old Gnasf/f mice (Supplementary Fig. 3). Extensive HO was detected 6 weeks post injection by the presence of ectopic osteoblasts and mineralization in the Ad-Cre, but not the Ad-GFP, injected dermal and subcutaneous regions (Fig. 2a,b), demonstrating that loss of Gnas in adult subcutaneous mesenchymal tissues is sufficient to cause HO similar to that found in POH and AHO. Importantly, as has been found in POH patients, such induced HO was progressively more severe and invaded deep muscular tissues when more time was allowed for HO to develop (Fig. 2c,d)
Figure 2. Loss of Gnas in adult subcutaneous tissue leads to HO.

(a) Representative alizarin red and alcian blue staining of the Gnasf/f mice injected with either Ad-GFP or Ad-Cre virus in the subcutaneous regions (shown in supplemental Fig. 3). N=18. Extensive ectopic bone formation is indicated (arrow). Scale bar, 1 mm. (b) Histological analyses of ectopic bone formation shown in (a) by Osx and Oc immunohistochemistry (arrows) and Von Kossa staining (dark brown). Scale bar, 0.05 mm. (c, d) Representative Von Kossa staining of the ectopic bone (green arrows) in the subcutaneous (c) and the deep muscular regions (d) in the hindlimbs of Gnasf/f mice 12 weeks after Ad-Cre virus injection. H: hair follicle; M: muscle. Scale bars, 0.2 mm (c), 0.05 mm (d).
To test whether HO results from ectopic osteoblast differentiation of mesenchymal progenitors cells, We isolated bone marrow stromal cells (BMSCs) and subcutaneous mesenchymal progenitors (SMP) from the Gnasf/f mice and infected them with Ad-Cre to remove Gnas. Efficient Gnas deletion was observed (Supplemental Fig. 1d–f). Ad-Cre-infected BMSCs (Fig. 3a,b) and SMPs (Supplementary Fig. 4a) showed accelerated osteogenic differentiation as demonstrated by enhanced mineralized matrix formation. This was confirmed by stronger expression of osteoblast differentiation markers such as Osx, Collagen 1a1 (Col1a1), Alkaline Phosphatase (Alpl), Bone Sialoprotein (BSP) and Osteocalcin (Oc) in Ad-Cre-infected BMSCs compared to Ad-GFP-infected BMSCs (Fig. 3c).
Figure 3. Removal of Gnas from mesenchymal progenitor cells upregulates Hh signaling in vitro and in vivo.

(a, b) Representative Von Kossa (a) or alizarin red staining (b) of Ad-Cre or Ad-GFP infected BMSCs from Gnasf/f mice after 10 days in osteogenic medium. (c) qRT-PCR analysis of osteoblast markers at day 7 following adenovirus infection (mean±SD; n=3; * _p_=0.017 for Osx; 0.022 for Col1a1; 0.005 for Alpl; 0.003 for BSP; 0.003 for Oc). (d) Representative in situ hybridization performed on E14.5 forelimbs from the WT littermate control (left) and the Prx1-Cre; Gnasf/− embryos (right). Scale bar, 0.5 mm. (e) qRT-PCR analysis of RNA isolated from E14.5 forelimbs. Expression of Gnas and transcription targets of Hh pathway is shown (mean±SD; n=4; * _p_=2.8×10⁻⁵ for Gnas; 0.012 for Ptch1; 0.036 for Gli1; 0.01 for Hhip). (f) qRT-PCR analysis of Hh pathway target genes in the BMSCs 2-3 days following Ad-Cre or Ad-GFP infection (mean±SD; n=3; * _p_=1.1×10⁻⁴ for Ptch1; 0.001 for Gli1; 0.007 for Hhip).
Gnas is required to inhibit Hh signaling
We have found previously that the activating GNAS mutations causing FD potentiate Wnt/β-catenin signaling10. As low Wnt/β-catenin signaling does not permit osteoblast differentiation26-29, it is unlikely that GNAS inactivation causes ectopic bone formation in POH or AHO by reducing the already low Wnt/β-catenin signaling in soft tissue mesenchymal progenitor cells. To test whether Gαs may also regulate bone formation by regulating Hh signaling, we asked first whether Gαs is a major regulator of PKA that controls Hh signaling activity in vitro and in vivo.
We found that in vitro, loss of Gnas in SMPs and BMSCs leads to weaker Wnt signaling indicated by lower expression of Wnt/β-catenin target genes Axin2, Tcf1 and Lef1; and β-catenin protein levels30 (Supplementary Fig. 4b–d). While cAMP levels and PKA activities (assayed by Creb phosphorylation) were also lower, Hh signaling was higher as indicated by expression of Hh target genes Patched 1(Ptch1), Gli1 and Hh interacting protein (Hhip) (Fig. 4a–c, Supplemental Fig. 4e,f). Blocking cAMP degradation with IBMX31, or activating cAMP production with forskolin32 rescued the effects caused by Gnas removal (Fig. 4d–f). Furthermore, expression of a dominant negative form of PKA (dnPKA) mimicked the effects of Gnas removal (Fig. 4g–j). In vivo, while Wnt/β-catenin target gene expression and β-catenin protein levels were lower (Supplementary Fig. 5a,b), expression of Ptch1, Gli1 and Hhip was higher in the Prx1-Cre;Gnasf/− limb at E14.5, including in the interdigital areas, prior to HO appearance at E17.5 (Fig. 3d–f). Regulation of Hh signaling by Gnas was further confirmed by strong genetic interactions between Gnas and Ptch1 (Supplementary Fig. 5c–g). Ptch1 is an inhibitor of the Hh pathway and the Ptch1+/− mice provide a sensitized genetic background to test other suppressors of Hh signaling33. Ptch1 heterozygosity enhanced the phenotypes caused by Dermo1-Cre or Ap2-Cre induced Gnas removal (Supplementary Fig. 5c–g), indicating that an important in vivo function of Gnas is to suppress Hh signaling. This was further tested in the developing neural tube where the Hh signaling gradient patterns the dorsal-ventral axis34. In the Gnas−/− embryos that died at E9.5, Hh target gene expression was higher, while Wnt target gene expression was lower, and the neural tube was ventralized (Supplementary Fig. 6a–c). These defects phenocopied the mutant embryos due to loss of Hh signaling inhibitors such as PKA, Ptch1 and suppressor of fused (Sufu)13,33,35. In contrast, inhibiting Gαi family members had no effect on limb patterning, skeletal development or Hh signaling activity (Supplementary Fig. 6d,e). Thus, Gαs, but not Gαi, is a required important in vivo regulator of Hh signaling in multiple tissues and at multiple stages of development.
Figure 4. Gαs acts through cAMP and PKA to suppress Hh signaling.

(a) cAMP levels in SMPs from Gnasf/f mice as measured 3 days after adenovirus infection (mean±SD; n=3; *_p_=8.5×10⁻⁵). (b) PKA activity indicated by Phospho-Creb (P-Creb) protein levels in SMPs from Gnasf/f mice 5 days after adenovirus infection. (c) qRT-PCR assay of Hh target gene expression in SMPs from Gnasf/f mice 5 days after adenovirus infection (mean±SD; n=3; *_p_=4.4×10⁻⁴ for Ptch1; 2.4×10⁻⁵ for Gli1; 2.6×10⁻⁶ for Hhip). (d) Alizarin red staining of the SMPs from the Gnasf/f mice 14 days after the indicated treatment. (e) PKA activity indicated by P-Creb levels in SMPs from the Gnasf/f mice 5 days after the indicated treatment. (f) q-RT-PCR assay of Hh target expression in SMPs from the Gnasf/f mice that had been infected with adenovirus for 7 days and treated as indicated for 5 days (mean±SD; n=3; *_p_=2.1×10⁻⁴ for Ptch1; 8.7×10⁻⁴ for Gli1; 2.6×10⁻⁴ for Hhip). (g) PKA activity indicated P-Creb protein levels in WT SMPs infected by dnPKA adenovirus for 5 days. (h) qRT-PCR analysis of Hh target gene expression in WT SMPs infected by dnPKA adenovirus for 5 days (mean±SD; n=3; *_p_=0.001 for Ptch1; 2.1×10⁻⁴ for Gli1; 3.9×10⁻⁴ for Hhip). (i) qRT-PCR analysis of osteoblast differentiation marker expression in WT SMPs infected by dnPKA adenovirus for 5 days (mean±SD; n=3; *_p_=0.003 for Osx; 4.8×10⁻⁴ for Alpl). (j) Alizarin red staining of WT SMP cells infected by dnPKA adenovirus for 14 days.
Hh exerts its biological activity by altering the balance between activator (full length) and repressor (truncated) forms of the Gli family of zinc-finger transcription factors (GliA and GliR)36. Increased GliA and reduced GliR indicate Hh pathway activation37. In vertebrates, GliR function is largely derived from Gli3, while the primary GliA activity is largely from Gli2. Expression of Hh target genes requires GliA function. As PKA regulates both Gli3 processing and Gli2 activation13,38,39, we tested whether Gαs acts through PKA to regulated Hh signaling by performing limb culture experiments. While a PKA inhibitor, H89, upregulated Hh target gene expression in the wild type limb (Supplementary Fig. 7a), forskolin potently suppressed elevated Hh signaling in the mutant limb (Supplementary Fig. 7b). Since Gli2 is required for ventral neural tube patterning40,41, expansion of the ventral-most neural tube marker expression in the Gnas−/− embryos (Supplementary Fig. 6c) indicated that Gli2 is activated by loss of Gnas. In addition, the full length Gli3 (Gli3A) and Gli2 levels were higher and Gli3R levels were lower in the Prx1-Cre;Gnasf/− limb bud relative to littermate controls (Supplementary Fig. 7c,d). Taken together, our data indicate that Gαs suppresses Hh signaling by regulating Gli activation and processing through PKA. Consistent with this, we found that cyclopamine, an inhibitor of the Hh receptor Smoothened (Smo)42, could not suppress Hh target gene expression in the Gnas deficient limb, while Gli inhibitors, arsenic trioxide (ATO)43 or GANT5844 could (Supplementary Fig. 7b). These results indicate that Gαs acts downstream of Smo and upstream of Gli transcription factors to suppress Hh signaling in embryonic limbs.
Active Hh signaling is necessary and sufficient to cause HO
Gli2 mainly forms GliA that transduces Hh signaling45,46. To test whether activated Hh signaling plays an essential role in inducing HO, we removed Gli2 in the Gnas mutant mice. Loss of a single copy of Gli2 led to a partial amelioration of HO in the limbs of the Prx1-Cre;Gnasf/− mice (Fig. 5a). Loss of both copies of Gli2 further ameliorated ectopic mineralization, particularly in the hindlimb, where the mutant phenotypes of HO, syndactyly, and joint fusion were almost completely rescued (Fig. 5a). Amelioration of HO was also achieved by injecting pharmacologic inhibitors of Gli, ATO or GANT58, into female mice pregnant with the Prx1-Cre;Gnasf/− pups (Fig. 5b). While higher and more frequent doses of these compounds are required to inhibit Hh-driven tumor growth in adult mice43,44, similar dosing in pregnant female mice led to spontaneous abortion, precluding their use in this model. Inhibition of osteoblast differentiation by GANT-58 was also observed in vitro in the _Gnas-_deficient BMSCs (Fig. 5c and Supplementary Fig. 7e). Taken together, these data demonstrate that Hh signaling activation is required for osteoblast differentiation driven by loss of Gnas function in mesenchymal progenitors.
Figure 5. Reducing Hh signaling inhibits HO in vivo and in vitro.

(a, b) Representative alizarin red and alcian blue staining of the limbs from E18.5 embryos with the indicated genotypes. Less severe HO, particularly in the hindlimb, is indicated (arrow) . In (b), the E18.5 embryos were from the pregnant female mice that had been injected with vehicles or the indicated Hh antagonists three times (E13.5, E15.5 and E17.5). Scale bars, 0.5 mm. (c) Alizarin red staining of the differentiating BMSCs from the Gnasf/f mice with the indicated treatment.
To test whether HH signaling is indeed upregulated in POH patients, we performed GLI1 and GLI2 immunohistochemistry on HO samples from two POH individuals7. GLI1 and GLI2 expression was present in hair follicles where Hh signaling is active under normal conditions (Supplementary Fig. 7f,g). In the POH samples, GLI1 and GLI2 expression was also detected in cells within the ectopic bone tissue (Fig. 6c, Supplementary Fig. 7g). The most intense detection of GLI1 and GLI2 was along the surface of the ectopic bone, suggesting that Hh signaling is most highly upregulated at the leading edge of new bone formation that contains bone forming progenitor cells. This is consistent with our in vitro data showing that Hh signaling is highly upregulated in progenitor cells just prior to osteoblastic differentiation (Fig. 3f). In the limb of the Prx1Cre; Gnasf/f mouse at P4, loss of Gnas led to upregulated Gli1 protein in most cells compared to the wild type control (Supplementary Fig. 8a). We also found that areas of adipose tissue appeared to contain occasional GLI1 positive cells (Fig. 6c), suggesting these cells are potential osteoprogenitor cells within the subcutaneous fat tissue. These findings support that upregulated HH signaling also drives ectopic bone formation in the human disease.
Figure 6. Hh signaling is activated in ectopic bone from POH individuals and activation of Hh signaling is sufficient to cause HO.

(a-c) GLI1 immunohistochemical staining of human samples. (a, b) Samples from a normal human subject. Scale Bars: 1 μm. (c) GLI1 expression in ectopic osteoblasts of the POH samples (arrows). Scale Bar: 1 μm. (d) Representative alizarin red and alcian blue staining of the limbs from the R26SmoM2 mice injected with the Ad-GFP (left limb) or the Ad-Cre (right limb). Ectopic bone formation is indicated (arrows). N=8. (e) Alizarin red staining of the cultured SMP cells. (f) Schematic illustration showing the fundamental roles of Gαs in bone formation and the mechanisms of GNAS mutations in bone disease (see text for more details). L: low, H: high, GOF: gain of function, LOF: loss of function.
To test whether Hh signaling activation alone is sufficient to cause HO, Ad-Cre was injected subcutaneously into the limbs of the adult R26SmoM2 mice47, in which an activated form of Smo (SmoM2) is expressed following Cre-mediated recombination. Eight weeks after Ad-Cre injection, but not Ad-GFP injection, HO was readily detected (Fig. 6d). BMSCs and SMPs from the R26SmoM2 mice also showed upregulated Hh signaling and accelerated osteoblast differentiation after Ad-Cre infection (Fig. 6e and Supplementary Fig. 8b–d). These results demonstrate that Hh signaling activation is both necessary and sufficient to induce HO, and that Hh signaling must be actively suppressed by Gαs to ensure spatial restriction of bone formation to the normal skeleton.
Discussion
Here we show that loss of Gnas causes HO by activating Hh signaling. Further, we provide evidence that previously identified Hh signaling inhibitors, particularly Gli inhibitors that have been developed for cancer therapy, may be repurposed to treat HO and possibly other diseases caused by reduction of Gαs activity. This work together with our previous study10 provide deep mechanistic insights into how gain of function and loss of function mutations of the same GNAS gene cause completely different diseases (FD vs. POH) by identifying distinct downstream pathways (Wnt/β-catenin and Hh) that primarily mediate the effects of activated or inactivated Gαs signaling respectively. As both high and low Gαs signaling causes bone diseases, our work highlights the necessity and significance of tightly regulating Gαs activities by GPCRs both spatially and temporally. Due to the large number of GPCRs and their ligands, it would not be surprising that mutations disrupting a GPCR or the production of one class of GPCR ligands result in less pronounced alteration in Hh or Wnt signaling and therefore less severe phenotypes. Consistent with this, it has been found that loss of a GPCR, Gpr161 that has no known ligand, causes milder developmental defects in mouse embryos48 compared to the Gnas−/− mutant shown here.
As a critical regulator of osteoblast differentiation from mesenchymal progenitor cells, Gαs exerts its function by modulating the signaling activities of Wnt/β-catenin and Hh, both of which are key signaling pathways that play fundamental roles in skeletal development and disease49. Activation or inactivation of GNAS causes upregulation of only one of the two pathways, indicating that one function of Gαs in mesenchymal progenitor cells is to maintain a critical balance between Wnt/β-catenin and Hh signaling, which is required for osteogenesis and its spatial regulation. Only appropriate levels of Hh and Wnt signaling determined by a specific range of Gαs activities (shown by the box in Fig.6f) result in normal bone formation. Outside the boxed range, extreme Wnt or Hh signaling either inhibits bone formation in the skeleton or causes ectopic bone formation in soft tissues. Therefore, it is likely that distinct mutations in Gnas cause corresponding bone diseases such as FD and POH by altering the balance to enhance either Wnt/β-catenin or Hh signaling, respectively (Fig. 6f).
Genetic studies showed that Wnt signaling acts permissively for osteoblast differentiation. Osteoblast differentiation is favored when Wnt signaling is above a threshold level26-28,50,51. Therefore, Wnt signaling alteration itself primarily affects bone formation in the normotopic skeleton and cannot cause ectopic bone formation unless an inducer(s) of osteoblast differentiation is present. Here we identify that one such inducer is Hh signaling. In the POH mouse model, lower Wnt signaling was not sufficient to inhibit ectopic bone formation promoted by ectopic Hh signaling. It is important to note that over-activated Wnt signaling also inhibits osteoblast differentiation10,52-56. This together with lower HH signaling explains the phenotype of FD. As both Wnt and Hh signaling pathways have potent regulatory activities, certain reduction of their normal signaling levels can be tolerated, whereas ectopic signaling causes deleterious effects. Therefore, the disease phenotypes at the tissue and cellular levels are primarily determined by the pathway that is activated. As Wnt and Hh signaling is both required to regulate a diverse array of developmental and physiological processes, our finding that their balance is regulated by Gnas provides an important conceptual framework to understand the molecular and cellular mechanisms of skeletal and possibly other diseases.
Our studies show that ectopic bone in soft tissues forms by differentiation of osteoblast cells from mesenchymal progenitor cells. Even when Gnas is removed uniformly in early limb buds, as in the Prx1Cre; Gnasf/− mouse, HO that occurs later still progresses from the distal limb (Fig. 1), which contains more progenitor cells than the proximal limb57,58. Hh ligand-mediated Hh signaling is only required for endochondral bone formation15, raising the possibility that intramembranous bone formation in the skull may be promoted by ligand-independent activation of Hh signaling. Our finding that Hh signaling activation due to loss of Gαs signaling is both necessary and sufficient for HO through the intramembranous mechanism suggests that this signaling crosstalk may also be important in physiological bone formation and homeostasis. For instance, defective GPCR-Gαs signaling may cause impaired development of cranial and clavicle bones. Furthermore, it would be interesting to determine whether the appearance of extra-skeletal dermal bone, which is physiologically important in some species, for example, the armadillo, is caused by alteration in the GPCR-Gαs-Hh signaling axis during evolution.
The mosaic nature of HO in POH and AHO suggests that the mild elevation of basal Hh signaling in these patients provides a sensitized tissue background for ectopic osteoblast differentiation that occurs when additional Hh signaling or other osteogenic factors are provided by a local microenvironment. For instance, elevated Hh signaling in the hair follicle may trigger HO in the subcutaneous region observed in POH and AHO patients. Non-hereditary forms of HO often contain a mixture of both cartilage and bone. It is possible that the underlying molecular mechanisms of non-hereditary forms of HO are a combination of those underlying POH and FOP. In fact, the developmental program of ectopic chondrogenesis orchestrated by dysregulated BMP signaling also upregulates Hh signaling at ectopic sites59. Therefore, a combination of Hh inhibitors and the nuclear retinoic acid receptor-γ agonists60, which block chondrogenesis, may be a promising strategy to treat POH as well as common, non-hereditary forms of HO.
Online Methods
Mice
All mouse experiments were approved by the NIH IACUC. All mice have been previously described in the literature: Gαsf/f61, Prx1-Cre62, Dermo1-Cre63, Ap2-Cre64, Ptch1f/f65, Gli2−/−66, Gli2f/f67, Smof/f68, R26SmoM269, Rosa26-PTX70 and Gnaz−/−71. All animal experiments were performed under a protocol approved by the NHGRI Animal Care and Use Committee.
Human samples
Collection of POH patient samples was approved by the Institutional Review Board of the University of Pennsylvania. Informed consent was obtained from all subjects.
Skeletal preparation (alizarin red-alcian blue staining)
Embryos were skinned and placed in 100% EtOH overnight. Embryos were then placed in staining solution for 2 days and processed according to (50 mL staining solution= 2.5 mL 0.3% alcian blue, 2.5 mL 0.1% alizarin red, 2.5 mL 100% glacial acetic acid, 42.5 mL 70% EtOH). Rinsed embryos with water then placed in 1% KOH until destained. Placed embryos in 80% glycerol for storage.
Von Kossa and alizarin red staining
Tissue sections were deparaffinized and hydrated in distilled H2O. We added 5% silver hydrate to slides and then placed them under a 60-watt lamp for 1 hour. Slides were rinsed three times in distilled water. 5% sodium thiosulfate was added to slides for 5 minutes. We rinsed slides three times in distilled water. We counterstained slides with nuclear fast red for 5 minutes. We then rinsed slides three times in distilled water. Slides were dehydrated and cleared in xylene before mounting with Permont. For Von Kossa staining of cell cultures, We fixed the cells in 2.5% gluteraldehyde in PBS for 2 hours, washed them in distilled water, and then stained them with 5% silver nitrate under a 60 watt lamp for 1 hr. We washed the stained cells in distilled water 3 times, then in 5% sodium thiosulfate for 5 min, and then rinsed them in water. For alizarin red staining of cell cultures, We rinsed cells with PBS and fixed them with 4% PFA for one hour at room temperature. After washing them with water, we stained them with freshly made alizarin red staining solution (1% alizarin red in 2% Ethanol) for 5 minutes before we washed them five times with distilled water.
Immunohistochemistry
We deparaffinized and then hydrated tissue sections. We then placed slides into boiling 10mM citrate pH6 for 15 minutes and room temperature for 15 minutes. We placed slides in 3%H2O2/MeOH for 15 minutes, equilibrated slides in phosphate buffered saline with 0.1% Tween-20 (PBS-T), blocked them for 1 hour with 5% normal goal serum in PBS-T and applied rabbit anti-Osx antibody (Abcam; ab22552) at 1:1000. We washed slides and detected signal using the anti-rabbit ABC elite kit (Vector labs; PK-6101) and DAB tablets (Sigma-Aldrich; D4293). We counterstained slides with nuclear fast red and alcian blue then dehydrated, cleared them with xylene and mounted them with Permont. For GLI1 immunohistochemistry, following incubation with 1:100 GLI1 antibody (Santa Cruz Biotechnology) overnight at 4°C, sections were incubated with universal secondary antibody (Broad Spectrum, Zymed Laboratories) for 25 min, 50 °C , then blocked (Background Buster; American MasterTech) for 30 min and hydrogen peroxide blocking reagent (Lab Vision Corp.) for 15 min, both at room temperature. Sections were incubated with streptavidin-HRP (Open Biosystem) for 30 min at 50 °C and color development used DAB (_SuperPicTure_™ Polymer, Invitrogen) for 5 min at 37°C. Adult tissue sections for specific protein immunohistochemistry were counterstained with Mastertech Harris Hematoxylin and Nuclear Fast Red was used as a counterstain for Von Kossa staining. Neonatal tissue sections were counterstained with Alcian blue, followed by Sirius red.
qRT-PCR
We isolated the total RNA first with Trizol (Invitrogen) and then with the RNeasy Kit (Qiagen) with on column DNAse digestion. We generated 1st strand cDNA using the iScript cDNA Synthesis Kit (BioRad). qPCR was performed using an ABI7900 light cycler and 40 cycles of 95°C 15 seconds and 60°C for 60 seconds. PCR product accumulation was detected using Sybr green (Invitrogen; Platimun SYBR Green qPCR SuperMix-UDG). Primers used for amplification are Actin: Forward 5′-CAC AGC TTC TTT GCA GCT CCT T-3′, Reverse 5′-CGT CAT CCA TGG CGA ACT G-3′; Tubulin: Forward 5′- CAA CGT CAA GAC GGC CGT GTG-3′, Reverse 5′-GAC AGA GGC AAA CTG AGC ACC-3′; Gαs: Forward 5′-GCA GAA GGA CAA GCA GGT CT-3′, Reverse 5′-CCC TCT CCG TTA AAC CCA TT-3′; Ptch1: Forward 5′-CTC TGG AGC AGA TTT CCA AGG-3′, Reverse 5′-TGC CGC AGT TCT TTT GAA TG-3′; Gli1: Forward 5′-GAA AGT CCT ATT CAC GCC TTG A-3′, Reverse 5′-CAA CCT TCT TGC TCA CAC ATG TAA G-3′; Hhip: Forward 5′-GGG AAA AAC AGG TCA TCA GC-3′, Reverse 5′-ATC CAC CAA CCA AAG GGC-3′. Osx: Forward 5′- CCC ACT GGC TCC TCG GTT CTC TCC -3′, Reverse 5′- GCTBGAA AGG TCA GCG TAT GGC TTC -3′; Col1a1: Forward 5′- CAC CCT CAA GAG CCT GAG TC -3′, Reverse 5′- GTT CGG GCT GAT GTA CCA GT -3′; Alk Phos: Forward 5′- CAC GCG ATG CAA CAC CAC TCA GG -3′, Reverse 5′- GCA TGT CCC CGG GCT CAA AGA -3′; BSP: Forward 5′- TAC CGG CCA CGC TAC TTT CTT TAT -3′, Reverse 5′- GAC CGC CAG CTC GTT TTC ATC C -3′; Oc: Forward 5′- ACC CTG GCT GCG CTC TGT CTC T -3′, Reverse 5′- GAT GCG TTT GTA GGC GGT CTT CA -3′, Lef: Forward 5′-TCT CAA GGA CAG CAA AGC TC -3′, Reverse 5′- CAC TTG AGG CTT CAT GCA CAT -3′, Tcf: Forward 5′- ACA TGA AGG AGA TGA GAG CCA -3′, Reverse 5′- CTT CTT CTT TCC GTA GTT ATC -3′, Axin2: Forward 5′- ATG TGT GGA TAC GCT GGA CTT -3′, Reverse 5′- TTC TTG ATG CCA TCT CGT ATG -3′. Relative expression was quantified using the 2−ΔΔCt method 72.
Gnas genotyping PCR
Primers used for PCR amplification of the conditional or mutant alleles were 5′- GAGAGCGAGAGGAAGACAGC -3′, 5′-TCGGGCCTCTGGCGGAGCTT -3′, 5′- AGCCCTACTCTGTCGCAGTC -3′. 100ng genomic DNA was PCR amplified (95°C – 3min, 35 cycles (95°C – 30sec, 62°C – 45sec, 72°C – 45sec), 72°C – 8min, 15°C - forever) and we analyzed the PCR product on a 2% agarose gel with Ethidium Bromide to examine the presence of ∼400bp conditional allele band or ∼250bp mutant allele band.
In Situ Hybridization and X-gal staining
Whole mount in situ hybridization and X-gal staining were performed using standard techniques 73.
Immunoblotting
Immunoblotting was performed using standard techniques. The rabbit anti-Gli3 antibody kindly provided by Dr. Susan Mackem (NIH/NCI) and the rat anti-α-tubulin was purchased from Sigma. The antibodies for Gαs (#sc-55546, Santa Cruz Biotechnology), Creb (#3360R, BioVision Incorporated), Phospho-Creb (#06-519, Millipore), Gli2 (#AF3635, R&D Systems), Gli1 (#NB600-600, Novus Biologicals), Osx (#ab22552, abcam), Oc (#LS-C42094, , LifeSpan Biosciences), β-catenin (#9562, Cell Signaling Technology), α/β-Tubulin (#2148, Cell Signaling Technology) were used according to manufacturer's recommendations.
BMSC and SMP isolation and culture in osteogenic media
We isolated BMSCs by flushing the bone marrow cavity of 6 week old mice and plating cells in Alpha-MEM, 20% FBS, 100 U/mL penicillin, 100 μg/mL streptomycin, 2 mM glutamine. Prior to reaching confluence cells were infected with either Ad-Cre or Ad-GFP. Upon reaching confluence, cells were switch to osteogenic media [DMEM, 10% lot-selected FBS, 100 U/mL penicillin, 100 μg/mL streptomycin, 2 mM glutamine, 10-4 M L-ascorbic acid 2-phosphate and 10 mM β-glycerol phosphate] and cultured for the indicated time points. Subcutaneous skin tissue containing adipose deposits was removed under sterile conditions, and washed in PBS supplemented with 100 U/mL penicillin and 100 μg/mL streptomycin on ice. The tissue was then minced, and digested with 1 mg/ml collagenase type I and 0.5%Trypsin in 0.1% BSA for 2 h at 37 °C . The digested tissue was centrifuged at 650 g for 10 min and the pellet was carefully collected after aspirating off the floating fat depots. After a second centrifugation at 650 g for 10 min, the cellular pellet was filtered through a 100-μm mesh filter to remove debris. The filtrate was cultured in 100-mm cell culture dishes under the same condition as the BMSCs.
Limb culture
We performed limb culture as described 74. BGJB culture media was supplemented with 0.2% bovine serum albumin (Sigma Aldrich) and Forskolin (Sigma Aldrich), IBMX (Sigma Aldrich), Cyclopamine (BIOMOL), Arsenic trioxide (ATO) (Sigma Aldrich) or GANT-58 (Tocris) at the indicated concentrations. Media was changed every alternate day.
Neural tube analysis
Analysis of neural tube patterning along the dorsal-ventral axis was done as described 75.
cAMP measurement
To measure the cAMP levels in cells, We incubated the the cells in the presence of cAMP stabilizer, IBMX, for 30 minutes and then trypsinized and flash frozen the cells till cAMP measurement. We used the ACTOne cAMP fluorimetric ELISA kit (#CB-80500-503, Codex BioSolutions Incorporated) per manufacturer's recommendations.
ATO, GANT-58 treatments
We placed 50 mg of ATO in the bottom of a 50 mL conical tube and dissolved it with 1 mL of 1 N NaOH. 48 mL of PBS was then added to the tube and 0.82 mL of 1.2 N HCl was added to adjust the pH to 7.2. We dissolved GANT-58 in 20% DMSO and then diluted it with corn oil before injection. We weighed and then injected the pregnant mice with care to avoid injection into uterus.
GANT-58 cell treatments
BMSCs were grown to confluence and placed in osteogenic media for 10 days with or without GANT-58 at the indicated concentrations.
Adenovirus injection and treatment
2 μl of the Cre recombinase or GFP adenovirus from SAIC, NCI, Frederick (∼1010 pfu/ml) were diluted in 100 μl PBS solution and injected into the subcutaneous region of the limbs of 4 weeks old mice. 6 weeks after injection, the mice were euthanized and the skins of the limbs were removed. Ectopic bone formation was analyzed by skeletal preparation and histological procedures. For the R26SmoM2 mice, adenovirus injection was performed at 4 weeks of age and analysis was performed at 8 weeks of age.
Adenovirus cell culture treatment
The Cre recombinase or GFP adenovirus obtained from SAIC, NCI, Frederick (∼1010 pfu/ml) was diluted 1:2000 to infect cells. The dnPKA adenovirus was a kind gift from Chen-Ming Fan (∼1010 pfu/ml) and diluted to 1:300 to infect cells.
Statistics
Statistical significance was assessed using 2-tailed Student's t test for comparisons between 2 groups or by multivariate ANOVA analysis for multi-group comparisons. A P value less than 0.05 were considered significant. Data are presented as mean ± SD unless otherwise indicated.
Supplementary Material
1
2
Acknowledgments
We thank the entire Yang lab for stimulating discussions. We thank Ms. Julia Fekecs and Dr. Philipp Andre for helping with the data illustration. The work in the Yang and Weinstein labs was supported by the intramural research programs of NHGRI and NIDDK at the US National Institutes of Health, respectively. We thank Robert Caron for his work on the POH lesion histological analyses. The work in the Kaplan and Shore lab was supported by the Progressive Osseous Heteroplasia Association (POHA), the University of Pennsylvania Center for Research in FOP and Related Disorders, the Penn Center for Musculoskeletal Disorders (NIH/NIAMS P30-AR050950), The Isaac & Rose Nassau Professorship of Orthopaedic Molecular Medicine, and NIH/NIAMS (R01-AR046831 and R01-AR41916).
Footnotes
Author Contributions: J.B.Regard, D.Malhotra. and Y.Yang designed the experiments and analyzed the data. J.B.Regard, D.Malhotra, F.S.Kaplan, E.M.Shore and Y.Yang wrote the manuscript. J.B.Regard, D.Malhotra, J. Gvozdenovic-Jeremic, M.Josey, J.Lu carried out the actual experiments. F.S.Kaplan saw the POH patients. F.S.Kaplan and E.M.Shore provided the POH samples and carried out the GLI immunohistochemistry on the human samples. M.Chen and L.S.Weinstein generated and provided the Gnasf/f mice.
References
- 1.Shore EM, Kaplan FS. Inherited human diseases of heterotopic bone formation. Nat Rev Rheumatol. 2010;6:518–527. doi: 10.1038/nrrheum.2010.122. [DOI] [PMC free article] [PubMed] [Google Scholar]
- 2.Shore EM, et al. A recurrent mutation in the BMP type I receptor ACVR1 causes inherited and sporadic fibrodysplasia ossificans progressiva. Nat Genet. 2006;38:525–527. doi: 10.1038/ng1783. [DOI] [PubMed] [Google Scholar]
- 3.Wozney JM, et al. Novel regulators of bone formation: molecular clones and activities. Science. 1988;242:1528–1534. doi: 10.1126/science.3201241. [DOI] [PubMed] [Google Scholar]
- 4.Kaplan FS, Hahn GV, Zasloff MA. Heterotopic Ossification: Two Rare Forms and What They Can Teach Us. J Am Acad Orthop Surg. 1994;2:288–296. doi: 10.5435/00124635-199409000-00007. [DOI] [PubMed] [Google Scholar]
- 5.Eddy MC, et al. Deficiency of the alpha-subunit of the stimulatory G protein and severe extraskeletal ossification. J Bone Miner Res. 2000;15:2074–2083. doi: 10.1359/jbmr.2000.15.11.2074. [DOI] [PubMed] [Google Scholar]
- 6.Trueb RM, Panizzon RG, Burg G. Cutaneous ossification in Albright's hereditary osteodystrophy. Dermatology. 1993;186:205–209. doi: 10.1159/000247347. [DOI] [PubMed] [Google Scholar]
- 7.Shore EM, et al. Paternally inherited inactivating mutations of the GNAS1 gene in progressive osseous heteroplasia. N Engl J Med. 2002;346:99–106. doi: 10.1056/NEJMoa011262. [DOI] [PubMed] [Google Scholar]
- 8.Plagge A, Kelsey G, Germain-Lee EL. Physiological functions of the imprinted Gnas locus and its protein variants Galpha(s) and XLalpha(s) in human and mouse. J Endocrinol. 2008;196:193–214. doi: 10.1677/JOE-07-0544. [DOI] [PubMed] [Google Scholar]
- 9.Riminucci M, Robey PG, Saggio I, Bianco P. Skeletal progenitors and the GNAS gene: fibrous dysplasia of bone read through stem cells. J Mol Endocrinol. 2010;45:355–364. doi: 10.1677/JME-10-0097. [DOI] [PMC free article] [PubMed] [Google Scholar]
- 10.Regard JB, et al. Wnt/beta-catenin signaling is differentially regulated by Galpha proteins and contributes to fibrous dysplasia. Proc Natl Acad Sci U S A. 2011;108:20101–20106. doi: 10.1073/pnas.1114656108. [DOI] [PMC free article] [PubMed] [Google Scholar]
- 11.Wu JY, et al. Gsalpha enhances commitment of mesenchymal progenitors to the osteoblast lineage but restrains osteoblast differentiation in mice. J Clin Invest. 2011;121:3492–3504. doi: 10.1172/JCI46406. [DOI] [PMC free article] [PubMed] [Google Scholar]
- 12.Jiang J, Struhl G. Protein kinase A and hedgehog signaling in Drosophila limb development. Cell. 80:563–572. doi: 10.1016/0092-8674(95)90510-3. [DOI] [PubMed] [Google Scholar]
- 13.Tuson M, He M, Anderson KV. Protein kinase A acts at the basal body of the primary cilium to prevent Gli2 activation and ventralization of the mouse neural tube. Development. 138:4921–4930. doi: 10.1242/dev.070805. [DOI] [PMC free article] [PubMed] [Google Scholar]
- 14.Jiang J, Hui CC. Hedgehog signaling in development and cancer. Dev Cell. 15:801–812. doi: 10.1016/j.devcel.2008.11.010. [DOI] [PMC free article] [PubMed] [Google Scholar]
- 15.St-Jacques B, Hammerschmidt M, McMahon AP. Indian hedgehog signaling regulates proliferation and differentiation of chondrocytes and is essential for bone formation. Genes Dev. 1999;13:2072–2086. doi: 10.1101/gad.13.16.2072. [DOI] [PMC free article] [PubMed] [Google Scholar]
- 16.Bastepe M, et al. Stimulatory G protein directly regulates hypertrophic differentiation of growth plate cartilage in vivo. Proc Natl Acad Sci U S A. 2004;101:14794–14799. doi: 10.1073/pnas.0405091101. [DOI] [PMC free article] [PubMed] [Google Scholar]
- 17.Sakamoto A, Chen M, Kobayashi T, Kronenberg HM, Weinstein LS. Chondrocyte-specific knockout of the G protein G(s)alpha leads to epiphyseal and growth plate abnormalities and ectopic chondrocyte formation. J Bone Miner Res. 2005;20:663–671. doi: 10.1359/JBMR.041210. [DOI] [PubMed] [Google Scholar]
- 18.Sakamoto H, et al. A kinetic study of the mechanism of conversion of alpha-hydroxyheme to verdoheme while bound to heme oxygenase. J Biol Chem. 2005;338:578–583. doi: 10.1016/j.bbrc.2005.08.176. [DOI] [PubMed] [Google Scholar]
- 19.Ogden SK, et al. G protein Galphai functions immediately downstream of Smoothened in Hedgehog signalling. Nature. 2008;456:967–970. doi: 10.1038/nature07459. [DOI] [PMC free article] [PubMed] [Google Scholar]
- 20.Riobo NA, Saucy B, Dilizio C, Manning DR. Activation of heterotrimeric G proteins by Smoothened. Proc Natl Acad Sci U S A. 103:12607–12612. doi: 10.1073/pnas.0600880103. [DOI] [PMC free article] [PubMed] [Google Scholar]
- 21.Low WC, et al. The decoupling of Smoothened from Galphai proteins has little effect on Gli3 protein processing and Hedgehog-regulated chick neural tube patterning. Dev Biol. 2008;321:188–196. doi: 10.1016/j.ydbio.2008.06.014. [DOI] [PMC free article] [PubMed] [Google Scholar]
- 22.Vanden Bossche L, Vanderstraeten G. Heterotopic ossification: a review. J Rehabil Med. 2005;37:129–136. doi: 10.1080/16501970510027628. [DOI] [PubMed] [Google Scholar]
- 23.Pignolo RJ, et al. Heterozygous inactivation of Gnas in adipose-derived mesenchymal progenitor cells enhances osteoblast differentiation and promotes heterotopic ossification. J Bone Miner Res. 2011;26:2647–2655. doi: 10.1002/jbmr.481. [DOI] [PMC free article] [PubMed] [Google Scholar]
- 24.Huso DL, et al. Heterotopic ossifications in a mouse model of albright hereditary osteodystrophy. PloS one. 2011;6:e21755. doi: 10.1371/journal.pone.0021755. [DOI] [PMC free article] [PubMed] [Google Scholar]
- 25.Nakashima K, et al. The novel zinc finger-containing transcription factor osterix is required for osteoblast differentiation and bone formation. Cell. 2002;108:17–29. doi: 10.1016/s0092-8674(01)00622-5. [DOI] [PubMed] [Google Scholar]
- 26.Hill TP, Spater D, Taketo MM, Birchmeier W, Hartmann C. Canonical Wnt/beta-catenin signaling prevents osteoblasts from differentiating into chondrocytes. Dev Cell. 2005;8:727–738. doi: 10.1016/j.devcel.2005.02.013. [DOI] [PubMed] [Google Scholar]
- 27.Day TF, Guo X, Garrett-Beal L, Yang Y. Wnt/beta-catenin signaling in mesenchymal progenitors controls osteoblast and chondrocyte differentiation during vertebrate skeletogenesis. Dev Cell. 2005;8:739–750. doi: 10.1016/j.devcel.2005.03.016. [DOI] [PubMed] [Google Scholar]
- 28.Hu H, et al. Sequential roles of Hedgehog and Wnt signaling in osteoblast development. Development. 2005;132:49–60. doi: 10.1242/dev.01564. [DOI] [PubMed] [Google Scholar]
- 29.Holmen SL, et al. Essential role of beta-catenin in postnatal bone acquisition. J Biol Chem. 2005;280:21162–21168. doi: 10.1074/jbc.M501900200. [DOI] [PubMed] [Google Scholar]
- 30.Logan CY, Nusse R. The wnt signaling pathway in development and disease. Annu Rev Cell Dev Biol. 2004;20:781–810. doi: 10.1146/annurev.cellbio.20.010403.113126. [DOI] [PubMed] [Google Scholar]
- 31.Keely SL, Jr, Corbin JD, Park CR. On the question of translocation of heart cAMP-dependent protein kinase. Proc Natl Acad Sci U S A. 1975;72:1501–1504. doi: 10.1073/pnas.72.4.1501. [DOI] [PMC free article] [PubMed] [Google Scholar]
- 32.Seamon K, Daly JW. Activation of adenylate cyclase by the diterpene forskolin does not require the guanine nucleotide regulatory protein. J Biol Chem. 1981;256:9799–9801. [PubMed] [Google Scholar]
- 33.Goodrich LV, Milenkovic L, Higgins KM, Scott MP. Altered neural cell fates and medulloblastoma in mouse patched mutants. Science. 1997;277:1109–1113. doi: 10.1126/science.277.5329.1109. [DOI] [PubMed] [Google Scholar]
- 34.Ribes V, Briscoe J. Establishing and interpreting graded Sonic Hedgehog signaling during vertebrate neural tube patterning: the role of negative feedback. Cold Spring Harb Perspect Biol. 2009;1:a002014. doi: 10.1101/cshperspect.a002014. [DOI] [PMC free article] [PubMed] [Google Scholar]
- 35.Svard J, et al. Genetic elimination of Suppressor of fused reveals an essential repressor function in the mammalian Hedgehog signaling pathway. Dev Cell. 2006;10:187–197. doi: 10.1016/j.devcel.2005.12.013. [DOI] [PubMed] [Google Scholar]
- 36.Ingham PW, McMahon AP. Hedgehog signaling in animal development: paradigms and principles. Genes Dev. 2001;15:3059–3087. doi: 10.1101/gad.938601. [DOI] [PubMed] [Google Scholar]
- 37.Wang B, Fallon JF, Beachy PA. Hedgehog-regulated processing of Gli3 produces an anterior/posterior repressor gradient in the developing vertebrate limb. Cell. 2000;100:423–434. doi: 10.1016/s0092-8674(00)80678-9. [DOI] [PubMed] [Google Scholar]
- 38.Zhang Q, et al. Multiple Ser/Thr-rich degrons mediate the degradation of Ci/Gli by the Cul3-HIB/SPOP E3 ubiquitin ligase. Proc Natl Acad Sci U S A. 2009;106:21191–21196. doi: 10.1073/pnas.0912008106. [DOI] [PMC free article] [PubMed] [Google Scholar]
- 39.Pan Y, Wang C, Wang B. Phosphorylation of Gli2 by protein kinase A is required for Gli2 processing and degradation and the Sonic Hedgehog-regulated mouse development. Dev Biol. 2009;326:177–189. doi: 10.1016/j.ydbio.2008.11.009. [DOI] [PMC free article] [PubMed] [Google Scholar]
- 40.te Welscher P, et al. Progression of vertebrate limb development through SHH-mediated counteraction of GLI3. Science. 2002;298:827–830. doi: 10.1126/science.1075620. [DOI] [PubMed] [Google Scholar]
- 41.Matise MP, Epstein DJ, Park HL, Platt KA, Joyner AL. Gli2 is required for induction of floor plate and adjacent cells, but not most ventral neurons in the mouse central nervous system. Development. 1998;125:2759–2770. doi: 10.1242/dev.125.15.2759. [DOI] [PubMed] [Google Scholar]
- 42.Taipale J, et al. Effects of oncogenic mutations in Smoothened and Patched can be reversed by cyclopamine. Nature. 2000;406:1005–1009. doi: 10.1038/35023008. [DOI] [PubMed] [Google Scholar]
- 43.Kim J, Lee JJ, Gardner D, Beachy PA. Arsenic antagonizes the Hedgehog pathway by preventing ciliary accumulation and reducing stability of the Gli2 transcriptional effector. Proc Natl Acad Sci U S A. 2010;107:13432–13437. doi: 10.1073/pnas.1006822107. [DOI] [PMC free article] [PubMed] [Google Scholar]
- 44.Lauth M, Bergstrom A, Shimokawa T, Toftgard R. Inhibition of GLI-mediated transcription and tumor cell growth by small-molecule antagonists. Proc Natl Acad Sci U S A. 2007;104:8455–8460. doi: 10.1073/pnas.0609699104. [DOI] [PMC free article] [PubMed] [Google Scholar]
- 45.Bai CB, Joyner AL. Gli1 can rescue the in vivo function of Gli2. Development. 2001;128:5161–5172. doi: 10.1242/dev.128.24.5161. [DOI] [PubMed] [Google Scholar]
- 46.Joeng KS, Long F. The Gli2 transcriptional activator is a crucial effector for Ihh signaling in osteoblast development and cartilage vascularization. Development. 2009;136:4177–4185. doi: 10.1242/dev.041624. [DOI] [PMC free article] [PubMed] [Google Scholar]
- 47.Mao J, et al. A novel somatic mouse model to survey tumorigenic potential applied to the Hedgehog pathway. Cancer Res. 2006;66:10171–10178. doi: 10.1158/0008-5472.CAN-06-0657. [DOI] [PMC free article] [PubMed] [Google Scholar]
- 48.Mukhopadhyay S, et al. The Ciliary G-Protein-Coupled Receptor Gpr161 Negatively Regulates the Sonic Hedgehog Pathway via cAMP Signaling. Cell. 2013;152:210–223. doi: 10.1016/j.cell.2012.12.026. [DOI] [PubMed] [Google Scholar]
- 49.Day TF, Yang Y. Wnt and hedgehog signaling pathways in bone development. J Bone Joint Surg Am. 2008;90(1):19–24. doi: 10.2106/JBJS.G.01174. [DOI] [PubMed] [Google Scholar]
- 50.Joeng KS, Schumacher CA, Zylstra-Diegel CR, Long F, Williams BO. Lrp5 and Lrp6 redundantly control skeletal development in the mouse embryo. Dev Biol. 2011 doi: 10.1016/j.ydbio.2011.08.020. [DOI] [PMC free article] [PubMed] [Google Scholar]
- 51.Holmen SL, et al. Decreased BMD and limb deformities in mice carrying mutations in both Lrp5 and Lrp6. J Bone Miner Res. 2004;19:2033–2040. doi: 10.1359/JBMR.040907. [DOI] [PubMed] [Google Scholar]
- 52.de Boer J, et al. Wnt signaling inhibits osteogenic differentiation of human mesenchymal stem cells. Bone. 2004;34:818–826. doi: 10.1016/j.bone.2004.01.016. [DOI] [PubMed] [Google Scholar]
- 53.Cho HH, et al. Endogenous Wnt signaling promotes proliferation and suppresses osteogenic differentiation in human adipose derived stromal cells. Tissue Eng. 2006;12:111–121. doi: 10.1089/ten.2006.12.111. [DOI] [PubMed] [Google Scholar]
- 54.Boland GM, Perkins G, Hall DJ, Tuan RS. Wnt 3a promotes proliferation and suppresses osteogenic differentiation of adult human mesenchymal stem cells. J Cell Biochem. 2004;93:1210–1230. doi: 10.1002/jcb.20284. [DOI] [PubMed] [Google Scholar]
- 55.Chen Y, et al. Beta-catenin signaling plays a disparate role in different phases of fracture repair: implications for therapy to improve bone healing. PLoS Med. 2007;4:e249. doi: 10.1371/journal.pmed.0040249. [DOI] [PMC free article] [PubMed] [Google Scholar]
- 56.Kim JB, et al. Bone regeneration is regulated by wnt signaling. J Bone Miner Res. 2007;22:1913–1923. doi: 10.1359/jbmr.070802. [DOI] [PubMed] [Google Scholar]
- 57.Cooper KL, et al. Initiation of proximal-distal patterning in the vertebrate limb by signals and growth. Science. 2011;332:1083–1086. doi: 10.1126/science.1199499. [DOI] [PMC free article] [PubMed] [Google Scholar]
- 58.Rosello-Diez A, Ros MA, Torres M. Diffusible signals, not autonomous mechanisms, determine the main proximodistal limb subdivision. Science. 2011;332:1086–1088. doi: 10.1126/science.1199489. [DOI] [PubMed] [Google Scholar]
- 59.Zhang D, et al. ALK2 functions as a BMP type I receptor and induces Indian hedgehog in chondrocytes during skeletal development. J Bone Miner Res. 2003;18:1593–1604. doi: 10.1359/jbmr.2003.18.9.1593. [DOI] [PubMed] [Google Scholar]
- 60.Shimono K, et al. Potent inhibition of heterotopic ossification by nuclear retinoic acid receptor-gamma agonists. Nat Med. 2011;17:454–460. doi: 10.1038/nm.2334. [DOI] [PMC free article] [PubMed] [Google Scholar]
- 61.Chen M, et al. Increased glucose tolerance and reduced adiposity in the absence of fasting hypoglycemia in mice with liver-specific Gs alpha deficiency. J Clin Invest. 2005;115:3217–3227. doi: 10.1172/JCI24196. [DOI] [PMC free article] [PubMed] [Google Scholar]
- 62.Logan M, et al. Expression of Cre Recombinase in the developing mouse limb bud driven by a Prxl enhancer. Genesis. 2002;33:77–80. doi: 10.1002/gene.10092. [DOI] [PubMed] [Google Scholar]
- 63.Yu K, et al. Conditional inactivation of FGF receptor 2 reveals an essential role for FGF signaling in the regulation of osteoblast function and bone growth. Development. 2003;130:3063–3074. doi: 10.1242/dev.00491. [DOI] [PubMed] [Google Scholar]
- 64.Nelson DK, Williams T. Frontonasal process-specific disruption of AP-2alpha results in postnatal midfacial hypoplasia, vascular anomalies, and nasal cavity defects. Dev Biol. 2004;267:72–92. doi: 10.1016/j.ydbio.2003.10.033. [DOI] [PubMed] [Google Scholar]
- 65.Mak KK, Chen MH, Day TF, Chuang PT, Yang Y. Wnt/beta-catenin signaling interacts differentially with Ihh signaling in controlling endochondral bone and synovial joint formation. Development. 2006;133:3695–3707. doi: 10.1242/dev.02546. [DOI] [PubMed] [Google Scholar]
- 66.Bai CB, Joyner AL. Gli1 can rescue the in vivo function of Gli2. Development. 2001;128:5161–5172. doi: 10.1242/dev.128.24.5161. [DOI] [PubMed] [Google Scholar]
- 67.Corrales JD, Blaess S, Mahoney EM, Joyner AL. The level of sonic hedgehog signaling regulates the complexity of cerebellar foliation. Development. 2006;133:1811–1821. doi: 10.1242/dev.02351. [DOI] [PubMed] [Google Scholar]
- 68.Long F, Zhang XM, Karp S, Yang Y, McMahon AP. Genetic manipulation of hedgehog signaling in the endochondral skeleton reveals a direct role in the regulation of chondrocyte proliferation. Development. 2001;128:5099–5108. doi: 10.1242/dev.128.24.5099. [DOI] [PubMed] [Google Scholar]
- 69.Mao J, et al. A novel somatic mouse model to survey tumorigenic potential applied to the Hedgehog pathway. Cancer research. 2006;66:10171–10178. doi: 10.1158/0008-5472.CAN-06-0657. [DOI] [PMC free article] [PubMed] [Google Scholar]
- 70.Regard JB, et al. Probing cell type-specific functions of Gi in vivo identifies GPCR regulators of insulin secretion. J Clin Invest. 117:4034–4043. doi: 10.1172/JCI32994. [DOI] [PMC free article] [PubMed] [Google Scholar]
- 71.Yang J, et al. Loss of signaling through the G protein, Gz, results in abnormal platelet activation and altered responses to psychoactive drugs. Proc Natl Acad Sci U S A. 97:9984–9989. doi: 10.1073/pnas.180194597. [DOI] [PMC free article] [PubMed] [Google Scholar]
- 72.Livak KJ, Schmittgen TD. Analysis of relative gene expression data using real-time quantitative PCR and the 2(-Delta Delta C(T)) Method. Methods. 2001;25:402–408. doi: 10.1006/meth.2001.1262. [DOI] [PubMed] [Google Scholar]
- 73.Yang Y, Topol L, Lee H, Wu J. Wnt5a and Wnt5b exhibit distinct activities in coordinating chondrocyte proliferation and differentiation. Development. 2003;130:1003–1015. doi: 10.1242/dev.00324. [DOI] [PubMed] [Google Scholar]
- 74.Storm EE, Kingsley DM. GDF5 coordinates bone and joint formation during digit development. Dev Biol. 1999;209:11–27. doi: 10.1006/dbio.1999.9241. [DOI] [PubMed] [Google Scholar]
- 75.Bai CB, Stephen D, Joyner AL. All mouse ventral spinal cord patterning by hedgehog is Gli dependent and involves an activator function of Gli3. Dev Cell. 2004;6:103–115. doi: 10.1016/s1534-5807(03)00394-0. [DOI] [PubMed] [Google Scholar]
Associated Data
This section collects any data citations, data availability statements, or supplementary materials included in this article.
Supplementary Materials
1
2