Bacterial taxa–area and distance–decay relationships in marine environments (original) (raw)
Abstract
The taxa–area relationship (TAR) and the distance–decay relationship (DDR) both describe spatial turnover of taxa and are central patterns of biodiversity. Here, we compared TAR and DDR of bacterial communities across different marine realms and ecosystems at the global scale. To obtain reliable global estimates for both relationships, we quantified the poorly assessed effects of sequencing depth, rare taxa removal and number of sampling sites. Slope coefficients of bacterial TARs were within the range of those of plants and animals, whereas slope coefficients of bacterial DDR were much lower. Slope coefficients were mostly affected by removing rare taxa and by the number of sampling sites considered in the calculations. TAR and DDR slope coefficients were overestimated at sequencing depth <4000 sequences per sample. Noticeably, bacterial TAR and DDR patterns did not correlate with each other both within and across ecosystem types, suggesting that (i) TAR cannot be directly derived from DDR and (ii) TAR and DDR may be influenced by different ecological factors. Nevertheless, we found marine bacterial TAR and DDR to be steeper in ecosystems associated with high environmental heterogeneity or spatial isolation, namely marine sediments and coastal environments compared with pelagic ecosystems. Hence, our study provides information on macroecological patterns of marine bacteria, as well as methodological and conceptual insights, at a time when biodiversity surveys increasingly make use of high-throughput sequencing technologies.
Keywords: distance-decay, global scale, methodological biases, microbes, pyrosequencing, species-area
Introduction
Quantifying and explaining spatial variation in biodiversity are among the most long-standing problems in ecology because variations of species richness and community composition in space may reflect a multitude of mechanisms responsible for species maintenance or loss. Spatial changes in biodiversity may be examined from gene to community levels, and from local to global scales, but two recurrent spatial patterns of diversity can be observed for all domains of life: First, increasing taxa richness has been repeatedly observed when considering increasingly larger areas (Connor & McCoy 1979; Rosenzweig 1995), a pattern referred to as the taxa–area relationship (hereafter TAR; Fig.1a). Second, the taxonomic composition of biological assemblages is often observed as becoming increasingly more dissimilar with increasing geographic distances, a pattern designated as the distance decay of compositional similarity (or distance–decay relationships, hereafter DDR; (Nekola & White 1999); Fig.1b).
Fig 1.
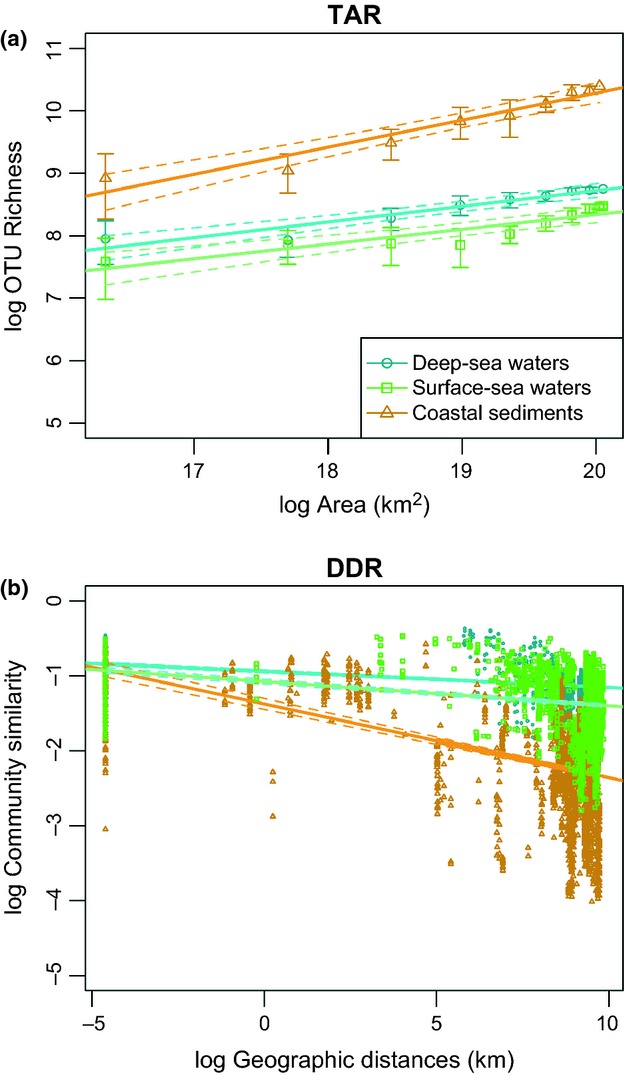
Taxa–area (a) and distance–decay (b) relationships of marine bacterial communities in surface-sea waters (n = 70), deep-sea waters (n = 61) and coastal sediments (n = 72), standardized at 5000 sequences per sample. Error bars in (a) represent the standard deviation of OTU richness according to the reference sample used. In both panels, dotted lines correspond to the 95% confidence intervals for linear regressions.
A power law is usually used to approximate both TAR and DDR (Rosenzweig 1995; Nekola & White 1999), although other models fit better in certain cases (Jobe 2008; Morlon et al. 2008; Dengler 2009). In a log–log space, TAR's and DDR's slope coefficients (referred to as z and β, respectively) represent taxa accumulation rate and compositional turnover rate, respectively, and have both been reported as related to beta diversity in its broadest sense (Harte & Kinzig 1997; Morlon et al. 2008; Tuomisto 2010). While this idea is intuitive for DDR, also TAR relates to measuring beta diversity because its slope coefficient may predict the number of taxa not shared between areas of different dimensions. Although different, these two macroecological patterns may thus obey a common set of processes. Aside from passive sampling effects, TAR is mainly assumed to result from (i) the accumulation of habitats, and therefore species, when increasing the area considered, and (ii) population dynamics, where higher probabilities of colonization and speciation, but lower extinction rates, occur in larger areas (Connor & McCoy 1979; Hubell 2001). Similarly, DDR is likely to be driven by (i) environmental changes across distances, referring thus to niche-based processes, and (ii) population dynamics (e.g. colonization, extinction or speciation; Hubell 2001). Finally, allopatric speciation, caused by limited dispersal, would also contribute to both TAR and DDR.
Consequently, one would expect TAR and DDR slopes to be both steeper when species diversity/diversification is maximized, either through higher spatial complexity of environmental conditions and/or through spatial isolation (Rosenzweig 1995; Drakare et al. 2006). In that respect, TAR has long been thought to be stronger in island-like habitats compared with contiguous ones, but this assumption has recently been invalidated (Drakare et al. 2006). Nevertheless, TAR and DDR slopes are usually steeper in heterogeneous habitats or for organisms with low dispersal rates (Drakare et al. 2006; Soininen et al. 2007). Comparing z and β for organisms with different biological properties or sizes, and/or living in different environments may therefore help to disentangle the processes responsible for species diversity and distribution. Such inferences are however valid only when comparable spatial scales (Turner & Tjorve 2005; Steinbauer et al. 2012), sampling effort and strategy (Cardoso et al. 2009; Dengler 2009) are considered, because z and β are strongly affected by these parameters.
Challenging the widespread idea that microorganisms have a cosmopolitan distribution (Finlay 2002), several studies based on microscopic or molecular approaches have revealed that both TAR and DDR exist for bacteria and micro-eukaryotes at various spatial scales and in both terrestrial and aquatic environments (Hillebrand et al. 2001; Horner-Devine et al. 2004; Bell et al. 2005; Reche et al. 2005; Bell 2010; Martiny et al. 2011; Astorga et al. 2012; Ranjard et al. 2013; Wang et al. 2013). Most of these studies were conducted in single habitat types and have reported much smaller TAR and DDR's slopes coefficients than those reported for macroorganisms. This observation may be supported by the smaller organism sizes of microbes, their higher dispersal rate and higher local population size, which would buffer species loss and mutation fixation already at small spatial scales (Hillebrand et al. 2001; Horner-Devine et al. 2004; Woodcock et al. 2006; Martiny et al. 2011). Yet, the few reports comparing bacterial TAR/DDR across different habitats suggested stronger relationships in heterogeneous habitats (Ranjard et al. 2013; Wang et al. 2013) as well as in island-like habitats compared with continuous habitats (Prosser et al. 2007), resembling observations and assumptions made for macroorganisms.
Most bacterial z and β reported in the literature, however, show unusually large ranges, especially z values (from ∼0.001 to ∼0.3; Woodcock et al. 2006) compared with those observed for plants and animals (from ∼0.1 to ∼0.5; Drakare et al. 2006). This may arise from the spatial scales considered (from one square metre to several ha), which could influence TAR or DDR slope coefficients (Turner & Tjorve 2005), but also from methodological aspects: First, these studies did not follow the same sampling strategies and did not consider the same number of samples. Second, they used molecular tools with varying resolving power. In addition, typical sequencing depth in many earlier studies have been judged insufficient to capture the necessary amount of taxa to accurately characterize microbial TAR (Woodcock et al. 2006), with a large proportion of microbial diversity being too rare to be detected by Sanger sequencing (Curtis & Sloan 2005; Sogin et al. 2006). Third, a noticeable number of studies derived TAR's z values from DDR's β values, as formalized by Harte et al. (1999), but the validity of this approach has been questioned recently (Woodcock et al. 2006; Morlon et al. 2008; McGlinn & Hurlbert 2012).
Together, these methodological issues preclude generalizing TAR and DDR from existing studies and hence limit our understanding of fundamental macroecological patterns for bacteria, emphasizing the need for consistent, high-resolution comparative studies and for better characterizing the potential biases that may affect bacterial TAR and DDR's slopes. Evaluating the extent of these biases is all the more important as molecular approaches are becoming mainstream for describing ‘macrobial’ diversity (Taberlet et al. 2012).
Here, we characterized TAR and DDR for marine bacteria using the icomm database (International Census of Marine Microbes), consisting of one of the most comprehensive sets of short 16S rRNA gene sequences available to date, and gathering hundreds of samples collected across the globe, and from ocean surface to deep seafloor sediments. The corresponding bacterial communities have been previously reported to display distinct structure and diversity patterns, as a result of varying dispersal limitation and energy gradients (Zinger et al. 2011). Accordingly, one would expect bacterial TAR and DDR to be steeper in sediments, due to limited dispersal potential (aggregated bacterial lifestyle) and/or stronger habitat heterogeneity, as compared to open ocean water subjected to more physical mixing. Similarly, steeper TAR and DDR are expected in coastal environments due to shorter environmental gradients and greater immigration of local taxa belonging to other realms such as air, lands and surrounding marine sites. This study therefore addresses three key aspects by: (i) investigating the effects of undersampling on bacterial z and β with respect to the inclusion/removal of rare taxa and both the number of sequences and sites considered; (ii) determining how bacterial TAR and DDR compare across marine realms and ecosystems; and (iii) assessing whether their slopes are steeper in habitats that display higher patchiness or reduced dispersal potential, as observed for macroorganisms (Drakare et al. 2006; Soininen et al. 2007).
Material and methods
Data set description
The data set used for this analysis comprised 438 discrete samples – each consisting of several grams of sediment or litres of water – from globally distributed sites (a map is provided in Fig.1 in Zinger et al. (2011)). These samples were collected in five different ecosystem types defined previously (Zinger et al. 2011), namely coastal waters (n = 175), coastal sediments (n = 72), surface (n = 70) and deep waters (n = 60) in the open ocean, as well as deep-sea sediments (n = 61). These samples were subjected to 454 pyrosequencing of the hypervariable V6 region of the 16S rRNA gene as DNA barcode with the same protocol.
Additional information on molecular data and bioinformatics processing is available in Zinger et al. (2011). Briefly, low-quality sequences (i.e. sequences <50 nt, containing ‘N’ or errors in keys/primers or being not assigned to Bacteria) were discarded from the data set. The noise produced by the 454 pyrosequencing technique was corrected with the single-linkage preclustering (SLP) approach (Huse et al. 2010), and the remaining sequences were then clustered at 3% nt differences using the average-linkage method to define bacterial operational taxonomic units (hereafter OTU). The community data (i.e. the samples and their corresponding OTU abundances) were retrieved from VAMPS in January 2011 and their associated geographic coordinates from microbis (Table S1, Supporting information).
The data set comprised 8 196 009 sequences (ranging from 5193 to 70 064 per sample) and 129 869 OTUs (ranging from 79 to 6879 per sample). Most OTUs were singletons (i.e. ∼52% were represented by only one sequence; Table S2, Supporting information), but these represented a small proportion of the sequences obtained per sample (∼7%). Due to the large discrepancies in sequencing effort among samples, the number of sequences was standardized by randomly resampling 5000 sequences per sample, except for analysing the effects of the removal of rare taxa and sequencing effort.
These standardized abundance data were finally converted into presence/absence data for subsequent statistical treatments. For both raw and standardized abundance data, we determined for each realm and ecosystem type the proportion of singletons, of abundant OTUs (>50 sequences), and the average OTU relative occupancy, that is, the average proportion of sites occupied by each OTU (Table S2, Supporting information). All analyses were carried out in the r environment (r Development Core Team 2010) with the r packages vegan (Oksanen et al. 2011) and gmt (Magnusson 2011), as well as custom r scripts.
TAR and DDR assessment
Because the ICoMM sampling strategy was not initially designed to assess TAR, we defined a fully nested sampling scheme consisting of 10 concentric areas of a radius ranging from 2000 to 20 000 km. By centring this scheme on one particular sample at the time, we used distances between samples (taking into account the Earth's curvature) to assign each sample to each area. The observed OTU richness was then accumulated from small to large areas. This procedure was repeated by successively considering each sample as the centre of the sampling scheme, and the corresponding OTU richness values obtained for areas of the same size were then averaged to obtain one single OTU richness value per area (Fig. S1, Supporting information). This was carried out to reduce the potential community heterogeneity in each area. Estimates of spherical cap area were derived from the artificial areas using the radius of the Earth (6378 km). Landmasses were included in the calculated areas to simplify computations.
We assessed TAR using the generalization of Arrhenius’ equation (1921), approximated by a double logarithmic transformation:

where _S_obs is the average number of observed species, c the intercept parameter, A the area and z the slope coefficient of TAR. This function was chosen because (i) it generally provides better model fittings (Connor & McCoy 1979; Dengler 2009) and (ii) it is of wide use (Rosenzweig 1995; Dengler 2009), especially in the field of microbial ecology (Prosser et al. 2007). We chose to focus on the slope z and not on the intercept c, because the latter is more subjected to variation, especially when small areas are not included in the analysis (Connor & McCoy 1979), which is the case here. z values were determined by linear regression, and their significance was assessed by Student's _t_-tests, which were found significant in most cases (P <0.01 for ∼90% of sample resampling steps).
To measure DDR, pairwise community similarities between samples were calculated using the Sorensen index, which is widely used for calculating DDR in both micro- and macrobial ecology, so as to obtain estimates that can be compared with previous works. DDR was then assessed in a logarithmic transformed space to enhance the linear fitting, according to Nekola & White (1999) as follows:

where _S_com is the community similarity, a the intercept parameter, D the geographic distance and β the slope of DDR. Because the similarity/distance matrices contained null values, we added 0.01 to all values before log-transforming them. Here again, we focused on β and not on the intercept. The significance of β was tested by 1000 Monte Carlo permutations of the residuals under the full regression model (Legendre & Legendre 1998) for the initial data set only, due to computational resource limitations, and β was found significant for each ecosystem type surveyed (P <0.001).
All log-transformations were performed using the natural logarithm, which give the same results than log10 transformations (Rosenzweig 1995).
Factors affecting the variations of z and β
We first examined the effects of various undersampling issues on z and β estimates. First, we successively removed OTUs represented by less than 1, 10, 30 and so forth, up to 610 sequences in each sample from the standardized abundance data using a modified version of multicola (Gobet et al. 2010). Second, the effects of sequencing depth and number of samples considered in the analysis were assessed by performing random resampling with replacement (i.e. bootstrapping) of (i) an increasing number of sequences in each sample from the original abundance data and (ii) an increasing number of samples in each realm/ecosystem type from the standardized presence/absence data. To obtain reliable linear regression parameters, the resampling of samples was conducted so that at least 3 areas of different sizes were considered. The resulting community tables were then converted into presence/absence data, and z and β were calculated as explained above.
Finally, to compare z and β across realms or ecosystems, we first randomly sampled 5000 sequences and then performed 1000 random resampling of 40 samples, resulting in 1000 z and 1000 β values for each ecosystem type (Fig. S1, Supporting information). As the bootstrapped slope coefficients were not normally distributed, differences in z or β distributions with varying sequencing/sampling depth or across realms/ecosystems were assessed using Mann–Whitney tests with Holm correction for multiple testing when appropriate. The congruence of z and β in ranking ecosystems with each other was evaluated by comparing Kendall τ correlation coefficients for each observed z and β pair against those based on parameter pairs obtained by random permutations of the data, so as to create a null distribution.
Results
The effects of removing rare taxa, of sequencing depth and number of sites considered, were examined in three ecosystem types harbouring contrasted bacterial communities in terms of both composition and variability so as to better evaluate the variation of z and β in different contexts (Fig.1). A previous survey of the ICoMM data set showed that bacterial communities in surface and deep-sea waters displayed much lower variability and lower evenness than those from coastal sediments (Zinger et al. 2011). These communities also displayed noticeable differences in terms of OTU richness, amount of singletons and average proportion of sites occupied by each OTU (Table S2, Supporting information). In Fig.1, the number of sequences per sampling site was standardized, but the number of samples available for these ecosystem types differed, making it difficult to disentangle the respective effects of ecosystem heterogeneity and sampling effort on the steeper TAR and DDR's slopes observed for coastal sediment bacteria. Hereafter, we discuss the absolute values of β (referred to as |β|, β being always negative) to facilitate the interpretation of the variations of DDR slopes coefficients in relation to the strength of the relationship.
Influence of rare taxa removal on TAR and DDR
We first examined the effects of the removal of rare taxa on the intrinsic structure of bacterial communities associated with the aforementioned case-studies ecosystems (Fig. S2, Supporting information): this resulted in a complete OTU impoverishment in several samples that were therefore excluded from the analysis (Fig. S2a, Supporting information), but it did not noticeably change the overall distribution of pairwise geographic distances between samples (Fig. S2b–d, Supporting information). Removing taxa of increasing abundance also affected the average proportion of sites occupied by each OTU, which increased in surface- and deep-sea waters (Fig. S2h, Supporting information), but tended to decrease in coastal sediments. The proportion of OTUs of the total OTU richness detected in the smallest area was affected by the removal of rare taxa mostly in surface-sea waters and coastal sediments (Fig. S2i, Supporting information). Rare taxa removal also tended to maximize regional community similarities (samples <2000 km apart) and strongly minimized similarities between geographically distant communities (samples >12 000 km apart), especially in pelagic ecosystems (Fig. S2j–l, Supporting information).
Fig 2.
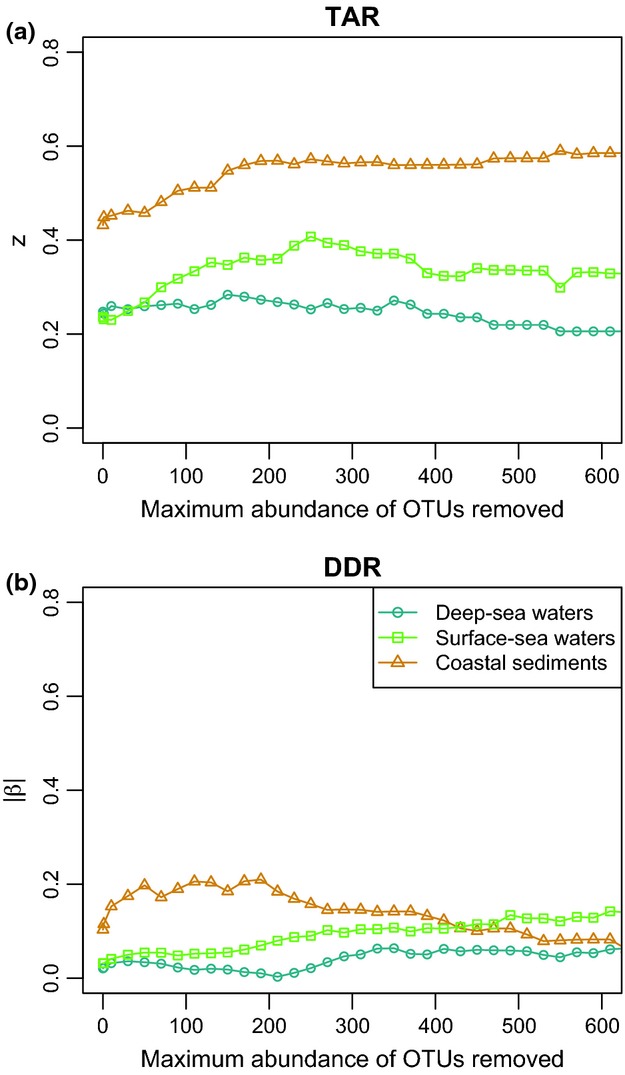
Effect of the removal of rare taxa on z (a) and |β| (b) in the three ecosystem types studied (5000 sequences per sample initially).
The removal of rare taxa affected z and β differentially depending on the ecosystem type considered (Fig.2 and Fig. S3, Supporting information), with the largest influences on coastal sediments. The average proportion of sites occupied by each OTU correlated negatively with z values (Kendall τ = −0.44, −0.56, −0.75 for surface-sea waters, deep-sea waters and coastal sediments respectively, P <0.001), and positively with |β| values (Kendall τ = 0.29, 0.58, 0.38, P <0.02). |β| values correlated even more with the differences between similarities obtained for close versus distant communities (Kendall τ = 0.87, 0.65, 0.43, P <0.001). The removal of rare taxa changed the patterns identified using initial data sets (Fig.1) for z values, which were always larger in coastal sediments but ranked differently between surface- and deep-sea waters. The patterns observed in Fig.1 were conserved for β_,_ excepted when the maximum abundance chosen for defining rare OTUs was unrealistically high.
Effects of sequencing depth and sampling effort on TAR and DDR
Overall, sequencing depth (i.e. the number of DNA amplicons sequenced) per sample affected the variability of z and β very weakly, and only when it was shallow (<500 sequences; Fig.3a, c). Increasing sequencing depth slightly reduced both z and |β| regardless of ecosystem type, a feature less pronounced in surface- and deep-sea waters. Finally, z and |β| started to stabilize at ∼4000 sequences and were always significantly larger in coastal sediments (W = 0, Holm-corrected P << 0.0001) as compared to other ecosystems.
Fig 3.
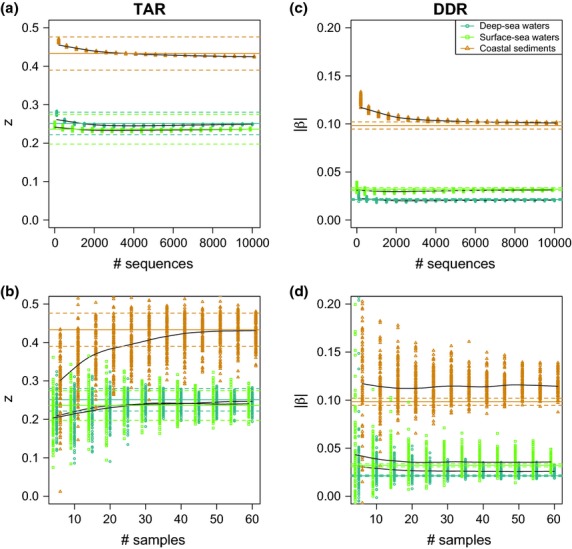
Effect of sequencing depth (a,c) and sampling effort (b,d) on z (a,b) and |β| (c,d) obtained with 100 random resampling for each sequencing/sampling depth. A local-fitting algorithm (LOESS smoother, black continuous lines) was used, and numbers of samples/sequences were slightly modified for surface waters and coastal sediment to help to visualize changes in z and |β|. Continuous and dotted coloured straight lines correspond to slopes and their standard errors, respectively, obtained for the initial data set (Fig.1) for comparative purposes.
In contrast, the number of sampling sites included in the analysis strongly affected z and β (Fig.3b,d), whose variability, which were again much larger for coastal sediments, appeared to be consistently reduced when considering at least ∼40 samples per ecosystem type. Furthermore, z rose with increasing number of samples considered, whereas β remained mostly unaffected regardless of the ecosystem type considered. Although the three ecosystem types displayed overlapping ranges of z and |β| values when the number of sampling sites considered was low, they were overall significantly larger in coastal sediments (W < 1993, Holm-corrected P << 0.001). However, surface- and deep-sea water z values were similar and ranked differently depending on the number of sampling sites included in the analysis.
Comparison of TAR's and DDR's slope coefficients
We first assessed the correlation between z and |β| values obtained per ecosystem type at each resampling step and found them to be significantly, but weakly correlated (Fig. S4, Supporting information). When comparing z and |β| values obtained for different realms/ecosystem types, they were always larger in sediments than in seawaters (Fig.4). Both z and β values were all significantly different among ecosystem types (excepted β values in coastal waters and deep-sea sediments; Fig.4), but did not rank similarly neither when considering z and |β|'s median values (Kendall τ = 0.43, P =0.24), nor when comparing the correlation of z and β pairs generated at each resampling step against a null distribution (W = 215218, P =1; Fig. S5, Supporting information). Nevertheless, z and |β| in coastal waters and coastal/deep-sea sediments were always the highest.
Fig 4.
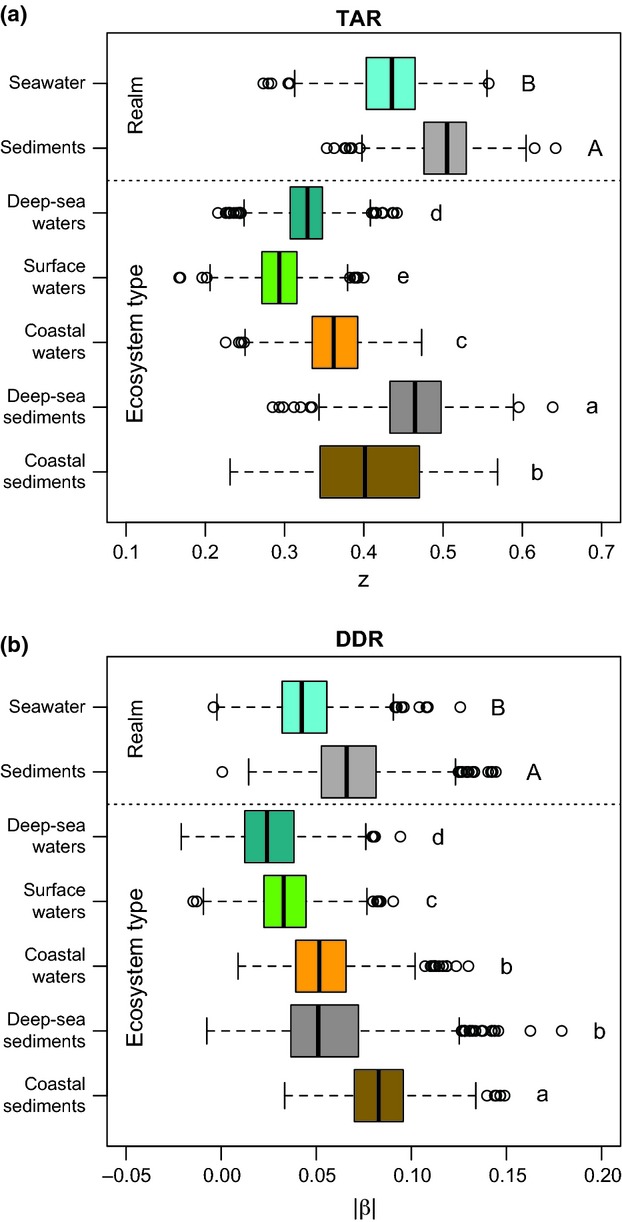
Variation of z (a) and |β| (b) according to realms and ecosystem type. z and β values per ecosystem type were obtained by randomly resampling 40 samples and 5000 sequences per sample 1000 times in the initial community tables. Upper/lower case letters indicate significant differences (Mann–Whitney tests, Holm-corrected P < 0.05) between realms/ecosystem types.
Discussion
In microbial ecology, taxa–area relationship (TAR) and distance–decay relationship (DDR) have received growing attention over the last decade. Comparing their slopes across different ecosystem remains difficult because of knowledge gaps in fundamental methodological aspects, leading to divergent results and ecological interpretations (Woodcock et al. 2006). Our study aimed at reporting on how TAR's z and DDR's β are affected by different undersampling biases, to provide a first, robust comparison of TAR and DDR in the main marine ecosystems on a global scale.
Here, we did not directly consider the biases introduced by molecular techniques, for example PCRs/sequencing errors, which are known to affect both alpha- and beta-diversity estimates (Schloss et al. 2011) and for which no computationally efficient solutions exist yet (Schloss et al. 2011; Coissac et al. 2012). Although the single-linkage preclustering approach was used here, our data may still contain such errors (Huse et al. 2010). Nevertheless, these errors are likely (i) to generate OTUs of low abundance (Kunin et al. 2010; Quince et al. 2011; Coissac et al. 2012) and (ii) to be of the same magnitude across samples, because the latter were processed identically from amplification to pyrosequencing, with predicted low impact on the resulting diversity patterns and ecological interpretation (Gobet et al. 2010; Schloss et al. 2011; Zinger et al. 2012). Here, we noticed an increase in community similarity for spatially close samples (Fig. S2j–l, Supporting information) when removing the rarest taxa (maximum abundance <30) resulting in higher |β| values for all three ecosystems and especially in sediments (Fig.2b). It seems unlikely that this results from technical artefacts only and could also be explained by shorter environmental gradients and higher random colonization–extinction dynamics in sediments (Gobet et al. 2012).
Detection of the rare biosphere: effects on bacterial TAR and DDR
Removal of rare taxa
Microbial communities exhibit exceptionally long-tailed rank abundance distributions, because of the high proportion of rare types (Curtis & Sloan 2005) represented by one or a few sequences in a given sample. They are thus subjected to considerable undersampling biases potentially leading to the observation of erroneous macroecological patterns (Woodcock et al. 2006; Prosser et al. 2007). Given that TAR may especially arise from the accumulation of new rare taxa with increasing areas, removing rare taxa would result in a reduction in z values, as shown theoretically with synthetic, homogeneous communities (Woodcock et al. 2006).
Here, this concept tended to hold true only for the deep-sea water communities (Fig.2a). This apparent difference with the theoretical considerations is most likely to arise from strong differences in many physical and biological characteristics between the three ecosystems used here as case studies. Indeed, the proportion of abundant OTUs with broad geographic ranges was higher in pelagic ecosystems (associated with higher dispersal rates), especially in deep-sea waters, than in coastal sediments (associated with shorter environmental gradients and/or limited dispersal) where abundant OTUs occurred in a few samples (Table S2, Fig. S2h, Supporting information).
These differences have strong implications for the effect of rare taxa removal on z values. The number of new OTUs encountered by increasing the sampling area in coastal sediments was highest in comparison with all other environments (Fig.2). Homogeneous communities, such as those of deep-sea waters or the synthetic communities of Woodcock et al. (2006), showed less effects. These results agree with previous observations of a negative relationship between z and the average proportion of sites occupied by each species (Sizling & Storch 2004; Storch et al. 2007).
Furthermore, considering DDR's slopes coefficients, a wider distribution of abundant taxa such as in pelagic ecosystems caused weak variations of β because the community similarity of both close-by and remote samples increased when removing taxa with sequence abundances of up to 200 (Fig.2b). In contrast, β strongly increased in coastal sediments when removing OTUs of abundance <200, due to higher/complete taxa turnover between remote samples, as a result of a higher spatial aggregation in sediments (Table S2, Fig. S2h, Supporting information). These results agree with an earlier study conducted on a plant community at local spatial scale (Morlon et al. 2008), which showed that intermediate sampling intensities strongly increase the steepness of DDR when taxa spatial aggregation is high. Together, these observations support the idea that DDR's slope would not reflect species turnover rate per se, but rather the spatial aggregation degree of the most abundant taxa (Morlon et al. 2008; Tuomisto 2010).
Sampling and sequencing effort
Microbiologists may face undersampling issues at several levels in practice, for example while collecting a limited number of samples, each consisting generally of a few grams of sediment or litres of water (i.e. a few billion cells), and during DNA extraction, PCR amplification and sequencing steps, where only a subset of the sample diversity is finally retrieved and analysed. Although limitations in sequencing depth have considerably been reduced with the advent of next-generation sequencing technologies, it is still believed that a large proportion of microbial taxa remains undetected (Quince et al. 2008).
We showed here that the number of sequences per sample only weakly affected z and |β| in terms of variability and value, as compared to the effects of the number of samples considered (Fig.3). The ranking of both coefficients across ecosystem types was independent of the sequencing depth, supporting previous observations on bacterial diversity estimates and patterns (Shaw et al. 2008; Lundin et al. 2012). This could be explained by (i) a higher homogeneity of the taxa pool from one DNA extract versus distinct, yet neighbouring samples and (ii) the sample set randomly selected for the analyses. Yet, a weak undersampling bias was observed for sequencing depths below ∼4000 sequences, producing higher z and |β| values (Fig.3a,c). Finally, TAR was systematically underestimated when reducing the number of sampling sites (Fig.3b), suggesting that species richness may be underestimated in larger areas due to insufficient sampling (Turner & Tjorve 2005).
Our results therefore indicate that undersampling biases are of poor incidence (Figs3) when comparing TAR and DDR of communities with highly divergent properties (e.g. evenness, extent of spatial OTU aggregation/range). Yet, care has to be taken when comparing communities sharing more similar characteristics, as shown by the changes in the ranking of surface- and deep-sea waters z and |β| values when removing rare taxa or increasing the number of sites considered (Figs2 and 3b,c).
Congruence and patterns of marine bacterial TAR and DDR at the global scale
The bacterial z reported here are much higher (from ∼ 0.3 to 0.6; Fig.4a) than some of those previously reported (∼0.002; Horner-Devine et al. 2004; Ranjard et al. 2013). Apart from differences in habitats and communities investigated, as well as spatial ranges and sampling efforts, these studies derived z from β, according to Harte et al. (1999). Initially developed for large-scale surveys, Harte's method is especially convenient for microbiologists, for whom characterizing microbial diversity in a given area is almost impossible already at the scale of several meters and for whom community turnover is more easily retrieved. Yet, the derivation of z from β has recently been questioned for micro- and macrobial communities alike (Woodcock et al. 2006; Jobe 2008; Morlon et al. 2008; McGlinn & Hurlbert 2012), and our results empirically support the lack of direct relationships between them: First, if one transforms the |β| values in our study into z values according to Harte's method (with _z = −_2β), this would result in z values that are far lower than those obtained by the richness-based approach (Fig.4). Second, z and |β| produced from same bootstrapped communities did not systematically agree (Fig. S4, Supporting information). This incongruence was also observed when comparing TAR versus DDR patterns across ecosystem types (Fig.4), questioning the validity of a power–law relationship between species richness, area and species turnover rate (Jobe 2008; McGlinn & Hurlbert 2012).
Even when considering bacterial TAR obtained previously (z ∼ 0.1–0.3) in aquatic (Bell et al. 2005; Reche et al. 2005) or soil ecosystems (Prosser et al. 2007) via classical approaches, the z values reported here (Fig.4) remained higher, probably due to the larger spatial scale considered in our study. Furthermore, the values are consistent with those reported for macroorganisms (z ∼ 0.2–0.7) on both moderate (Drakare et al. 2006) and large spatial scales (Storch et al. 2012), although exact estimates of bacterial z are likely to change when more samples or sequences are used (Fig.3a,b). This finding contradicts previous observations of a positive relationship between z and organism body size (Hillebrand et al. 2001; Drakare et al. 2006), attributed to higher microbial dispersion rate, which may be balanced by a higher microbial speciation rate and endemism than usually thought (Cohan & Koeppel 2008).
In contrast, marine bacterial |β| overall appeared much smaller than those reported for macroorganisms (|β|˜ 0.2–0.7; Nekola & White 1999), but mirrored those obtained at the regional/global scales in other bacterial community studies (Martiny et al. 2011; Ranjard et al. 2013). Such a feature may result from the higher dispersal rate of bacteria on a global scale. But it may also arise from the high proportions of rare, sample-specific OTUs that bacterial communities usually display already on a local scale (Youssef et al. 2010; Dolan & Stoeck 2011), be it due to habitat microheterogeneity or undersampling biases. And this effect would be further enhanced by the lose resolution of beta-diversity indices for sites sharing few species (Anderson et al. 2011).
The marine realms and ecosystem types investigated here differed in many aspects. For instance, sediments may contrast with pelagic ecosystems through (i) stronger variations of environmental conditions on smaller spatial scales, (ii) the sessile lifestyle of sediment associated bacteria, which may cause spatial isolation. Accordingly, we observed that TAR and DDR produced in sediments were always steeper (Fig.4). In the same way, coastal environments displayed steeper TAR and DDR in general when considering each realm separately (Fig.4). This is in agreement with the higher heterogeneity and greater immigration potential that may occur at the terrestrial–oceanic interface. In contrast, z and |β| observed in open ocean waters – exhibiting higher physical mixing due to currents, and therefore higher dispersal potential and/or habitat homogeneity – were overall the lowest (Fig.4). Nevertheless, the existence of weak TAR and DDR in these environments reflects weak, but significant dispersal limitations, as suggested by the latitudinal patterns of surface-water bacteria (Amend et al. 2013; Sul et al. 2013). Although no other studies compared TAR and DDR within and across these two realms, our results seem congruent with previous observations made between habitats of contrasting spatial heterogeneity/isolation for both macroorganisms (Drakare et al. 2006; Soininen et al. 2007; Baldi 2008) and bacteria (Prosser et al. 2007; Ranjard et al. 2013).
Conclusion
This study provides a first comparison of global-scale taxa–area and distance–decay relationships for bacterial communities of different marine ecosystems, and of the effects of potential methodological biases. We showed that undersampling biases may have significant and decoupled effects on TAR and DDR slopes, depending on the community spatial structure. This emphasizes the need for collecting more environmental samples over increasing sequencing depth. Finally, our results indicate that on large geographical scales, bacterial TAR is of the same magnitude than reported for macroorganisms, but not DDR. This observation confirms that related, but distinct processes underlie those biodiversity patterns.
Acknowledgments
The authors are indebted to ICoMM members, who contributed to the building of the ICoMM data set, to the Census of Marine Life program and to Eric Coissac and three anonymous reviewers for insightful discussions. This study was financed by the Leibniz program of the DFG to AB, the Max Planck Society and the Helmholtz Association. LZ was also supported by the ANR project ANR-09-GENM-033. The authors also acknowledge the Micro B3 project funded by the European Union's Seventh Framework Programme (Joint Call OCEAN.2011-2: Marine microbial diversity – new insights into marine ecosystems functioning and its biotechnological potential) under the Grant Agreement No 287589.
Data accessibility
DNA sequences and final community data: VAMPS, http://vamps.mbl.edu. Samples from the KCK_DSS_Bv6 project have been deposited on the GenBank Sequence Read Archive (www.ncbi.nlm.nih.gov; SRA046414.1).
Sample names and associated geographic coordinates or ecosystem type are uploaded as online supplemental material (Table S1).
r scripts used in this study are also uploaded as online supplemental material.
L.Z. and A.R. designed the study; L.Z. performed the analyses and wrote the first draft of the manuscript, and all authors contributed substantially to revisions.
Supporting Information
Additional supporting information may be found in the online version of this article.
Supplementary
Table S1 Sample name and associated characteristics. Longitudes and latitudes are provided in decimal degrees and sample depth in metres.
Table S2 Data set characteristics per ecosystem type and realm.
Fig. S1 Schematic representation of the analytical pipeline used to calculate TAR's and DDR's slope coefficients.
Fig. S2 Effect of the removal of rare taxa on data set characteristics in surface-sea waters (green, squares), deep-sea waters (blue, circles) and coastal sediments (orange, triangles): (a) number of nonempty, remaining samples, (b–d) pairwise geographic distances, (e–g) Average richness and percentage of remaining OTUs and sequences per samples, (h) Average OTU relative occupancy (average proportion of sites occupied by each OTU), (i) Proportion of OTUs detected in the smallest area, (j–l) Pairwise similarities between close (geographic distances <2000 km, left part of boxplots) and distant communities (geographic distances >12 000 km, right part of boxplots).
Fig. S3 Effect of the removal of rare taxa TAR (a) and DDR (b) slope coefficients and intercepts.
Fig. S4 Relationship between z and β obtained per realm/ecosystem type obtained with 1000 randomly resampling of 40 samples in the standardized presence/absence community tables.
Fig. S5 Distribution of Kendall τ correlation coefficients between z and β pairs obtained for each ecosystem type at each resampling step (green bars) and between z and permuted β values (grey bars) defined as a null distribution.
References
- Amend AS, Oliver TA, Amaral-Zettler LA, et al. Macroecological patterns of marine bacteria on a global scale. Journal of Biogeography. 2013;40:800–811. [Google Scholar]
- Anderson MJ, Crist TO, Chase JM, et al. Navigating the multiple meanings of beta diversity: a roadmap for the practicing ecologist. Ecology Letters. 2011;14:19–28. doi: 10.1111/j.1461-0248.2010.01552.x. [DOI] [PubMed] [Google Scholar]
- Arrhenius O. Species and area. Journal of Ecology. 1921;9:95–99. [Google Scholar]
- Astorga A, Oksanen J, Luoto M, et al. Distance decay of similarity in freshwater communities: do macro- and microorganisms follow the same rules? Global Ecology and Biogeography. 2012;21:365–375. [Google Scholar]
- Baldi A. Habitat heterogeneity overrides the species-area relationship. Journal of Biogeography. 2008;35:675–681. [Google Scholar]
- Bell T. Experimental tests of the bacterial distance-decay relationship. ISME Journal. 2010;4:1357–1365. doi: 10.1038/ismej.2010.77. [DOI] [PubMed] [Google Scholar]
- Bell T, Ager D, Song JI, et al. Larger islands house more bacterial taxa. Science. 2005;308:1884. doi: 10.1126/science.1111318. [DOI] [PubMed] [Google Scholar]
- Cardoso P, Borges PAV, Veech JA. Testing the performance of beta diversity measures based on incidence data: the robustness to undersampling. Diversity and Distributions. 2009;15:1081–1090. [Google Scholar]
- Cohan FM, Koeppel AF. The origins of ecological diversity in prokaryotes. Current Biology. 2008;18:R1024–R1034. doi: 10.1016/j.cub.2008.09.014. [DOI] [PubMed] [Google Scholar]
- Coissac E, Riaz T, Puillandre N. Bioinformatic challenges for DNA metabarcoding of plants and animals. Molecular Ecology. 2012;21:1834–1847. doi: 10.1111/j.1365-294X.2012.05550.x. [DOI] [PubMed] [Google Scholar]
- Connor EF, McCoy ED. Statistics and biology of the species-area relationship. The American Naturalist. 1979;113:791–833. [Google Scholar]
- Curtis TP, Sloan WT. Exploring microbial diversity – a vast below. Science. 2005;309:1331–1333. doi: 10.1126/science.1118176. [DOI] [PubMed] [Google Scholar]
- Dengler J. Which function describes the species-area relationship best? A review and empirical evaluation. Journal of Biogeography. 2009;36:728–744. [Google Scholar]
- Development Core Team R. R: A language and environment for statistical computing. Vienna: R Foundation for Statistical Computing; 2010. [Google Scholar]
- Dolan JR, Stoeck T. Repeated sampling reveals differential variability in measures of species richness and community composition in planktonic protists. Environmental Microbiology Reports. 2011;3:661–666. doi: 10.1111/j.1758-2229.2011.00250.x. [DOI] [PubMed] [Google Scholar]
- Drakare S, Lennon JJ, Hillebrand H. The imprint of the geographical, evolutionary and ecological context on species-area relationships. Ecology Letters. 2006;9:215–227. doi: 10.1111/j.1461-0248.2005.00848.x. [DOI] [PubMed] [Google Scholar]
- Finlay BJ. Global dispersal of free-living microbial eukaryote species. Science. 2002;296:1061–1063. doi: 10.1126/science.1070710. [DOI] [PubMed] [Google Scholar]
- Gobet A, Quince C, Ramette A. Multivariate Cutoff Level Analysis (MultiCoLA) of large community data sets. Nucleic Acids Research. 2010;38:e155. doi: 10.1093/nar/gkq545. [DOI] [PMC free article] [PubMed] [Google Scholar]
- Gobet A, Boeer SI, Huse SM, et al. Diversity and dynamics of rare and of resident bacterial populations in coastal sands. Isme Journal. 2012;6:542–553. doi: 10.1038/ismej.2011.132. [DOI] [PMC free article] [PubMed] [Google Scholar]
- Harte J, Kinzig AP. On the implications of species-area relationships for endemism, spatial turnover, and food web patterns. Oikos. 1997;80:417–427. [Google Scholar]
- Harte J, McCarthy S, Taylor K, Kinzig A, Fischer ML. Estimating species-area relationships from plot to landscape scale using species spatial-turnover data. Oikos. 1999;86:45–54. [Google Scholar]
- Hillebrand H, Watermann F, Karez R, Berninger UG. Differences in species richness patterns between unicellular and multicellular organisms. Oecologia. 2001;126:114–124. doi: 10.1007/s004420000492. [DOI] [PubMed] [Google Scholar]
- Horner-Devine M, Lage M, Hughes J, Bohannan B. A taxa-area relationship for bacteria. Nature. 2004;432:750–753. doi: 10.1038/nature03073. [DOI] [PubMed] [Google Scholar]
- Hubell SP. The Unified Neutral Theory of Biodiversity and Biogeography. Princeton, New Jersey: Princeton University Press; 2001. [Google Scholar]
- Huse SM, Welch DM, Morrison HG, Sogin ML. Ironing out the wrinkles in the rare biosphere through improved OTU clustering. Environmental Microbiology. 2010;12:1889–1898. doi: 10.1111/j.1462-2920.2010.02193.x. [DOI] [PMC free article] [PubMed] [Google Scholar]
- Jobe RT. Estimating landscape-scale species richness: Reconciling frequency- and turnover-based approaches. Ecology. 2008;89:174–182. doi: 10.1890/06-1722.1. [DOI] [PubMed] [Google Scholar]
- Kunin V, Engelbrektson A, Ochman H, Hugenholtz P. Wrinkles in the rare biosphere: pyrosequencing errors can lead to artificial inflation of diversity estimates. Environmental Microbiology. 2010;12:118–123. doi: 10.1111/j.1462-2920.2009.02051.x. [DOI] [PubMed] [Google Scholar]
- Legendre P, Legendre L. Numerical Ecology. 2. Amsterdam: Elsevier science; 1998. [Google Scholar]
- Lundin D, Severin I, Logue JB, et al. Which sequencing depth is sufficient to describe patterns in bacterial alpha- and beta-diversity? Environmental Microbiology Reports. 2012;4:367–372. doi: 10.1111/j.1758-2229.2012.00345.x. [DOI] [PubMed] [Google Scholar]
- Magnusson A. 2011. gmt: Interface between GMT Map-Making Software and R.
- Martiny JBH, Eisen JA, Penn K, Allison SD, Horner-Devine MC. Drivers of bacterial beta-diversity depend on spatial scale. Proceedings of the National Academy of Sciences, USA. 2011;108:7850–7854. doi: 10.1073/pnas.1016308108. [DOI] [PMC free article] [PubMed] [Google Scholar]
- McGlinn DJ, Hurlbert AH. Scale dependence in species turnover reflects variance in species occupancy. Ecology. 2012;93:294–302. doi: 10.1890/11-0229.1. [DOI] [PubMed] [Google Scholar]
- Morlon H, Chuyong G, Condit R, et al. A general framework for the distance-decay of similarity in ecological communities. Ecology Letters. 2008;11:904–917. doi: 10.1111/j.1461-0248.2008.01202.x. [DOI] [PMC free article] [PubMed] [Google Scholar]
- Nekola JC, White PS. The distance decay of similarity in biogeography and ecology. Journal of Biogeography. 1999;26:867–878. [Google Scholar]
- Oksanen J, Blanchet GF, Kindt R, et al. 2011. vegan: Community Ecology Package.
- Prosser JI, Bohannan BJ, Curtis TP, et al. Essay – the role of ecological theory in microbial ecology. Nature Reviews Microbiology. 2007;5:384–392. doi: 10.1038/nrmicro1643. [DOI] [PubMed] [Google Scholar]
- Quince C, Curtis TP, Sloan WT. The rational exploration of microbial diversity. ISME Journal. 2008;2:997–1006. doi: 10.1038/ismej.2008.69. [DOI] [PubMed] [Google Scholar]
- Quince C, Lanzen A, Davenport R, Turnbaugh P. Removing noise from pyrosequenced amplicons. BMC Bioinformatics. 2011;12:38. doi: 10.1186/1471-2105-12-38. [DOI] [PMC free article] [PubMed] [Google Scholar]
- Ranjard L, Dequiedt S, Chemidlin Prévost-Bouré N, et al. Turnover of soil bacterial diversity driven by wide-scale environmental heterogeneity. Nature Communications. 2013;4:1434. doi: 10.1038/ncomms2431. [DOI] [PubMed] [Google Scholar]
- Reche I, Pulido-Villena E, Morales-Baquero R, Casamayor EO. Does ecosystem size determine aquatic bacterial richness? Ecology. 2005;86:1715–1722. [Google Scholar]
- Rosenzweig ML. Species diversity in space and time. Cambridge: Cambridge University Press; 1995. [Google Scholar]
- Schloss PD, Gevers D, Westcott SL. Reducing the effects of PCR amplification and sequencing artifacts on 16S rRNA-based studies. PLoS One. 2011;6:e27310. doi: 10.1371/journal.pone.0027310. [DOI] [PMC free article] [PubMed] [Google Scholar]
- Shaw A, Halpern A, Beeson K, et al. It's all relative: ranking the diversity of aquatic bacterial communities. Environmental Microbiology. 2008;10:2200–2210. doi: 10.1111/j.1462-2920.2008.01626.x. [DOI] [PubMed] [Google Scholar]
- Sizling AL, Storch D. Power-law species-area relationships and self-similar species distributions within finite areas. Ecology Letters. 2004;7:60–68. [Google Scholar]
- Sogin M, Morrison H, Huber J, et al. Microbial diversity in the deep sea and the underexplored “rare biosphere”. Proceedings of the National Academy of Sciences, USA. 2006;103:12115–12120. doi: 10.1073/pnas.0605127103. [DOI] [PMC free article] [PubMed] [Google Scholar]
- Soininen J, McDonald R, Hillebrand H. The distance decay of similarity in ecological communities. Ecography. 2007;30:3–12. [Google Scholar]
- Steinbauer MJ, Dolos K, Reineking B, Beierkuhnlein C. Current measures for distance decay in similarity of species composition are influenced by study extent and grain size. Global Ecology and Biogeography. 2012;21:1203–1212. [Google Scholar]
- Storch D, Šizling AL, Gaston KJ. Scaling species richness and distribution: uniting the species–area and species–energy relationships. In: Storch D, Marquet P, Brown J, editors. Scaling Biodiversity. Cambridge: Cambridge University Press; 2007. pp. 300–321. [Google Scholar]
- Storch D, Keil P, Jetz W. Universal species-area and endemics-area relationships at continental scales. Nature. 2012;488:78–81. doi: 10.1038/nature11226. [DOI] [PubMed] [Google Scholar]
- Sul WJ, Oliver TA, Ducklow HW, Amaral-Zettler LA, Sogin ML. Marine bacteria exhibit a bipolar distribution. Proceedings of the National Academy of Sciences, USA. 2013;110:2342–2347. doi: 10.1073/pnas.1212424110. [DOI] [PMC free article] [PubMed] [Google Scholar]
- Taberlet P, Coissac E, Pompanon F, Brochmann C, Willerslev E. Towards next-generation biodiversity assessment using DNA metabarcoding. Molecular Ecology. 2012;21:2045–2050. doi: 10.1111/j.1365-294X.2012.05470.x. [DOI] [PubMed] [Google Scholar]
- Tuomisto H. A diversity of beta diversities: straightening up a concept gone awry. Part 1. Defining beta diversity as a function of alpha and gamma diversity. Ecography. 2010;33:2–22. [Google Scholar]
- Turner WR, Tjorve E. Scale-dependence in species-area relationships. Ecography. 2005;28:721–730. [Google Scholar]
- Wang J, Shen J, Wu Y, et al. Phylogenetic beta diversity in bacterial assemblages across ecosystems: deterministic versus stochastic processes. Isme Journal. 2013;7:1310–1321. doi: 10.1038/ismej.2013.30. [DOI] [PMC free article] [PubMed] [Google Scholar]
- Woodcock S, Curtis TP, Head IM, Lunn M, Sloan WT. Taxa-area relationships for microbes: the unsampled and the unseen. Ecology Letters. 2006;9:805–812. doi: 10.1111/j.1461-0248.2006.00929.x. [DOI] [PubMed] [Google Scholar]
- Youssef N, Couger M, Elshahed M. Fine-scale bacterial beta diversity within a complex ecosystem (Zodletone Spring, OK, USA): the role of the rare biosphere. PLoS One. 2010;5:e12414. doi: 10.1371/journal.pone.0012414. [DOI] [PMC free article] [PubMed] [Google Scholar]
- Zinger L, Amaral-Zettler LA, Fuhrman JA, et al. Global patterns of bacterial Beta-diversity in seafloor and seawater ecosystems. PLoS One. 2011;6:e24570. doi: 10.1371/journal.pone.0024570. [DOI] [PMC free article] [PubMed] [Google Scholar]
- Zinger L, Gobet A, Pommier T. Two decades of describing the unseen majority of aquatic microbial diversity. Molecular Ecology. 2012;21:1878–1896. doi: 10.1111/j.1365-294X.2011.05362.x. [DOI] [PubMed] [Google Scholar]
Associated Data
This section collects any data citations, data availability statements, or supplementary materials included in this article.
Supplementary Materials
Supplementary
Table S1 Sample name and associated characteristics. Longitudes and latitudes are provided in decimal degrees and sample depth in metres.
Table S2 Data set characteristics per ecosystem type and realm.
Fig. S1 Schematic representation of the analytical pipeline used to calculate TAR's and DDR's slope coefficients.
Fig. S2 Effect of the removal of rare taxa on data set characteristics in surface-sea waters (green, squares), deep-sea waters (blue, circles) and coastal sediments (orange, triangles): (a) number of nonempty, remaining samples, (b–d) pairwise geographic distances, (e–g) Average richness and percentage of remaining OTUs and sequences per samples, (h) Average OTU relative occupancy (average proportion of sites occupied by each OTU), (i) Proportion of OTUs detected in the smallest area, (j–l) Pairwise similarities between close (geographic distances <2000 km, left part of boxplots) and distant communities (geographic distances >12 000 km, right part of boxplots).
Fig. S3 Effect of the removal of rare taxa TAR (a) and DDR (b) slope coefficients and intercepts.
Fig. S4 Relationship between z and β obtained per realm/ecosystem type obtained with 1000 randomly resampling of 40 samples in the standardized presence/absence community tables.
Fig. S5 Distribution of Kendall τ correlation coefficients between z and β pairs obtained for each ecosystem type at each resampling step (green bars) and between z and permuted β values (grey bars) defined as a null distribution.
Data Availability Statement
DNA sequences and final community data: VAMPS, http://vamps.mbl.edu. Samples from the KCK_DSS_Bv6 project have been deposited on the GenBank Sequence Read Archive (www.ncbi.nlm.nih.gov; SRA046414.1).
Sample names and associated geographic coordinates or ecosystem type are uploaded as online supplemental material (Table S1).
r scripts used in this study are also uploaded as online supplemental material.
L.Z. and A.R. designed the study; L.Z. performed the analyses and wrote the first draft of the manuscript, and all authors contributed substantially to revisions.