The relationship of autophagy defects and cartilage damage during joint aging in a mouse model (original) (raw)
. Author manuscript; available in PMC: 2016 Jun 1.
Published in final edited form as: Arthritis Rheumatol. 2015 Jun;67(6):1568–1576. doi: 10.1002/art.39073
Abstract
Objectives
Aging is a main risk factor for osteoarthritis (OA), the most prevalent musculoskeletal disorder. Defects in autophagy, an essential cellular homeostasis mechanism, have recently been observed in OA articular cartilage. The objectives of this study were to establish the constitutive level of autophagy activation in normal cartilage and monitor the temporal relationship of changes in autophagy and aging-related cartilage degradation.
Methods
In GFP-LC3 transgenic mice, GFP-LC3 is ubiquitously expressed, and the accumulation of GFP puncta, representing autophagosomes, was quantified by confocal microscopy as a measure of autophagy activation. Expression of the autophagy proteins Atg5 and LC3 was analyzed by immunohistochemistry. Cartilage cellularity, apoptotic cell death and cartilage structural damage and changes in synovium and bone were examined by histology and immunohistochemistry.
Results
Basal autophagy activation was detected in young (6 months) mouse liver and knee articular cartilage, with higher levels in cartilage than in liver in the same animals. In aged 28 months old mice, there was a statistically significant reduction in the total number of autophagic vesicles per cell (P < 0.01) and in the total area of vesicles per cell (P < 0.01) compared to young 6 months old mice in articular cartilage. With increasing age, the expression of Atg5 and LC3 decreased, followed by a reduction in cartilage cellularity and an increase in the apoptosis marker PARP p85. Cartilage structural damage progressed in an age-dependent manner, subsequent to autophagy changes.
Conclusions
Autophagy is constitutively activated in normal cartilage. This is compromised with aging and precedes cartilage cell death and structural damage.
Keywords: Osteoarthritis, Aging, Chondrocytes, Autophagy
INTRODUCTION
Aging is a main risk factor for osteoarthritis (OA), the most prevalent joint disease (1, 2). The phenotype of aging-associated changes in both cartilage cells and extracellular matrix (ECM) has been characterized in detail (3). Cell density in cartilage decreases with aging, remaining cells express certain features of cellular senescence, produce reduced amounts of ECM and increased levels of matrix degrading enzymes and inflammatory mediators (3), Recent progress in understanding mechanisms related to cartilage cell aging includes the demonstration that chondrocytes are less responsive to anabolic stimuli and deficient in defenses against oxidative stress (4).
OA is a joint disease characterized by degradation of articular cartilage, synovial inflammation and changes in the subchondral bone (5). Articular cartilage appears to be more susceptible to aging-related damage as reflected in the early development of changes, the high prevalence of structural changes in the ECM and reduced cartilage cellularity (3). Chondrocytes, the only cell type in articular cartilage, are essential for the maintenance of the cartilage homeostasis (6). While oxidative stress-induced cell damage is a key mechanism in aging, cellular homeostasis mechanisms that maintain functional proteome and organelles have recently been shown to confer protection against aging-associated cell and organ changes and to prolong lifespan (7). Autophagy is catabolic self-digestion process that in most settings is a protective mechanism for the maintainance of cellular integrity by clearance of damaged macromolecules and organelles. Several forms of autophagy have been identified, including macroautophagy (usually referred to as autophagy), microautophagy and chaperone-mediated autophagy (8). In model organisms, defects in autophagy aggravate aging-associated changes while autophagy activation protects against age-related disease and extends lifespan (9).
The autophagy signaling pathway is activated in response to diverse types of cellular stress, including low nutrient levels or high energy demands (8). Autophagy is dependent on ~30 autophagy-related genes (ATG) and a key regulator of this process is the serine/threonine kinase mammalian target of rapamycin (mTOR) complex 1 (mTORC-1) (10). During autophagy, cellular constituents are enclosed in a double-membrane-containing vesicles called autophagosomes. The formation of autophagosomes is controlled by Atg proteins, including Atg12, Atg5 and microtubule-associated protein 1 light chain 3 (LC3). LC3 is present in two forms, LC3 I and LC3 II, which are localized in the cytosol (LC3-I) or in autophagosomal membranes (LC3-II), respectively. During autophagy, LC3 I is converted in LC3 II by conjugation of LC3 I to the membrane lipid phosphatidyl-ethanolamine, to form LC3 II, as a main autophagy marker. Then, the autophagosome fuses with the lysosome, where the degradation of the captured material occurs (8).
Aging cartilage from humans and mice shows a reduction in the expression of autophagy proteins (11). Mechanical injury to cartilage explants in vitro also suppressed autophagy proteins (12). Importantly, pharmacological activation of autophagy by mTORC1 inhibition reduced mechanical load-induced cartilage degradation in vitro (12) and in a surgically induced OA model in mice (13). These observations suggest that autophagy may promote joint health and protect against OA (6).
However, key questions concerning the level of autophagy activation in normal joints and the temporal relationship between autophagy defects, cell death and cartilage structural damage remain to be investigated. The objective of this study was to establish the patterns of autophagy activation in young and aging mouse cartilage. We used a transgenic GFP-LC3 reporter mouse model (14), which allows in situ monitoring of autophagy activation while simultaneously assessing protein levels of autophagy regulators. This is the first in vivo analysis of aging-associated basal autophagy changes in cartilage and their relationship to cell loss and joint tissue dama
MATERIALS AND METHODS
Mice and tissue collection
All animal experiments were performed according to protocols approved by the Institutional Animal Care and Use Committee at The Scripps Research Institute. Mice were housed in a temperature-controlled environment with 12-hour light/dark cycles, where they received food and water ad libitum. Reporter mice globally expressing green fluorescent protein (GFP) fused to light chain 3 (LC3) (GFP-LC3 transgenic mice) on C57BL/6J genetic background have been previously described (14) and were obtained from the RIKEN BioResource Center. Pathogen-free C57BL/6J mice were purchased from the Scripps breeding facility. Mice were sacrificed at various ages and liver and knee joints were collected for analysis. Male and female mice were included. Two sets of control mice were also assessed: young GFP-LC3–transgenic mice to provide a baseline for autophagy activity in liver and wild type C57BL/6 mice to determine the background level of green fluorescence.
A detailed protocol for tissue collection was previously described (15). Briefly, mice were perfused with Dulbecco’s Phosphate-Buffered Saline (DPBS), and tissue specimens were harvested and fixed using zinc-buffered formalin (Z-Fix; Anatech, Battle Creek, MI). Livers were washed with 1X PBS and stored in PBS at 4°C. Knee joints were decalcified in TBD-2 (Shandon, Pittsburgh, PA) for 12 hours on a shaker and then washed and stored in PBS at 4°C. Seventy-micrometer sections of liver and knee joints were cut with a Leica VT 1000 S vibratome.
Immunostaining of liver and joint vibratome sections
Free-floating vibratome-cut knee joint and liver sections were incubated with Hoechst 33342 (1:1000; Life Technologies, Carlsbad, CA) for 1 hour at room temperature to label nuclei and mounted with ProLong Gold antifade reagent (Life Technologies) for confocal microscopy. For localization of LC3, sections were permeabilized with 0.5% Triton X-100 for 2 hours at room temperature and incubated with anti-LC3 (1:5000; MBL) in PBS with 1% normal goat serum (NGS) and 0.3% Triton X-100 for 1h at RT and then at 4°C for 2 days on a vertical shaker (100 rpm). The sections were incubated with Alexa Fluor 568–conjugated goat anti-rabbit antibody (1:400) in PBS/0.3%Triton/1% NGS for 1 hour at room temperature. After incubation, the sections were washed and counterstained with Hoechst 33342 (1:1000; Life Technologies) for 1 hour at room temperature to label nuclei and mounted with ProLong Gold antifade reagent (Life Technologies) for confocal microscopy.
Quantitative imaging of autophagosome formation in GFP-LC3 transgenic mice
A detailed protocol for quantitative imaging has been previously described (15). Autophagosomes can be detected as discrete regions of high fluorescence, which allows quantification of not only the number of vesicles per cell but also their area, perimeter, feret, and circularity. Optical z series images were obtained using a Zeiss 780 laser scanning confocal microscope equipped with gallium arsenide phosphide detectors, running Zeiss Zen 2011 software (Zeiss Inc.). For reconstruction, all serial optical image sections were imported and spatially reassembled using Imaris software (Bitplane, South Windsor, CT) to generate a 3-dimensional representation of the tissue. All images were also imported into Image-Pro Plus software (Media Cybernetics, Rockville, MD) for quantitative image analysis.
Immunohistochemistry
Sections from paraffin-embedded joints were first deparaffinized in the xylene substitute Pro-Par Clearant (Anatech) and rehydrated in graded ethanol and water. Slides were cooled for 20 minutes at room temperature after antigen unmasking. After washing with PBS, sections were blocked with 5% serum for 30 minutes at room temperature. Atg5 antibody (Novus Biologicals, Littleton, CO, 1:500 dilution), LC3 antibody (MBL International, Woburn, MA, 1:1000) and PARP p85 (Promega, Madison, WI) were applied and incubated overnight at 4°C. After washing with PBS, sections were incubated with biotinylated goat anti-rabbit secondary antibody for 30 minutes at room temperature, and then incubated using Vectastain ABC-AP alkaline phosphatase (Vector Laboratories, Burlingame, CA) for 30 minutes. Specificity controls were obtained by replacing the primary antibody with non-immune rabbit immunoglobulin. Slides were washed, and sections were incubated with alkaline phosphatase substrate for 20–30 minutes.
Quantification of Atg5 and LC3-positive cells
In cartilage from young and old mouse knee joints, three pictures were taken under 40X magnification, showing the center of the femoral condyle that is not covered by the menisci as well as the medial and lateral femoral condyles (16). The total number of chondrocytes was counted and then the total number of Atg5 and LC3-positive cells was counted in each section. Results are expressed as the percentage of Atg5 and LC3-positive cells.
Cartilage cellularity
Knee joint sections were stained with Hematoxylin and Eosin. Three pictures were taken under 40X magnification, representing the center of the femoral condyle that is not covered by the menisci as well as the medial and lateral femoral condyles. Total number of cells in each section was counted.
Histological analysis of mouse knee joints
Knee joint serial sections (4 μm) were cut, stained with Safranin O fast green, and examined for histopathological changes in cartilage using a semiquantitative scoring system (17). In this system, the scores are defined as follows: 0=normal cartilage, 0.5=loss of proteoglycan with an intact surface, 1=superficial fibrillation without loss of cartilage, 2=vertical clefts and loss of surface lamina (any % or joint surface area), 3=vertical clefts/erosion to the calcified layer lesion for 1–25% of the quadrant width, 4=lesion reaches the calcified cartilage for 25–50% of the quadrant width, 5=lesion reaches the calcified cartilage for 50–75% of the quadrant width, 6=lesion reaches the calcified cartilage for >75% of the quadrant width.
Synovium was examined using a grading system for synovial inflammation (18). Three parameters, hyperplasia/enlargement of synovial lining cell layer, activation of resident cells/synovial stroma and inflammatory cell infiltration were graded as absent (grade 0), slight (grade 1), moderate (grade 2) or severe (grade 3).
Subchondral bone in mouse knee joints was examined using a grading system (17) that measures three parameters, subchondral bone thickening, number of trabeculae and osteophyte formation which were graded as normal (grade 0), mild (grade 1), moderate (grade 2) or severe (grade 3).
Statistical analysis
To evaluate normal distribution of the data, we performed the Kolmogorov-Smirnov test. Statistically significant differences between two groups were determined with unpaired Student’s t-test. Statistically significant differences between multiple comparisons were determined by ANOVA with Tukey’s multiple comparisons test. P values less tan 0.05 were considered significant.
RESULTS
Constitutive autophagy activation in cartilage and liver and aging-related changes
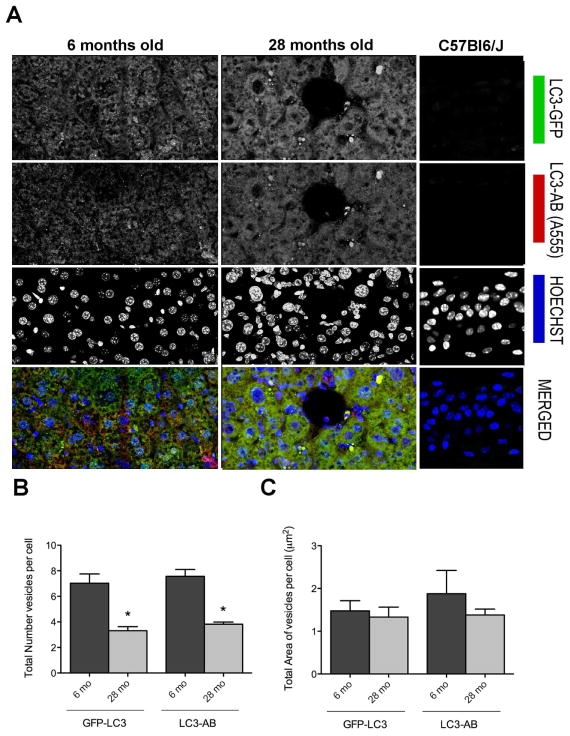
To determine whether there is constitutive activation in cartilage and potential age-related changes, we used GFP-LC3 transgenic mice (14). GFP-LC3 is ubiquitously expressed in these mice, and the accumulation of GFP puncta indicates the formation of autophagosomes, indicative of autophagy activation (19). We first analyzed liver as a comparator tissue in young (6 mo) and old mice (28 mo). Individual autophagosomes were detected as discrete regions of high fluorescence (Figure 1A). This was greater in young mice compared to old mice, indicating that the magnitude of autophagy activation was lower in old mice. The decrease in GFP-LC3 signal was significant as reflected by the total number of vesicles per cell (*p<0.01) and the total area of vesicles per cell (Figure 1B). Staining with anti-LC3 antibody showed very similar values, providing independent confirmation of the specificity and sensitivity of the transgenic GFP signal. Merged fluorescent images show many puncta in the cytoplasm, indicating that both GFP (green) fluorescence, which represents intrinsic signal and red fluorescence, which represents exogenously added LC3 antibody overlap.
Figure 1. Identification and quantification of autophagosomes in liver from young and old mice.
Vibratome-cut sections (70 μm) of mouse liver were prepared from GFP-LC3 transgenic mice, including young mice to assess constitutive autophagy activity and old mice to assess aging-related changes. Wild-type C57Bl/J mice were also included to determine the background level of green fluorescence. GFP-LC3 liver sections were stained anti-LC3 and with Hoechst 33342 to label nuclei and then analyzed by confocal microscopy. A, Representative images of GFP-LC3, LC3 and merged signal showing changes with aging. Original magnification: 63x. B, C, Quantitative analysis of vesicles (autophagosomes) in hepatocytes, including the total number of vesicles per cell and the total area of vesicles per cell. Values are the mean ± SEM of 5 mice per group.* P < 0.01 versus 6 month old mice.
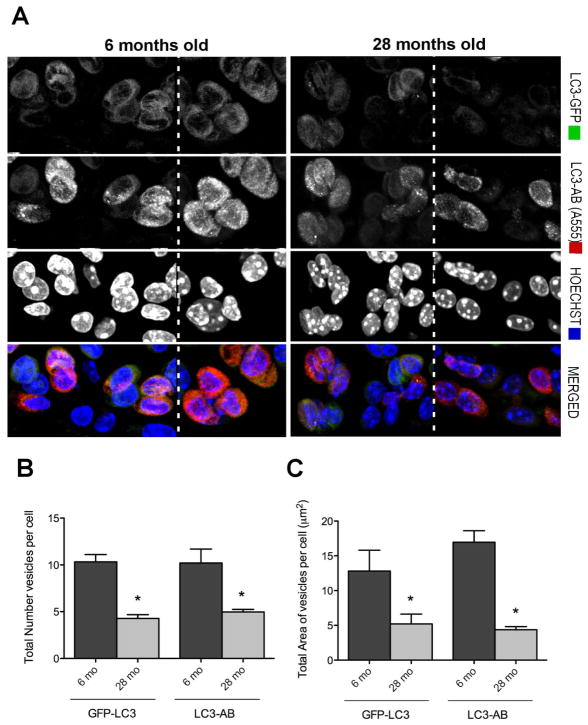
Analysis of autophagosome formation in cartilage from the knee joints based on the total number of vesicles per cell and the total area of vesicles per cell (μm2) indicated substantial levels of autophagy activation in normal young skeletally mature mice under physiological conditions (Figure 2A). Compared to hepatocytes, the number of vesicles was higher in chondrocytes and the area of autophagy vesicles was >5 fold greater. In chondrocytes from old mice, the number and area of autophagosomes was significantly decreased compared to young mice (mean ± SEM 4.28 ± 0.40 versus 10.33 ± 0.79 and 4.37 ± 0.44 versus 16.96 ± 1.65) respectively (*p<0.001) (Figure 2B). We also analyzed subchondral bone and found that the average number of vesicles in osteocytes decreased from 7.8 ± 0.31 in young to 3.1 ± 0.07 in old and the average vesicle size decreased from from 7.8 ± 0.3 μm in young to 2.6 ± 0.07 μm in old mice.
Figure 2. Autophagosomes in knee cartilage.
Vibratome-cut sagittal sections (70 μm) of mouse knee joints were stained with Hoechst 33342 to label nuclei or with anti-LC3 and then analyzed by confocal microscopy. A, Representative images of GFP-LC3 signal in response to aging. Images are from the mid zone of articular cartilage. Two representative images (separated by dotted lines) from young and old mice are shown. Original magnification: 63X. B, C, Quantitative analysis of vesicles (autophagosomes) in chondrocytes from the cartilage mid zone, including the total number of vesicles per cell and the total area of vesicles per cell. Values are the mean ± SEM of 5 mice per group. * = P < 0.001 versus 6 month mice.
To determine the patterns of autophagy activation in cartilage in different cartilage regions and zones, we evaluated the expression of GFP-LC3 in the entire tibial plateau. Serial and multipanel images obtained by confocal microscopy were mapped and stitched together to reconstruct the entire tibial plateau. The results indicated that the highest levels of GFP-LC3 signal were from chondrocytes in the superficial and upper mid zones of articular cartilage in young mice and a much lower signal in deep zone cells. Old mice showed lower levels of GFP-LC3 signal, indicating that the basal autophagy activation is reduced with aging (Figure 3).
Figure 3. Reconstruction of the entire tibial plateau and changes in the distribution of the GFP-LC3 signal in response to age.
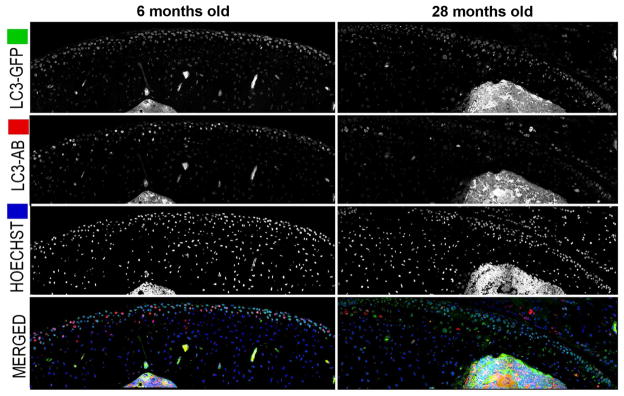
Vibratome-cut sagittal sections of knee joints from GFP-LC3 transgenic mice were prepared as described in Figure 1 and stained with Hoechst 33342 to or with anti-LC3. Representative images of GFP-LC3, LC3 and merged signal in response to age from cartilage knee joints are shown. Serial and multipanel optical image sections were spatially reassembled using Imaris software to generate a 3-dimensional representation of the tissue. Original magnification: 63X.
Aging-associated changes in autophagy proteins
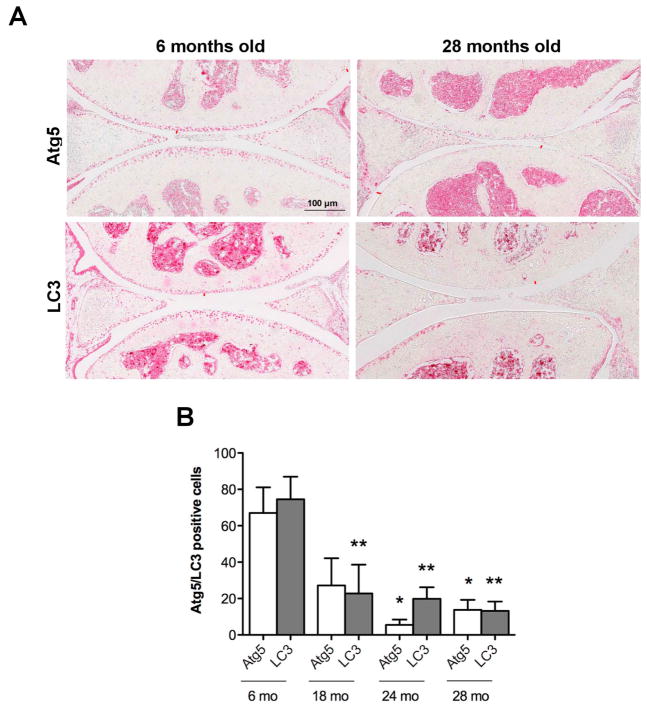
A potential mechanism to account for the observed aging-related reduction in autophagy activation was a reduced expression of autophagy proteins. To address this, immunohistochemistry was performed for Atg5, an autophagy regulator and LC3, an autophagy effector, in knee cartilage of mice at the ages of 6, 18, 24 and 28 months. Atg5 and LC3 were expressed most strongly in a majority of cells in the superficial and upper mid zone and much weaker in the deep zone of young cartilage (Figure 4A). The expression of Atg5 was already significantly (p< 0.01) reduced in 18 months old mice with only small and non-significant further decreases at 24 and 28 months. LC3 was significantly reduced at 24 and 28 months (Figure 4B). These findings indicate that key autophagy proteins are reduced with aging and importantly already at 18 months when cartilage structural defects are not yet apparent (see below).
Figure 4. Aging-associated changes in expression of autophagy proteins.
Knee joints sections from GFP-LC3 mice (n= 6) for each age (6, 18, 24 and 28 mo.) were analyzed by immunohistochemistry for Atg5 and LC3. Magnification 10x. Scale bar 100 μm. A, Representative images of knee joints stained with Atg5 and LC3 from 6 and 28 months old mice. B, Quantitative analysis of Atg5 and LC3-positive cells. Total cell number in three fields and Atg5 and LC3-positive cells were counted and the percentage of positive cells was calculated. Results show a significant decrease in Atg5 and LC3. Values are mean ± SEM. * = P < 0.01; ** = P < 0.01 versus 6 months old mouse knee joints.
Relationship between autophagy, cellularity and cell death
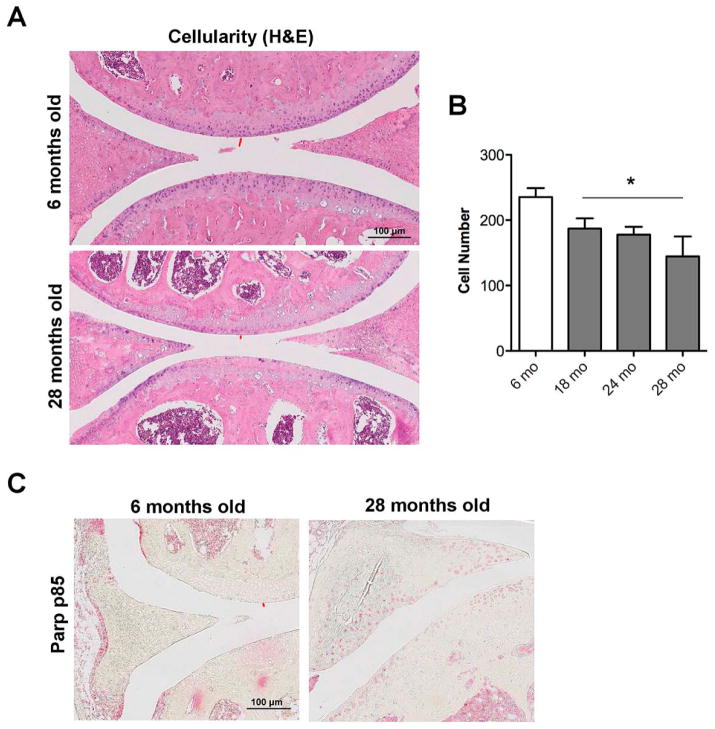
To address the cellular consequences of compromised autophagy in aging, cellularity and cell death were evaluated. An age-dependent reduction of cellularity was observed and this was already significant at 18 months (p<0.05) (Figure 5). In addition, apoptotic cell death was increased (Figure 5B). Together, these findings demonstrate that aging of mouse knee joints is associated with a reduction in autophagy along with a reduction in cellularity and an increase in cell death by apoptosis.
Figure 5. Changes in cartilage cellularity and cell death in response to aging.
A, Knee joint sections from GFP-LC3 mice (n= 6) for each age (6, 18, 24 and 28 months) were analyzed by Hematoxylin Eosin (H&E) staining and immunohistochemistry for Parp p85. Magnification 10x. Scale bar 100 μm. B, Quantitative analysis of cell numbers showed a significant decrease in cellularity in an age-dependent manner. Values are the mean ± SEM. * = P < 0.05 versus 6 months old mice.
Aging associated histopathological changes in joint tissues
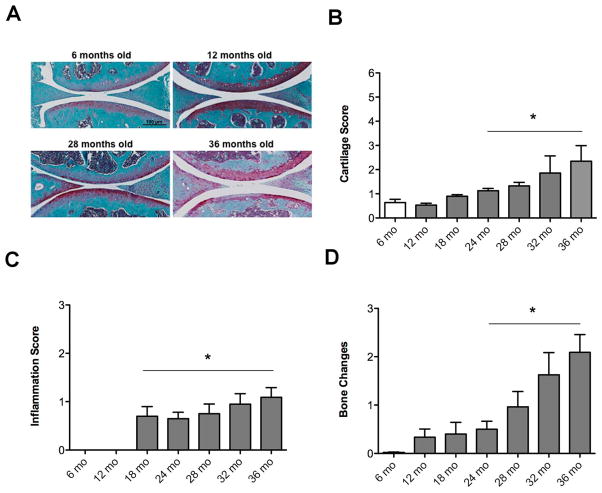
To determine the temporal relationship between autophagy defects and structural changes in GFP-LC3 transgenic mice, we performed histopathological analysis of knee joint tissues. Articular cartilage from 6 months old GFP-LC3 mice showed homogenous Safranin O staining in all zones, and intact surface. At 12 months, the articular cartilage showed some loss of safranin O with intact surface. The 28 month group exhibited proteoglycan depletion and small fibrilations and the 36 months old knee joints showed cartilage lesions with proteoglycan depletion, loss of surface lamina and fibrillations (Figure 6A). Analysis by a semiquantitative scoring system for cartilage lesions indicated a significant increase in the severity of the osteoarthritis-like changes in an age-dependent manner (p<0.05) (Figure 6B). Because OA is a whole-joint disorder, synovium and bone were also evaluated. The analysis of synovial inflammation and bone changes showed an increase in the severity in an age dependent manner (p<0.05) (Figure 6C, D).
Figure 6. Aging-associated histopathological changes in joint tissues.
Knee joints from GFP-LC3 mice at ages 6 months (n=11), 12 months (n= 8), 18 months (n= 5), 24 months (n=12), 28 months (n=26), 32 months (n=9) and 36 months (n=10) were analyzed. A, Representative images of knee joints stained with Safranin O. Magnification 10x. Scale bar 100 μm. B, Scoring of cartilage changes. Values are the mean ± SEM. * = P < 0.05 versus young mice (6 months). C, Scoring of synovial inflammation. Values are the mean ± SEM. * = P < 0.05 versus young mice (6 months). D, Scoring of bone changes. Values are the mean ± SEM. * = P < 0.05 versus young mice (6 months).
DISCUSSION
Autophagy is an essential cellular homeostasis mechanism that functions not only by adjusting to variations in nutrient supply but also, importantly, by removing dysfunctional organelles and macromolecules (20). Autophagy is a predominantly cytoprotective process (21) that has been demonstrated in multiple rodent models of organ damage affecting the liver (22), heart (23) and nervous system (24). Reduced autophagy has been associated with accelerated aging, whereas stimulation of autophagy has anti-aging effects and may promote longevity (25). Major manifestations of autophagy defects are cell dysfunction, which ranges from abnormal secretory profiles, including inflammatory mediators and similar to the senescence- associated secretory phenotype, to cell death (9). This cellular dysfunction leads to tissue and organ failure and manifests typically as aging-associated degenerative disease. Conversely, pharmacologic augmentation of autophagy protects against cell dysfunction and disease and, in model organisms, extends lifespan and health (26–28). We previously documented that joint aging in both humans and mice is associated with a reduced expression in autophagy regulators and an increase in cell death by apoptosis (11).
This study used GFP-LC3 transgenic reporter mice to provide the first in vivo analysis of basal autophagy in normal cartilage and to examine changes in response to aging. The results revealed a specific pattern of constitutive autophagy activation under physiological conditions in normal mouse joints with the highest levels of autophagosomes in the superficial and mid zones. The level of basal autophagy activation is higher in cartilage as compared to liver in the same animals. In old mice there is a significant reduction in the level of constitutive autophagy with a reduction in size and number of autophagosomes. The defect in autophagy is most profound in the superficial and upper middle zones where the earliest OA structural defects occur (29, 30). We also observed a similar aging-related decrease in the number and size of autophagosomes in subchondral bone. This defect in autophagy activation is at least in part due to reduced expression of some of the key autophagy proteins such as Atg 5 and LC3, which are essential for autophagosome formation. Several other autophagy genes, including ATG3, ATG12, ULK1, Beclin-1 and GABA(A)receptor-associated protein like 1 are also expressed at reduced levels in OA cartilage (31). Potential mechanisms for reduced levels of autophagy genes include abnormal expression and activation of FOXO transcription factors, which regulate expression of autophagy proteins (32). An additional mechanism that can contribute to the reduced autophagy is hyperactivation of mTOR. Zhang et al recently reported increased mTOR mRNA and protein expression in OA cartilage (31). Although there is at present no direct evidence for increased activation of mTOR in OA cartilage, it has been demonstrated that abnormal activation of mTOR can inhibit initiation of the autophagy signaling cascade and pharmacologic inhibition (13, 33) or genetic deletion (31) of mTOR reduces the severity of OA in mouse models. Furthermore, expression and activation of AMP activated protein kinase (AMPK) is reduced in OA cartilage (34). This kinase is a master regulator of energy homeostasis and is also induced by exercise and nutrient deprivation. Activated AMPK inhibits mTOR and direcly phosphorylates the autophagy inducer Ulk-1 (35). It has also been shown that AMPK activation induces autophagy in chondrocytes (36). Other mechanisms possibly contributing to the reduced expression of autophagy proteins include abnormal hypoxia signaling (37, 38). In this context, HIF-2α which is overexpressed in OA cartilage and contributes to the pathogenesis of OA (39, 40) prevents the HIF-1α mediated enhancement of autophagy (38).
The present study also aimed at investigating the temporal relationship between autophagy, aging, and cellular and structural changes in articular cartilage. We observed that the expression of autophagy markers declines with aging in the GFP-LC3 mouse joints. This reduction started to be apparent before the age of 18 months in our study. Previous reports in C57BL/6 mice found a reduction in autophagy between 9 and 12 months old mice (11). Together, these findings suggest that reduced autophagy proteins preceded the decrease in cartilage cellularity and the onset of structural damage. Furthermore, OA-like changes in synovium and bone also evolved subsequent to the autophagy changes. These results indicate that early changes in aging might occur in the cartilage due to a defect of autophagy, resulting in abnormal gene expression, cell senescence and extracellular matrix deficiencies. We hypothesize that agents preventing aging-related loss of autophagy might promote chondrocyte survival and cartilage biosynthetic capacity.
A potential limitation of this study is that male and female mice were included in the analysis. OA severity is greater in male than in female mice (41) and by using a mixture of both genders the present results presumably show less profound aging-related changes as would be observed in an analysis of only male mice. This notion is consistent with the later onset and reduced OA severity we observed here as compared to a study that used only male C57BL/6 mice (42).
In summary, the present study is the first in vivo analysis of basal autophagy activation in cartilage by using GFP-LC3 transgenic reporter mice. We also evaluated the temporal aging-related influence in autophagy activation and found downregulated expression of autophagy proteins in cartilage. We conclude that the mechanisms of aging-related OA are associated with decreased autophagy activity, which compromises cell and tissue homeostasis and contributes to the development of joint structural lesions.
Acknowledgments
This study was supported by National Institutes of Health grant AG007996 and the Sam and Rose Stein Endowment Fund. Beatriz Caramés was supported by Miguel Servet Program, Instituto de Salud Carlos III-CP11/00095.
Footnotes
The authors have no conflicts of interest.
Contributors ML had full access to all the data in the study and takes responsibility for the integrity of the data and the accuracy of the data analysis. Study design: ML, BC. Acquisition of data: BC, MO, WK. Analysis and interpretation of data: BC, MO, WK, ML. Manuscript preparation and approval: BC, WK, ML.
Competing interests None.
Ethics approval This study was conducted with the approval of the Institutional Animal Care and Use Committee at The Scripps Research Institute.
References
- 1.Murphy L, Schwartz TA, Helmick CG, Renner JB, Tudor G, Koch G, et al. Lifetime risk of symptomatic knee osteoarthritis. Arthritis Rheum. 2008;59:1207–13. doi: 10.1002/art.24021. [DOI] [PMC free article] [PubMed] [Google Scholar]
- 2.Zhang Y, Jordan JM. Epidemiology of osteoarthritis. Clin Geriatr Med. 2010;26:355–69. doi: 10.1016/j.cger.2010.03.001. [DOI] [PMC free article] [PubMed] [Google Scholar]
- 3.Lotz M, Loeser RF. Effects of aging on articular cartilage homeostasis. Bone. 2012;51:241–8. doi: 10.1016/j.bone.2012.03.023. [DOI] [PMC free article] [PubMed] [Google Scholar]
- 4.Yin W, Park JI, Loeser RF. Oxidative stress inhibits insulin-like growth factor-I induction of chondrocyte proteoglycan synthesis through differential regulation of phosphatidylinositol 3-Kinase-Akt and MEK-ERK MAPK signaling pathways. J Biol Chem. 2009;284:31972–81. doi: 10.1074/jbc.M109.056838. [DOI] [PMC free article] [PubMed] [Google Scholar]
- 5.Loeser RF, Goldring SR, Scanzello CR, Goldring MB. Osteoarthritis: a disease of the joint as an organ. Arthritis Rheum. 2012;64:1697–707. doi: 10.1002/art.34453. [DOI] [PMC free article] [PubMed] [Google Scholar]
- 6.Lotz MK, Carames B. Autophagy and cartilage homeostasis mechanisms in joint health, aging and OA. Nature reviews Rheumatology. 2011;7:579–87. doi: 10.1038/nrrheum.2011.109. [DOI] [PMC free article] [PubMed] [Google Scholar]
- 7.Morimoto RI, Cuervo AM. Proteostasis and the aging proteome in health and disease. J Gerontol A Biol Sci Med Sci. 2014;69 (Suppl 1):S33–8. doi: 10.1093/gerona/glu049. [DOI] [PMC free article] [PubMed] [Google Scholar]
- 8.Mizushima N. Physiological functions of autophagy. Curr Top Microbiol Immunol. 2009;335:71–84. doi: 10.1007/978-3-642-00302-8_3. [DOI] [PubMed] [Google Scholar]
- 9.Rubinsztein DC, Marino G, Kroemer G. Autophagy and aging. Cell. 2011;146:682–95. doi: 10.1016/j.cell.2011.07.030. [DOI] [PubMed] [Google Scholar]
- 10.Zhou H, Huang S. The complexes of mammalian target of rapamycin. Curr Protein Pept Sci. 2010;11:409–24. doi: 10.2174/138920310791824093. [DOI] [PMC free article] [PubMed] [Google Scholar]
- 11.Carames B, Taniguchi N, Otsuki S, Blanco FJ, Lotz M. Autophagy is a protective mechanism in normal cartilage, and its aging-related loss is linked with cell death and osteoarthritis. Arthritis Rheum. 2010;62:791–801. doi: 10.1002/art.27305. [DOI] [PMC free article] [PubMed] [Google Scholar]
- 12.Carames B, Taniguchi N, Seino D, Blanco FJ, D’Lima D, Lotz M. Mechanical injury suppresses autophagy regulators and pharmacologic activation of autophagy results in chondroprotection. Arthritis Rheum. 2012;64:1182–92. doi: 10.1002/art.33444. [DOI] [PMC free article] [PubMed] [Google Scholar]
- 13.Carames B, Hasegawa A, Taniguchi N, Miyaki S, Blanco FJ, Lotz M. Autophagy activation by rapamycin reduces severity of experimental osteoarthritis. Ann Rheum Dis. 2012;71:575–81. doi: 10.1136/annrheumdis-2011-200557. [DOI] [PMC free article] [PubMed] [Google Scholar]
- 14.Mizushima N, Yamamoto A, Matsui M, Yoshimori T, Ohsumi Y. In vivo analysis of autophagy in response to nutrient starvation using transgenic mice expressing a fluorescent autophagosome marker. Mol Biol Cell. 2004;15:1101–11. doi: 10.1091/mbc.E03-09-0704. [DOI] [PMC free article] [PubMed] [Google Scholar]
- 15.Alirezaei M, Kemball CC, Flynn CT, Wood MR, Whitton JL, Kiosses WB. Short-term fasting induces profound neuronal autophagy. Autophagy. 2010;6:702–10. doi: 10.4161/auto.6.6.12376. [DOI] [PMC free article] [PubMed] [Google Scholar]
- 16.Taniguchi N, Carames B, Ronfani L, Ulmer U, Komiya S, Bianchi ME, et al. Aging-related loss of the chromatin protein HMGB2 in articular cartilage is linked to reduced cellularity and osteoarthritis. Proc Natl Acad Sci U S A. 2009;106:1181–6. doi: 10.1073/pnas.0806062106. [DOI] [PMC free article] [PubMed] [Google Scholar]
- 17.Glasson SS, Chambers MG, Van Den Berg WB, Little CB. The OARSI histopathology initiative - recommendations for histological assessments of osteoarthritis in the mouse. Osteoarthritis Cartilage. 2010;18 (Suppl 3):S17–23. doi: 10.1016/j.joca.2010.05.025. [DOI] [PubMed] [Google Scholar]
- 18.Krenn V, Morawietz L, Haupl T, Neidel J, Petersen I, Konig A. Grading of chronic synovitis--a histopathological grading system for molecular and diagnostic pathology. Pathol Res Pract. 2002;198:317–25. doi: 10.1078/0344-0338-5710261. [DOI] [PubMed] [Google Scholar]
- 19.Mizushima N, Yoshimori T, Levine B. Methods in mammalian autophagy research. Cell. 2010;140:313–26. doi: 10.1016/j.cell.2010.01.028. [DOI] [PMC free article] [PubMed] [Google Scholar]
- 20.Vellai T, Takacs-Vellai K, Sass M, Klionsky DJ. The regulation of aging: does autophagy underlie longevity? Trends Cell Biol. 2009;19:487–94. doi: 10.1016/j.tcb.2009.07.007. [DOI] [PMC free article] [PubMed] [Google Scholar]
- 21.Kroemer G, Levine B. Autophagic cell death: the story of a misnomer. Nat Rev Mol Cell Biol. 2008;9:1004–10. doi: 10.1038/nrm2527. [DOI] [PMC free article] [PubMed] [Google Scholar]
- 22.Zhang C, Cuervo AM. Restoration of chaperone-mediated autophagy in aging liver improves cellular maintenance and hepatic function. Nat Med. 2008;14:959–65. doi: 10.1038/nm.1851. [DOI] [PMC free article] [PubMed] [Google Scholar]
- 23.Gottlieb RA, Mentzer RM. Autophagy during cardiac stress: joys and frustrations of autophagy. Annu Rev Physiol. 2010;72:45–59. doi: 10.1146/annurev-physiol-021909-135757. [DOI] [PMC free article] [PubMed] [Google Scholar]
- 24.Ravikumar B, Sarkar S, Davies JE, Futter M, Garcia-Arencibia M, Green-Thompson ZW, et al. Regulation of mammalian autophagy in physiology and pathophysiology. Physiol Rev. 2010;90:1383–435. doi: 10.1152/physrev.00030.2009. [DOI] [PubMed] [Google Scholar]
- 25.Madeo F, Tavernarakis N, Kroemer G. Can autophagy promote longevity? Nat Cell Biol. 2010;12:842–6. doi: 10.1038/ncb0910-842. [DOI] [PubMed] [Google Scholar]
- 26.Harrison DE, Strong R, Sharp ZD, Nelson JF, Astle CM, Flurkey K, et al. Rapamycin fed late in life extends lifespan in genetically heterogeneous mice. Nature. 2009;460:392–5. doi: 10.1038/nature08221. [DOI] [PMC free article] [PubMed] [Google Scholar]
- 27.Pan T, Rawal P, Wu Y, Xie W, Jankovic J, Le W. Rapamycin protects against rotenone-induced apoptosis through autophagy induction. Neuroscience. 2009;164:541–51. doi: 10.1016/j.neuroscience.2009.08.014. [DOI] [PubMed] [Google Scholar]
- 28.Spilman P, Podlutskaya N, Hart MJ, Debnath J, Gorostiza O, Bredesen D, et al. Inhibition of mTOR by rapamycin abolishes cognitive deficits and reduces amyloid-beta levels in a mouse model of Alzheimer’s disease. PLoS One. 2010;5:e9979. doi: 10.1371/journal.pone.0009979. [DOI] [PMC free article] [PubMed] [Google Scholar]
- 29.Hollander AP, Pidoux I, Reiner A, Rorabeck C, Bourne R, Poole AR. Damage to type II collagen in aging and osteoarthritis starts at the articular surface, originates around chondrocytes, and extends into the cartilage with progressive degeneration. J Clin Invest. 1995;96:2859–69. doi: 10.1172/JCI118357. [DOI] [PMC free article] [PubMed] [Google Scholar]
- 30.Nguyen QT, Wong BL, Chun J, Yoon YC, Talke FE, Sah RL. Macroscopic assessment of cartilage shear: effects of counter-surface roughness, synovial fluid lubricant, and compression offset. J Biomech. 2010;43:1787–93. doi: 10.1016/j.jbiomech.2010.02.014. [DOI] [PMC free article] [PubMed] [Google Scholar]
- 31.Zhang Y, Vasheghani F, Li YH, Blati M, Simeone K, Fahmi H, et al. Cartilage-specific deletion of mTOR upregulates autophagy and protects mice from osteoarthritis. Ann Rheum Dis. 2014 doi: 10.1136/annrheumdis-2013-204599. [DOI] [PubMed] [Google Scholar]
- 32.Akasaki Y, Hasegawa A, Saito M, Asahara H, Iwamoto Y, Lotz MK. Dysregulated FOXO transcription factors in articular cartilage in aging and osteoarthritis. Osteoarthritis Cartilage. 2014;22:162–70. doi: 10.1016/j.joca.2013.11.004. [DOI] [PMC free article] [PubMed] [Google Scholar]
- 33.Matsuzaki T, Matsushita T, Tabata Y, Saito T, Matsumoto T, Nagai K, et al. Intra-articular administration of gelatin hydrogels incorporating rapamycin-micelles reduces the development of experimental osteoarthritis in a murine model. Biomaterials. 2014;35:9904–11. doi: 10.1016/j.biomaterials.2014.08.041. [DOI] [PubMed] [Google Scholar]
- 34.Terkeltaub R, Yang B, Lotz M, Liu-Bryan R. Chondrocyte AMP-activated protein kinase activity suppresses matrix degradation responses to proinflammatory cytokines interleukin-1beta and tumor necrosis factor alpha. Arthritis Rheum. 2011;63:1928–37. doi: 10.1002/art.30333. [DOI] [PMC free article] [PubMed] [Google Scholar]
- 35.Viollet B, Horman S, Leclerc J, Lantier L, Foretz M, Billaud M, et al. AMPK inhibition in health and disease. Crit Rev Biochem Mol Biol. 2010;45:276–95. doi: 10.3109/10409238.2010.488215. [DOI] [PMC free article] [PubMed] [Google Scholar]
- 36.Bohensky J, Leshinsky S, Srinivas V, Shapiro IM. Chondrocyte autophagy is stimulated by HIF-1 dependent AMPK activation and mTOR suppression. Pediatr Nephrol. 2010;25:633–42. doi: 10.1007/s00467-009-1310-y. [DOI] [PMC free article] [PubMed] [Google Scholar]
- 37.Bohensky J, Shapiro IM, Leshinsky S, Terkhorn SP, Adams CS, Srinivas V. HIF-1 regulation of chondrocyte apoptosis: induction of the autophagic pathway. Autophagy. 2007;3:207–14. doi: 10.4161/auto.3708. [DOI] [PubMed] [Google Scholar]
- 38.Bohensky J, Terkhorn SP, Freeman TA, Adams CS, Garcia JA, Shapiro IM, et al. Regulation of autophagy in human and murine cartilage: hypoxia-inducible factor 2 suppresses chondrocyte autophagy. Arthritis Rheum. 2009;60:1406–15. doi: 10.1002/art.24444. [DOI] [PMC free article] [PubMed] [Google Scholar]
- 39.Saito T, Fukai A, Mabuchi A, Ikeda T, Yano F, Ohba S, et al. Transcriptional regulation of endochondral ossification by HIF-2alpha during skeletal growth and osteoarthritis development. Nat Med. 2010;16:678–86. doi: 10.1038/nm.2146. [DOI] [PubMed] [Google Scholar]
- 40.Yang S, Kim J, Ryu JH, Oh H, Chun CH, Kim BJ, et al. Hypoxia-inducible factor-2alpha is a catabolic regulator of osteoarthritic cartilage destruction. Nat Med. 2010;16:687–93. doi: 10.1038/nm.2153. [DOI] [PubMed] [Google Scholar]
- 41.Mahr S, Menard J, Krenn V, Muller B. Sexual dimorphism in the osteoarthritis of STR/ort mice may be linked to articular cytokines. Ann Rheum Dis. 2003;62:1234–7. doi: 10.1136/ard.2002.005041. [DOI] [PMC free article] [PubMed] [Google Scholar]
- 42.McNulty MA, Loeser RF, Davey C, Callahan MF, Ferguson CM, Carlson CS. Histopathology of naturally occurring and surgically induced osteoarthritis in mice. Osteoarthritis Cartilage. 2012;20:949–56. doi: 10.1016/j.joca.2012.05.001. [DOI] [PMC free article] [PubMed] [Google Scholar]
