Prognostic Impact of the Combination of Recurrence Score and Quantitative Estrogen Receptor Expression (ESR1) on Predicting Late Distant Recurrence Risk in Estrogen Receptor–Positive Breast Cancer After 5 Years of Tamoxifen: Results From NRG Oncology/National Surgical Adjuvant Breast and Bowel Project B-28 and B-14 (original) (raw)
Abstract
Purpose
We determined the utility of the 21-Gene Recurrence Score (RS) in predicting late (> 5 years) distant recurrence (LDR) in stage I and II breast cancer within high and low-_ESR1_–expressing groups.
Patients and Methods
RS was assessed in chemotherapy/tamoxifen-treated, estrogen receptor (ER) –positive, node-positive National Surgical Adjuvant Breast and Bowel Project B-28 patients and tamoxifen-treated, ER-positive, node-negative B-14 patients. The association of the RS with risk of distant recurrence (DR) 0 to 5 years and those at risk > 5 years was assessed. An ESR1 expression cut point was optimized in B-28 and tested in B-14.
Results
Median follow-up was 11.2 years for B-28 and 13.9 years for B-14. Of 1,065 B-28 patients, 36% had low (< 18), 34% intermediate (18 to 30), and 30% high (≥ 31) RS. Of 668 B-14 patients, 51% had low, 22% intermediate, and 27% high RS. Median _ESR1_ expression by reverse transcriptase polymerase chain reaction was: B-28, 9.7 normalized expression cycle threshold units (CT) and B-14, 10.7 CT. In B-28, RS was associated with DR 0 to 5 years (log-rank _P_ < .001) and > 5 to 10 years (log-rank P = .02) regardless of ESR1 expression. An ESR1 expression cut point of 9.1 CT was identified in B-28. It was validated in B-14 patients for whom the RS was associated with DR in years 5 to 15: 6.8% (95% CI, 4.4% to 10.6%) versus 11.2% (95% CI, 6.2% to 19.9%) versus 16.4% (95% CI, 10.2% to 25.7%) for RS < 18, RS 18 to 30, and RS ≥ 31, respectively (log-rank P = .01).
Conclusion
For LDR, RS is strongly prognostic in patients with higher quantitative ESR1. Risk of LDR is relatively low for patients with low RS. These results suggest the value of extended tamoxifen therapy merits evaluation in patients with intermediate and high RS with higher ESR1 expression at initial diagnosis.
INTRODUCTION
Estrogen receptor (ER) –positive breast cancer shows a protracted risk of recurrence, with approximately 50% of recurrences occurring after 5 years (late distant recurrence, LDR) in contrast to ER-negative breast cancer, which recurs primarily within the first 5 years.1-4 ER-positive breast cancers at the greatest risk of LDR have been shown to have both high ER and high proliferation gene expression.5 In ER-positive breast cancer, after 5 years of endocrine therapy, this time-dependent association between higher ER/ER-related gene expression, higher proliferation gene expression, and LDR was recently confirmed using quantitative assessments of ER and proliferation gene expression.6
This association is clinically relevant. Five years of adjuvant tamoxifen substantially reduces recurrence rates for at least 15 years after diagnosis.1 National Surgical Adjuvant Breast and Bowel Project (NSABP) B-14 evaluated 5 versus 10 years of tamoxifen and suggested that > 5 years of tamoxifen was not warranted, as patients treated with an additional 5 years of tamoxifen fared worse than those who received placebo.7 In contrast, the ATLAS (Adjuvant Tamoxifen Longer Against Shorter) and aTTom (Adjuvant Tamoxifen—To Offer More?) trials showed that 10 years of tamoxifen significantly reduces risk of recurrence and breast cancer mortality compared with 5 years of treatment.8,9 NCIC Clinical Trials Group MA17 also demonstrated that extended endocrine therapy with letrozole improves outcomes in postmenopausal patients with hormone receptor–positive breast cancer after 5 years of tamoxifen.10 ASCO guidelines now recommend an extended 5 years of tamoxifen.11 Although studies have shown that select clinicopathologic factors are associated with higher risk of LDR (eg, lymph node–positive disease or larger-sized tumors), there remains an unmet clinical need to more accurately identify ER-positive patients at greater risk of LDR given the adverse effects of extended hormone therapy.12,13 Molecular assays may help identify patients who will benefit from prolonged hormonal therapy.6,14-16 For hormone receptor–positive, early-stage breast cancer, the 21-Gene Recurrence Score assay (RS) is a widely used predictor of 10-year risk of DR17-22 and of the likely benefit of adjuvant chemotherapy.18,19 Individually reported quantitative estrogen receptor mRNA level (ESR1) is also a strong continuous predictor of tamoxifen benefit.23,24 The findings of Dowsett et al6 suggest that results of the RS assay may be useful in the prediction of LDR. Thus, the objective of this study was to determine if the RS can identify a group of patients with breast cancer who are at low risk for LDR and to determine if this relationship is dependent on levels of quantitative ESR1 expression.
PATIENTS AND METHODS
Studies and Patients
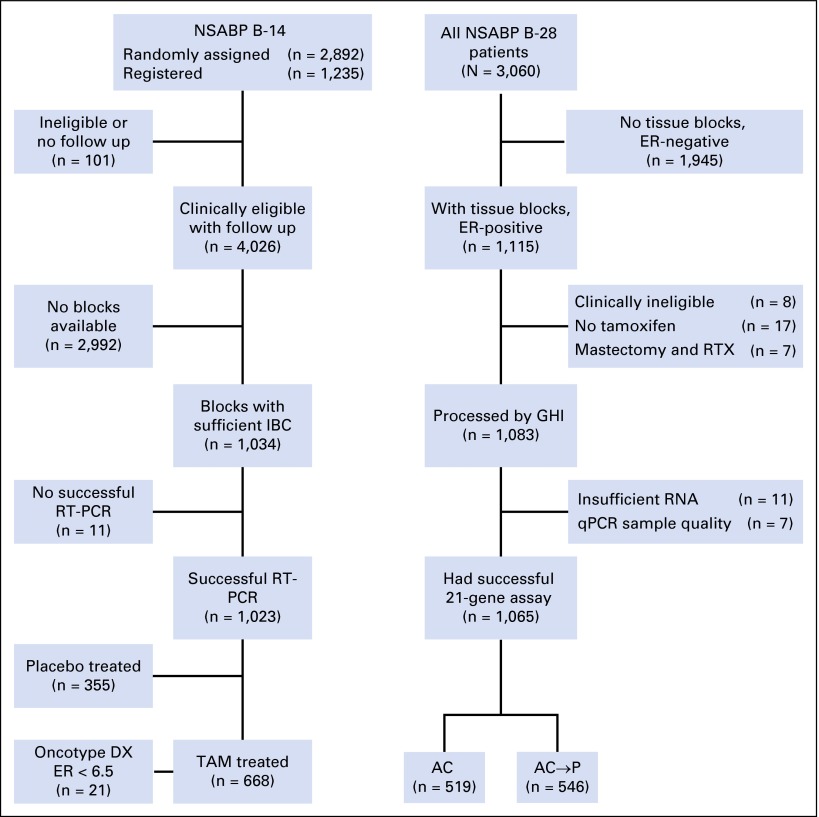
Included were patients with RS information from NSABP B-14 (tamoxifen-only arm) and B-2817,22 (Fig 1). B-14 compared placebo or tamoxifen (N = 2,892). The RS study included 668 ER-positive, tamoxifen-treated patients.7,25,26 Median follow-up was 13.9 years. B-28 compared doxorubicin plus cyclophosphamide (AC; 4 cycles) with four cycles of AC followed by four cycles of paclitaxel (N = 3,060) with 5 years of tamoxifen for hormone receptor–positive patients.27 The RS study included 1,065 ER-positive, tamoxifen-treated patients. Median follow-up was 11.2 years. RS and quantitative ESR1 methodology were previously described.17,28 Participating institutions obtained approval from their human investigations committee or institutional review board and filed assurances with the Department of Health and Human Services. Written informed consent was required for enrollment.
Fig 1.
CONSORT diagram. AC, doxorubicin plus cyclophosphamide; AC→P, doxorubicin plus cyclophosphamide followed by paclitaxel; ER, estrogen receptor; GHI, Genomic Health, Inc.; IBC, invasive breast cancer; NSABP, National Surgical Adjuvant Breast and Bowel Project; qPCR, quantitative polymerase chain reaction; RT-PCR, reverse transcriptase polymerase chain reaction; RTX, radiotherapy; TAM, tamoxifen.
Statistical Analysis and Study End Points
The primary end point was distant recurrence-free interval, defined as time from study entry to first distant recurrence (DR), with contralateral breast cancer or non–breast second primary cancers ignored (B-28) or treated as censoring events (B-14), and death or loss to follow-up treated as a censoring event. Patients were grouped into low-RS (< 18), intermediate-RS (18 to 30), and high-RS (≥ 31) groups. The association between RS and DR by time period (0 to 5 years, > 5 years) was determined for all patients in B-28 and B-14 using Kaplan-Meier estimates and log-rank tests for the RS risk groups and Cox proportional hazards models for the continuous RS.
The development stage used B-28 to establish the ESR1 mRNA expression cut point at a natural quantile of the distribution on the basis of the hazard ratio (HR) for the RS association with LDR risk (> 5 years) in high-_ESR1_–expressing patients, on the basis of Cox models with time-dependent effects. Subsequently, the cut point was independently tested in B-14. Analyses were conducted to determine the robustness of the results to the specific cut point given patient characteristic differences between the two studies. Kaplan-Meier estimates and log-rank tests were used to evaluate outcomes in the RS groups by time period (0 to 5 years, > 5 years) and ESR1 expression level (lower or higher ESR1 expression on the basis of the B-28 optimized cut point).
Log-rank statistics for 0 to 5 years are based on all data up to 5 years with administrative censoring at 5 years. Log-rank statistics after 5 years are based on all patients who were DR-free at 5 years and followed for recurrence after 5 years. Cox models assessed the association strength between the continuous RS and DR risk by time period and ESR1 level. Model diagnostics were performed, and alternative functional forms were considered for the association of the RS with LDR risk in high-ESR1 expressors, including natural spline models (two degrees of freedom) and quadratic models on log-hazard scale. Multivariable Cox proportional hazards models examined whether RS provides independent prognostic information for LDR in higher-_ESR1_–expressing patients. Cox model HRs for the RS are estimated for a 50-point difference, CIs use the Wald method, and P values are based on likelihood ratio tests. Statistical significance used a P value ≤ .05. NSABP and Genomic Health Inc conducted analyses jointly.
RESULTS
Patient Characteristics
There were 1,065 ER-positive patients in NSABP B-28 and 668 tamoxifen-treated ER-positive patients in B-14 with sufficient tissue for RNA extraction and the RS assay. Patient characteristics were described previously.17,22 Clinicopathologic characteristics are summarized in Appendix Table A1 (online only).
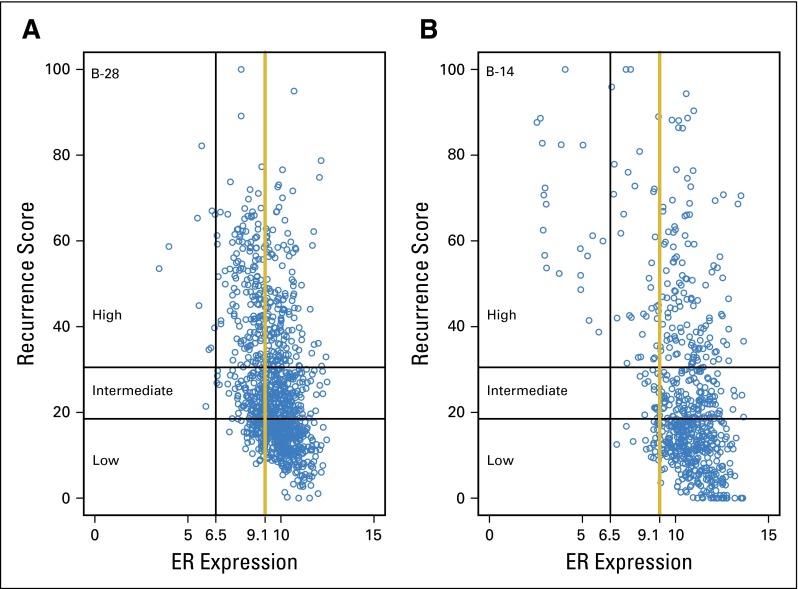
Of B-28 patients, 36% had low (< 18), 34% intermediate (18 to 30), and 30% high (≥ 31) RS results. Of B-14 patients, 51% had low, 22% intermediate, and 27% high RS results. The mean (standard deviation) reference normalized expression cycle threshold (CT) levels for ESR1 were 9.6 (1.2) in B-28 and 10.5 (1.7) in B-14. The association between the continuous RS and ESR1 in each study is shown in Appendix Figure A1 (online only). Although there was a shift toward higher ESR1 in B-14 compared with B-28, the association between the RS and ESR1 level was similar in both studies.
Late Recurrence Events
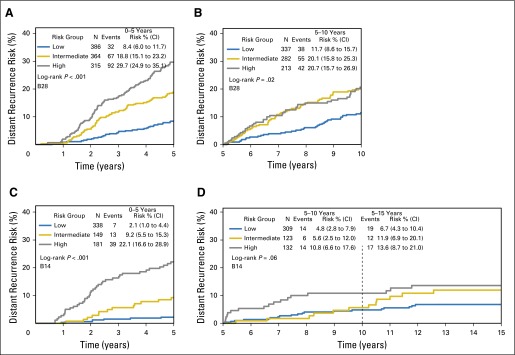
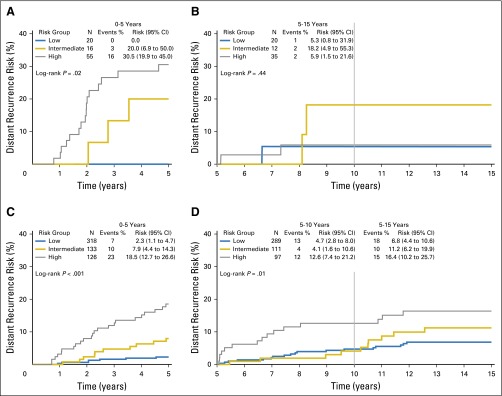
In B-28, of 359 DR events, 168 (47%) occurred after 5 years. In B-14, of 109 DR events, 50 (46%) occurred after 5 years. Previous studies demonstrated the association between the RS and cumulative risk of recurrence over 10 years for both studies.17,22 When divided by early DR or LDR, in B-28, the RS risk groups were prognostic for both early (0 to 5 years, log-rank P < .001) and late (> 5 years, log-rank P = .02) DR risk (Figs 2A and 2B). In B-14, RS risk groups were prognostic for early DR risk (LDR not statistically significant [log-rank _P_ = .06; Figs 2C and 2D]).
Fig 2.
Kaplan-Meier curves and estimates for distant recurrence risk in B-28 and B-14 by recurrence score risk groups and time period. Event counts are for those occurring within the time period shown. (A) Curves for B-28, 0 to 5 years; (B) curves for B-28, 5 to 10 years; (C) curves for B-14, 0 to 5 years; (D) curves for B-14, 5 to 15 years.
ESR1 Cut Point Selection in B-28
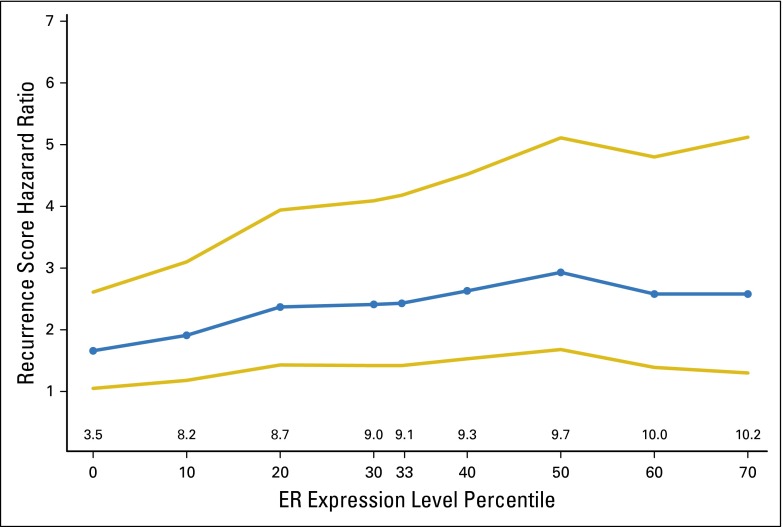
B-28 was used to establish a quantitative ESR1 expression cut point identifying a subgroup for which the RS predicted LDR. A range of cut points were evaluated based on the HR for the association of the continuous RS with LDR (Appendix Fig A2, online only). The first tertile (9.1 CT units) was selected as the cut point to test for strength and precision of the HR estimate and to determine the size of the higher-_ESR1_–expressing patient population. HR estimates were robust to cut point choice, and the lower limit of the CI for the RS HR was above 1.0 for cut point values near 9.1. The association strength and CI width increased gradually with increasing values of the cut point above 9.1. For all subsequent results, higher ESR1 expression is defined as expression > 9.1 CT cut point.
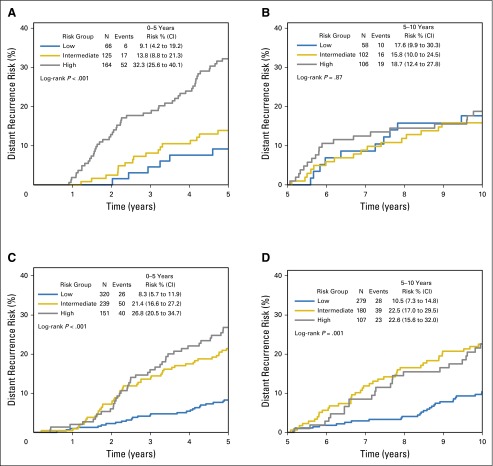
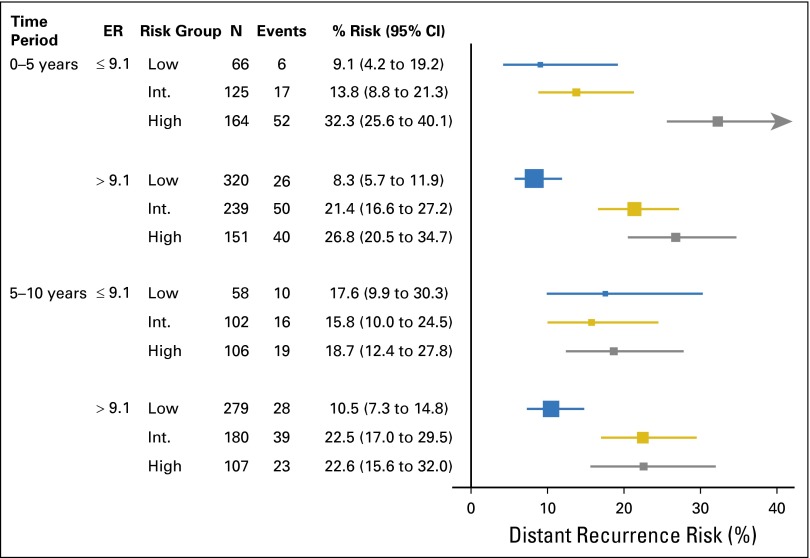
Within the B-28 cohort, RS was associated with DR risk up to 5 years in lower and higher ESR1 expression (Fig 3; Table 1; Appendix Fig A3, online only). After 5 years, the RS was associated with DR only in the higher-_ESR1_–expressing patients (log-rank P = .001 for RS risk groups) but not in the lower-_ESR1_–expressing patients (log-rank P = .87). In years 5 to 10, for higher-_ESR1_–expressing patients, the DR risks were 10.5% (95% CI, 7.3% to 14.8%) in low-RS, 22.5% (17.0% to 29.5%) in intermediate-RS, and 22.6% (15.6% to 32.0%) in the high-RS group.
Fig 3.
Kaplan-Meier curves and estimates for distant recurrence risk in B-28 by recurrence score risk groups, ESR1 expression level, and time period. (A) Curves for ESR1 ≤ 9.1, time 0 to 5 years; (B) curves for ESR1 ≤ 9.1, time 5 to 10 years; (C) curves for ESR1 > 9.1, time 0 to 5 years; (D) curves for ESR1 > 9.1, time 5 to 10 years.
Table 1.
Association of the Continuous Recurrence Score With Distant Recurrence Risk From 0 to 5 Years and After 5 Years According to ESR1 Expression in B-28 and B-14, on the Basis of Cox Proportional Hazards Models
| ESR1 Expression Group | 0 to 5 Years | After 5 Years | ||||||
|---|---|---|---|---|---|---|---|---|
| No. | Events | HR (95% CI)* | P* | No.† | Events | HR (95% CI)* | P* | |
| NSABP B-28 ER-positive patients (n = 1,065) | ||||||||
| All patients | 1,065 | 191 | 4.22 (2.93 to 6.07) | < .001 | 832 | 168 | 1.66 (1.05 to 2.61) | .04 |
| ESR1 ≤ 9.1 | 355 | 75 | 5.86 (3.18 to 10.80) | < .001 | 266 | 52 | 0.85 (0.36 to 2.00) | .70 |
| ESR1 > 9.1 | 710 | 116 | 3.46 (2.09 to 5.71) | < .001 | 566 | 116 | 2.43 (1.42 to 4.18) | .003 |
| NSABP B-14 tamoxifen-treated patients (n = 668) | ||||||||
| All patients | 668 | 59 | 6.04 (3.88 to 9.41) | < .001 | 564 | 50 | 1.55 (0.81 to 2.97) | .20 |
| ESR1 ≤ 9.1 | 91 | 19 | 4.29 (1.86 to 9.89) | < .001 | 67 | 6 | 0.21 (0.02 to 2.33) | .14 |
| ESR1 > 9.1 | 577 | 40 | 5.85 (3.23 to 10.60) | < .001 | 497 | 44 | 2.23 (1.11 to 4.47) | .04 |
Cox models for DR were fit with terms for the continuous RS, time period, _ESR1_-expression group, and the two- and three-way interactions among them. Interaction tests were conducted as secondary analyses on the basis of these models and were not the basis for cut point selection. The association between RS and LDR risk differed between lower- and higher-_ESR1_–expression groups, with a statistically significant two-way interaction between the RS and _ESR1_-expression group after 5 years (P = .04). The corresponding interaction term was not significant for early events (0 to 5 years, P = .19). In an analysis restricted to late events, the interaction term among ESR1(> 9.1 v < 9.1) and RS, indicating effect modification on the basis of an ESR1 threshold at 9.1 after 5 years, remained statistically significant after adjusting for clinical and pathologic characteristics (P = .02).
ESR1 Expression Cut Point Testing in B-14
The 9.1 CT cut point for ESR1 expression was subsequently tested independently in the B-14 data set. Because the distribution of ESR1 in B-14 was higher than B-28, the 9.1 CT cut point was the 14th percentile in B-14, such that 86% of patients were in the higher ESR1 group.
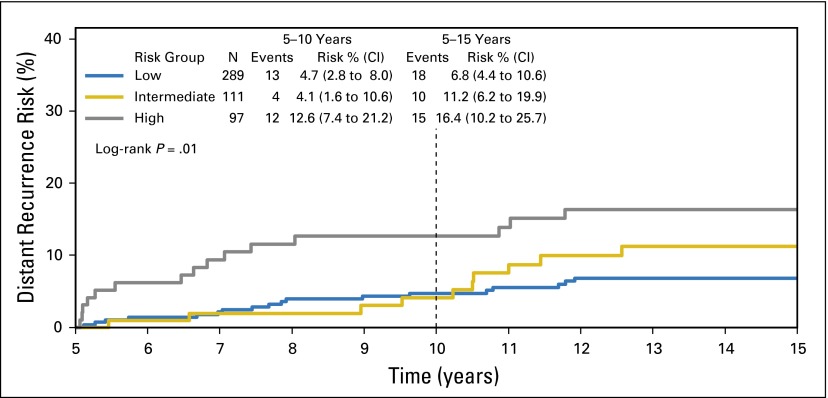
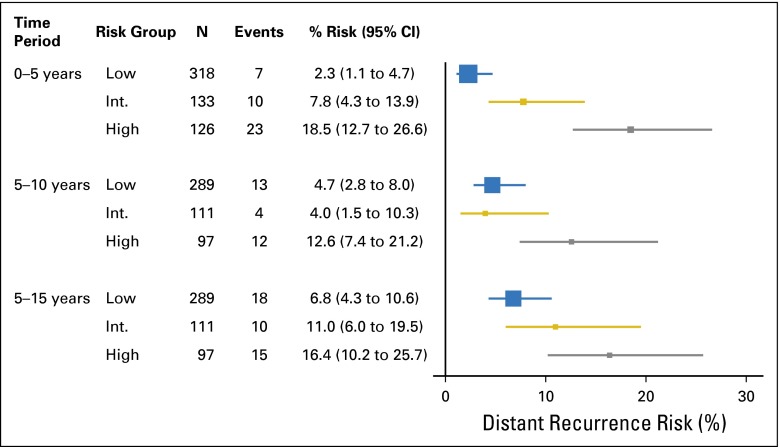
Among the higher-_ESR1_–expressing patients, the RS was a significant predictor of DR after 5 years (log-rank P = .01), confirming the B-28 results (Fig 4; Table 1). In years 5 to 10, for higher-_ESR1_–expressing patients, DR risks were 4.7% (2.8% to 8.0%) in the low, 4.1% (1.6% to 10.6%) in the intermediate, and 12.6% (7.4% to 21.2%) in the high-RS group. In years 5 to 15, for higher-_ESR1_–expressing patients, the DR risks were 6.8% (4.4% to 10.6%) in the low, 11.2% (6.2% to 19.9%) in the intermediate, and 16.4% (10.2% to 25.7%) in the high-RS group (Appendix Figs A4 and A5, online only).
Fig 4.
Kaplan-Meier curves and estimates for distant recurrence risk over 5 to 15 years, by recurrence score risk groups, in high-_ESR1_–expressing patients in B-14.
Similar to B-28 results, RS was associated with DR risk before 5 years regardless of ESR1 expression level in B-14 (Table 1; Appendix Fig A4, online only). In B-14 there were few events after 5 years among the lower-_ESR1_–expressing patients, with most events occurring before 5 years in the high-RS patients with lower ESR1.
Cox model interaction tests were conducted as secondary analyses. The association between RS and LDR risk differed between lower- and higher-ESR1 groups for late events (two-way interaction, P = .03). There was no statistical evidence of a two-way interaction for early events (0 to 5 years, P = .35). The significant interaction for late events persisted after adjustment for covariates (P = .01).
After successfully testing the a priori–determined 9.1 cut point, sensitivity analyses determined the robustness of the results to the specific ESR1 cut point value. The RS HR was nearly constant for cut points between 8.7 and 9.7 (2.17 and 2.23), and the lower limit of the 95% CI excluded 1.0 for cut points 8.2 to 10.7. Successful testing of the established cut point was not overly sensitive to the specific value used. The HRs and CI widths increased gradually with increasing cut point values above 9.7, as the higher ESR1 sample size decreased.
Subgroup Analyses
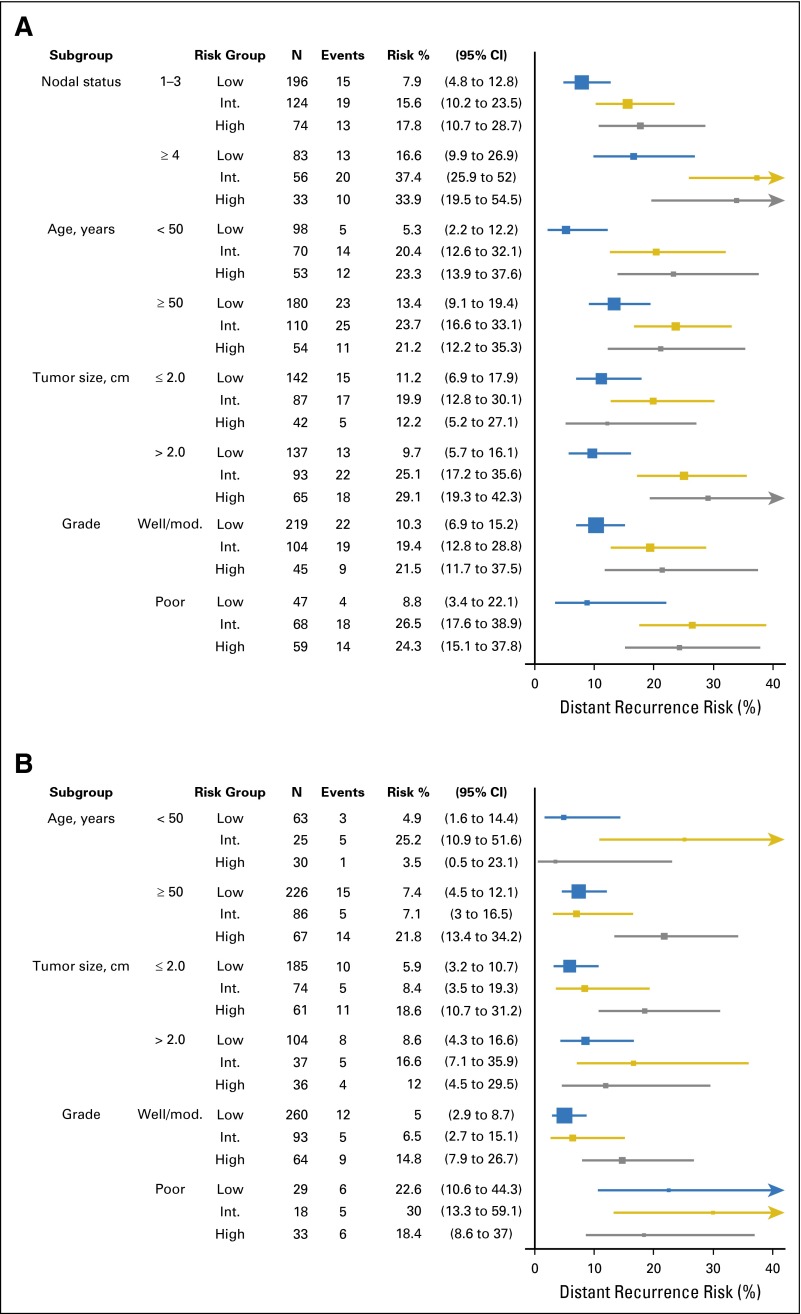
In B-28 and B-14, the RS risk groups’ association with LDR risk for higher-_ESR1_–expressing patients was explored within subgroups according to clinicopathologic characteristics. This association was consistent with the overall results (Fig 5). In B-28, one to three positive nodes had a lower LDR risk compared with four or more positive nodes (Appendix Table A2, online only). In patients with a low RS, the risk of DR between 5 and 10 years was 7.9% (4.8% to 12.8%) in patients with one to three positive nodes, compared with 16.7% (10.0% to 27.0%) in patients with four or more positive nodes. For _ERBB2_-negative or equivocal patients, including n = 937 (88.0%) in B-28 and n = 594 (88.9%) in B-14, the association of the RS with LDR risk in higher-_ESR1_–expressing patients was similar to the overall results (data not shown).
Fig 5.
Forest plots with Kaplan-Meier estimates and 95% CIs for the risk of distant recurrence after 5 years by recurrence score risk group in high-_ESR1_–expressing patients, in (A) B-28 (from 5 to 10 years) and (B) B-14 (from 5 to 15 years), within subgroups according to clinical and pathology characteristics. Int, intermediate; Mod, moderate
Functional Form Assessment
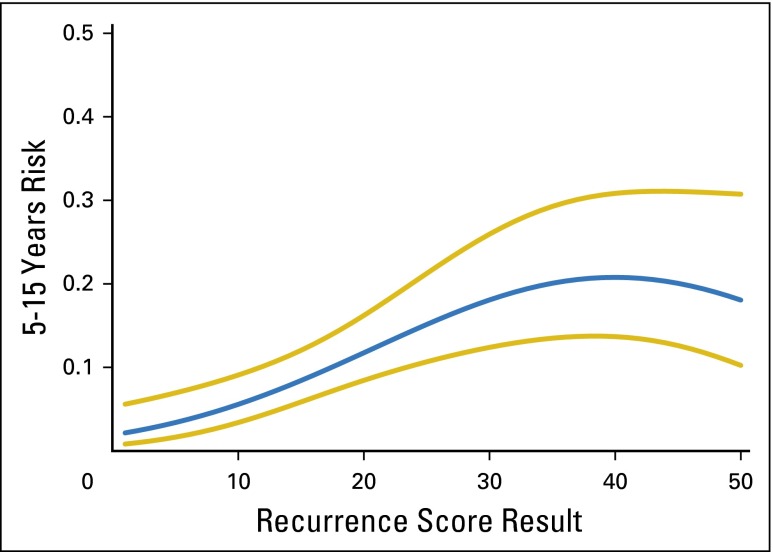
Alternative functional forms for the association of the RS with LDR risk in high-_ESR1_–expressing patients were explored in B-14 and B-28. In B-28, the linear model provided a good fit. In B-14, a better fit was provided by a quadratic model (P < .001 for association of the RS with DR risk; P < .001 for the test of whether the additional quadratic term provided a better fit than a linear term alone).23 Appendix Figure A6 (online only) shows the estimated association between the RS and LDR risk in high-_ESR1_–expressing patients.
Multivariable Models
In B-28, only nodes (P ≤ .001) and continuous RS (P = .004) were significant predictors of LDR in higher-_ESR1_–expressing patients in a multivariable model adjusting for nodes, size, age, grade, surgery type, and treatment (Appendix Table A2, online only). In B-14, only central grade (P = .003) and continuous RS (P = .005; quadratic model, which provided a significantly better fit) were significant predictors of LDR in higher-_ESR1_–expressing patients in a multivariable model after adjustment for age, size, and grade (Appendix Table A3, online only).23
In B-14, patients completing 5 years of tamoxifen were randomly assigned to an additional 5 years of treatment, although the extended tamoxifen was stopped early (median of 2.5 years; range, 1.6 to 5.0 years). To determine if extended tamoxifen treatment affected results for high-_ESR1_–expressing patients, the association of the RS with LDR in the high-_ESR1_–expressing patients who were re-randomly assigned to extended tamoxifen or placebo was assessed. For the 144 high-_ESR1_–expressing patients at risk after 5 years who were among those assigned to extended tamoxifen, the DR risk estimates over 5 to 15 years for the low-, intermediate-, and high-RS groups were 6.9% (3.1% to 14.7%), 5.0% (0.7% to 30.5%), and 17.5% (7.7% to 37.2%).
DISCUSSION
Using the RS assay, we tested patient tumor tissue from NSABP B-28 and found that the RS and quantitative ESR1 cutoff of 9.1 CT were able to quantify the likelihood of LDR in patients with node-positive, ER-positive breast cancer treated with 5 years of chemotherapy plus tamoxifen. We subsequently independently tested and confirmed the quantitative ESR1 expression cut point of 9.1 CT and RS as an independent predictor of LDR in patients with node-negative, ER-positive breast cancer treated with tamoxifen in B-14. Because the distribution of ESR1 expression in B-14 was generally higher than that of B-28, the majority of B-14 patients were in the higher-_ESR1_–expression subset. In the lower-_ESR1_–expression group the RS was a significant predictor of early DR but was not a significant predictor of LDR; however, few events were experienced after 5 years among the lower-_ESR1_–expressing patients, for whom most events occurred before 5 years in the overly represented high-RS patients, consistent with ER-poor biology.5
These data have implications with respect to cancer pathogenesis and metastasis. Our data confirm and extend results of the foundational gene expression studies, starting with Bianchini et al,5 who used gene expression arrays to show that highly proliferative, high-ER gene–expressing tumors are at the greatest risk of late relapse. Dowsett et al6 further confirmed this association using the ER and proliferation gene expression modules in ER-positive, human epidermal growth factor receptor 2–negative tumors from the Arimidex, Tamoxifen, Alone or Combined (ATAC) randomized clinical trial. In the current study, we have identified a statistically significant interaction between quantitative ESR1 expression, the RS (which includes the five-gene proliferation group), and the risk of LDR in B-28 (interaction P = .04) and B-14 (P = .03). Similar results were seen for the ER and proliferation modules alone (data not shown). In the _ESR1_-poor group, predominantly populated by high-RS patients, the RS was strongly associated with the risk of early DR, suggesting that early relapses are most common in tumors intrinsically resistant to endocrine treatment.23 Alternatively, _ESR1_-rich tumors are at risk for both early DR and LDR, and the RS risk groups provided further risk stratification. Although underpowered in B-28 and B-14, the results in the higher-_ESR1_–expressing patients are consistent across subgroups.
Previous reports have suggested that the RS does not predict LDR, whereas other multigene expression–based assays do.14-16 Although the number of late events is clinically important, the numbers are relatively small, and reports of comparisons of the RS with other tests show differences with overlapping CIs.16,29
How do these results and other studies of LDR risk affect the extended endocrine therapy treatment decision? They confirm studies of other molecular assays in postmenopausal patients and extend these findings to premenopausal women: at-risk patients have varying rates of LDR, and a low-risk group with less than a 5% risk of recurrence in the second quinquennium can be identified.15,16,30-32 In addition to nodal status,27 there seems to be additional discrimination of LDR risk by genomic assays that combine measures of proliferation and ESR1 expression or ER gene groups.5,14,15,30 Recent ASCO guidelines, on evidence derived from five studies of tamoxifen treatment beyond 5 years, recommend extended treatment of all hormone receptor–positive patients.11 Use of the RS, which includes the proliferation gene module and quantitative ESR1 expression for risk of LDR assessment, may be useful for patient risk stratification, and these results are already available for thousands of patients for whom the RS was used on initial diagnosis. Additional studies are needed to validate that genomic factors can predict which patients should be treated with only 5 years of hormonal therapy.
The strengths of this study include that these refined estimates of LDR can be derived from RS and quantitative ESR1 gene expression results. The present data are from randomized, well-controlled studies with sufficient numbers of LDR events for effective cut point selection and testing. Our analyses include an independent training population and separate, independent test population. There are also limitations. This report cannot directly address the question of which subset of patients derive benefit from > 5 years of hormonal treatment. Also, more contemporary study outcomes have improved over time; for example, the total rate of DR at 9 years in node-negative patients treated with tamoxifen or anastrozole with low-RS results (n = 872) was < 4% in TransATAC (Translational Arimidex, Tamoxifen, Alone or in Combination).20
The RS alone is a significant prognostic factor for cumulative risk over 10 years, although this association is attenuated in later years. For LDR, the RS is prognostic in the majority of ER-positive, lymph node–negative patients with higher quantitative ESR1 expression, where the risk of LDR is relatively low for patients with low-RS results, and these results confirm and extend the association between high proliferation and ER levels with LDR.4,5,33 These RS and quantitative ESR1 results may help select patients who could benefit most from hormonal therapy beyond 5 years of treatment and merit further study in larger cohorts, such as MA-17R and NSABP B-42.
Supplementary Material
Protocol
Appendix
Table A1.
Characteristics of NSABP B-28 and B-14 Patients Included in the Current Study
| Variable | No. | % |
|---|---|---|
| NSABP B-28 ER+ patients (n = 1065) | ||
| Age, years | ||
| < 50 | 511 | 48.0 |
| ≥ 50 | 554 | 52.0 |
| Tumor size, cm | ||
| ≤ 2.0 | 483 | 45.4 |
| 2.1-4.0 | 467 | 43.8 |
| ≥ 4.1 | 115 | 10.8 |
| Positive nodes, No. | ||
| 1-3 | 722 | 67.8 |
| 4-9 | 300 | 28.2 |
| ≥ 10 | 43 | 4.0 |
| Central tumor grade | ||
| Well | 120 | 11.3 |
| Moderate | 499 | 46.9 |
| Poor | 405 | 38.0 |
| Unknown | 41 | 3.8 |
| Treatment | ||
| AC | 519 | 48.7 |
| AC→P | 546 | 51.3 |
| Surgery type | ||
| Lumpectomy | 461 | 43.3 |
| Mastectomy | 604 | 56.7 |
| NSABP B-14 tamoxifen-treated patients (n = 668) | ||
| Age, years | ||
| < 50 | 194 | 29.0 |
| ≥ 50 | 474 | 71.0 |
| Tumor size, cm | ||
| ≤ 2.0 | 414 | 62.0 |
| 2.1-4.0 | 220 | 32.9 |
| ≥ 4.1 | 34 | 5.0 |
| Central tumor grade | ||
| Well | 224 | 33.5 |
| Moderate | 296 | 44.3 |
| Poor | 148 | 22.2 |
Table A2.
Late Recurrences Analyses Supportive Materials: Univariable and Multivariable Results for NSABP B-28.
| Variable | Univariable Models | Multivariable Model* | ||
|---|---|---|---|---|
| HR (95% CI)† | _P_† | HR (95% CI)† | _P_† | |
| Age ≥ 50 years | 1.11 (0.76 to 1.62) | 0.58 | 1.01 (0.68 to 1.49) | 0.97 |
| ≥ 4 Positive nodes | 2.15 (1.49 to 3.10) | < .001 | 2.11 (1.43 to 3.10) | < .001 |
| Tumor size > 2 cm | 1.20 (0.83 to 1.73) | 0.34 | 1.12 (0.76 to 1.65) | 0.57 |
| Grade | 0.04 | 0.32 | ||
| Moderate v low | 1.81 (0.90 to 3.64) | 1.59 (0.79 to 3.22) | ||
| Poor v low | 2.34 (1.14 to 4.79) | 1.70 (0.81 to 3.57) | ||
| Treatment AC→P | 1.07 (0.74 to 1.55) | 0.71 | 1.03 (0.71 to 1.50) | 0.87 |
| Mastectomy | 1.10 (0.77 to 1.59) | 0.60 | 0.91 (0.62 to 1.34) | 0.64 |
| RS‡ | 2.45 (1.43 to 4.21) | 0.002 | 2.46 (1.37 to 4.43) | 0.005 |
Table A3.
Late Recurrence Analyses Supportive Materials: Univariable and Multivariable Results for NSABP B-14
| Variable | Univariable Models | Multivariable Model* | ||
|---|---|---|---|---|
| HR (95% CI)† | _P_† | HR (95% CI)† | _P_† | |
| Age ≥ 50 | 1.22 (0.59 to 2.55) | .58 | 1.50 (0.71 to 3.17) | .27 |
| Tumor size > 2 cm | 1.22 (0.66 to 2.24) | .53 | 1.21 (0.65 to 2.23) | .55 |
| Grade | < .001 | .003 | ||
| Moderate v low | 2.25 (0.95 to 5.35) | 1.75 (0.72 to 4.25) | ||
| Poor v low | 5.84 (2.42 to 14.09) | 4.51 (1.78 to 11.44) | ||
| RS‡ | 4.06 (1.91 to 8.62) | < .001 | 2.74 (1.25 to 6.00) | .004 |
Fig A1.
Scatter plots of recurrence score values by ESR1 expression level in NSABP B-28 and B-14. Reference lines for ESR1 expression are at the cut point for positivity by RT-PCR (6.5 CT) and at the cut point identified in B-28 (9.1 CT). (A) Plot for B-28; (B) Plot for B-14. ER, estrogen receptor.
Fig A2.
Cox model hazard ratios (and 95% CIs) for the continuous recurrence score as a predictor of distant recurrence risk in NSABP B-28, in patients with high ESR1 expression, for a range of cut point values. The x-axis is the percentile of the ESR1 distribution in NSABP B-28, annotated with the ESR1 cut point value. ER, estrogen receptor.
Fig A3.
Forest plot with Kaplan-Meier estimates and 95% CIs for distant recurrence risk by recurrence score risk group, by ESR1 expression level and time period, in NSABP B-28 patients. ER, estrogen receptor.
Fig A4.
Kaplan-Meier curves and estimates for distant recurrence risk in NSABP B-14 by recurrence score risk groups, ESR1 expression level, and time period. (A) Curves for ESR1 ≤ 9.1, time 0-5 years; (B) Curves for ESR1 ≤ 9.1, time 5-15 years; (C) Curves for ESR1 > 9.1, time 0-5 years; (D) Curves for ESR1 > 9.1, time 5-15 years.
Fig A5.
Forest plot with Kaplan-Meier estimates and 95% CIs for distant recurrence risk by recurrence score risk group, in high _ESR1_-expressing patients in NSABP B-14, by time period 0-5, 5-10, or 5-15 years.
Fig A6.
Distant recurrence risk estimates over years 5-15, with 95% CIs, in NSABP B-14 high-_ESR1_-expressing patients, as a function of the recurrence score. The estimates are based on the quadratic model.
Footnotes
Supported by National Cancer Institute Grants No. U10-CA-12027, U10-CA-69651, U10-CA-37377, U10-CA-69974, U24-CA-114732, and CA-75362; NRG Oncology U10-CA-180868, and U10-CA-180822; National Cancer Institute Community Oncology Research Program UG1-CA-189867; Susan G. Komen for the Cure grants; Bristol-Myers Squibb Pharmaceutical Research Institute; Astra Zeneca; and Genomic Health.
Authors’ disclosures of potential conflicts of interest are found in the article online at www.jco.org. Author contributions are found at the end of this article.
Clinical trial information: NSABP B-28: NCT01420185; NSABP B-14: PDQ NSABP-B-14.
AUTHOR CONTRIBUTIONS
Conception and design: Norman Wolmark, Eleftherios P. Mamounas, Frederick L. Baehner, Steven M. Butler, Steven Shak
Administrative support: Norman Wolmark
Provision of study materials or patients: Soonmyung Paik
Collection and assembly of data: Eleftherios P. Mamounas, Steven M. Butler, Gong Tang, Farid Jamshidian
Data analysis and interpretation: Eleftherios P. Mamounas, Frederick L. Baehner, Steven M. Butler, Gong Tang, Farid Jamshidian, Amy P. Sing, Steven Shak, Soonmyung Paik
Manuscript writing: All authors
Final approval of manuscript: All authors
AUTHORS’ DISCLOSURES OF POTENTIAL CONFLICTS OF INTEREST
Prognostic Impact of the Combination of Recurrence Score and Quantitative Estrogen Receptor Expression (ESR1) on Predicting Late Distant Recurrence Risk in Estrogen Receptor–Positive Breast Cancer After 5 Years of Tamoxifen: Results from NRG Oncology/National Surgical Adjuvant Breast and Bowel Project B-28 and B-14
The following represents disclosure information provided by authors of this manuscript. All relationships are considered compensated. Relationships are self-held unless noted. I = Immediate Family Member, Inst = My Institution. Relationships may not relate to the subject matter of this manuscript. For more information about ASCO's conflict of interest policy, please refer to www.asco.org/rwc or jco.ascopubs.org/site/ifc.
Norman Wolmark
No relationship to disclose
Eleftherios P. Mamounas
Honoraria: Genentech, Genomic Health
Consulting or Advisory Role: Genomic Health, Celgene, Pfizer, Novartis, bioTheranostics
Speakers’ Bureau: Genomic Health, Genentech
Travel, Accommodations, Expenses: Genomic Health, Genentech, Celgene
Frederick L. Baehner
Employment: Genomic Health
Stock or Other Ownership: Genomic Health
Steven M. Butler
Employment: Genomic Health, Avalanche Biotechnologies
Stock or Other Ownership: Genomic Health, Avalanche Biotechnologies
Consulting or Advisory Role: Avalanche Biotechnologies
Gong Tang
Consulting or Advisory Role: Incyte
Farid Jamshidian
Employment: Genomic Health, Genentech, Amino
Stock or Other Ownership: Genomic Health, Genentech
Travel, Accommodations, Expenses: Genomic Health, Genentech
Amy P. Sing
Employment: Genomic Health
Stock or Other Ownership: Genomic Health
Steven Shak
Employment: Genomic Health
Leadership: Genomic Health
Stock or Other Ownership: Genomic Health
Patents, Royalties, Other Intellectual Property: Filed Oncotype DX patents (Inst)
Soonmyung Paik
No relationship to disclose
REFERENCES
- 1.Early Breast Cancer Trialists’ Collaborative Group (EBCTCG) Davies C, Godwin J, et al. Relevance of breast cancer hormone receptors and other factors to the efficacy of adjuvant tamoxifen: Patient-level meta-analysis of randomised trials. Lancet. 2011;378:771–784. doi: 10.1016/S0140-6736(11)60993-8. [DOI] [PMC free article] [PubMed] [Google Scholar]
- 2.Esserman LJ, Moore DH, Tsing PJ, et al. Biologic markers determine both the risk and the timing of recurrence in breast cancer. Breast Cancer Res Treat. 2011;129:607–616. doi: 10.1007/s10549-011-1564-5. [DOI] [PMC free article] [PubMed] [Google Scholar]
- 3.Blows FM, Driver KE, Schmidt MK, et al. Subtyping of breast cancer by immunohistochemistry to investigate a relationship between subtype and short and long term survival: A collaborative analysis of data for 10,159 cases from 12 studies. PLoS Med. 2010;7:e1000279. doi: 10.1371/journal.pmed.1000279. [DOI] [PMC free article] [PubMed] [Google Scholar]
- 4.Nielsen TO, Parker JS, Leung S, et al. A comparison of PAM50 intrinsic subtyping with immunohistochemistry and clinical prognostic factors in tamoxifen-treated estrogen receptor-positive breast cancer. Clin Cancer Res. 2010;16:5222–5232. doi: 10.1158/1078-0432.CCR-10-1282. [DOI] [PMC free article] [PubMed] [Google Scholar]
- 5.Bianchini G, Pusztai L, Karn T, et al. Proliferation and estrogen signaling can distinguish patients at risk for early versus late relapse among estrogen receptor positive breast cancers. Breast Cancer Res. 2013;15:R86. doi: 10.1186/bcr3481. [DOI] [PMC free article] [PubMed] [Google Scholar]
- 6.Dowsett M, Sestak I, Buus R, et al. Estrogen receptor expression in 21-gene recurrence score predicts increased late recurrence for estrogen-positive/HER2-negative breast cancer. Clin Cancer Res. 2015;21:2763–2770. doi: 10.1158/1078-0432.CCR-14-2842. [DOI] [PubMed] [Google Scholar]
- 7.Fisher B, Dignam J, Bryant J, et al. Five versus more than five years of tamoxifen therapy for breast cancer patients with negative lymph nodes and estrogen receptor-positive tumors. J Natl Cancer Inst. 1996;88:1529–1542. doi: 10.1093/jnci/88.21.1529. [DOI] [PubMed] [Google Scholar]
- 8.Davies C, Pan H, Godwin J, et al. Long-term effects of continuing adjuvant tamoxifen to 10 years versus stopping at 5 years after diagnosis of oestrogen receptor-positive breast cancer: ATLAS, a randomised trial. Lancet. 2013;381:805–816. doi: 10.1016/S0140-6736(12)61963-1. [DOI] [PMC free article] [PubMed] [Google Scholar]
- Gray RG, Rea D, Handley K, et al: aTTom: Long-term effects of continuing adjuvant tamoxifen to 10 years versus stopping at 5 years in 6,953 women with early breast cancer. J Clin Oncol 31, 2013 (suppl; abstr 5) [Google Scholar]
- 10.Goss PE, Ingle JN, Pater JL, et al. Late extended adjuvant treatment with letrozole improves outcome in women with early-stage breast cancer who complete 5 years of tamoxifen. J Clin Oncol. 2008;26:1948–1955. doi: 10.1200/JCO.2007.11.6798. [DOI] [PubMed] [Google Scholar]
- 11.Burstein HJ, Temin S, Anderson H, et al. Adjuvant endocrine therapy for women with hormone receptor-positive breast cancer: American Society of Clinical Oncology clinical practice guideline focused update. J Clin Oncol. 2014;32:2255–2269. doi: 10.1200/JCO.2013.54.2258. [DOI] [PMC free article] [PubMed] [Google Scholar]
- 12.Saphner T, Tormey DC, Gray R. Annual hazard rates of recurrence for breast cancer after primary therapy. J Clin Oncol. 1996;14:2738–2746. doi: 10.1200/JCO.1996.14.10.2738. [DOI] [PubMed] [Google Scholar]
- 13.Brewster AM, Hortobagyi GN, Broglio KR, et al. Residual risk of breast cancer recurrence 5 years after adjuvant therapy. J Natl Cancer Inst. 2008;100:1179–1183. doi: 10.1093/jnci/djn233. [DOI] [PMC free article] [PubMed] [Google Scholar]
- 14.Sgroi DC, Sestak I, Cuzick J, et al. Prediction of late distant recurrence in patients with oestrogen-receptor-positive breast cancer: A prospective comparison of the breast-cancer index (BCI) assay, 21-gene recurrence score, and IHC4 in the TransATAC study population. Lancet Oncol. 2013;14:1067–1076. doi: 10.1016/S1470-2045(13)70387-5. [DOI] [PMC free article] [PubMed] [Google Scholar]
- 15.Sestak I, Cuzick J, Dowsett M, et al. Prediction of late distant recurrence after 5 years of endocrine treatment: A combined analysis of patients from the Austrian breast and colorectal cancer study group 8 and arimidex, tamoxifen alone or in combination randomized trials using the PAM50 risk of recurrence score. J Clin Oncol. 2015;33:916–922. doi: 10.1200/JCO.2014.55.6894. [DOI] [PubMed] [Google Scholar]
- 16.Sestak I, Dowsett M, Zabaglo L, et al. Factors predicting late recurrence for estrogen receptor-positive breast cancer. J Natl Cancer Inst. 2013;105:1504–1511. doi: 10.1093/jnci/djt244. [DOI] [PMC free article] [PubMed] [Google Scholar]
- 17.Paik S, Shak S, Tang G, et al. A multigene assay to predict recurrence of tamoxifen-treated, node-negative breast cancer. N Engl J Med. 2004;351:2817–2826. doi: 10.1056/NEJMoa041588. [DOI] [PubMed] [Google Scholar]
- 18.Paik S, Tang G, Shak S, et al. Gene expression and benefit of chemotherapy in women with node-negative, estrogen receptor-positive breast cancer. J Clin Oncol. 2006;24:3726–3734. doi: 10.1200/JCO.2005.04.7985. [DOI] [PubMed] [Google Scholar]
- 19.Albain KS, Barlow WE, Shak S, et al. Prognostic and predictive value of the 21-gene recurrence score assay in postmenopausal women with node-positive, oestrogen-receptor-positive breast cancer on chemotherapy: A retrospective analysis of a randomised trial. Lancet Oncol. 2010;11:55–65. doi: 10.1016/S1470-2045(09)70314-6. [DOI] [PMC free article] [PubMed] [Google Scholar]
- 20.Dowsett M, Cuzick J, Wale C, et al. Prediction of risk of distant recurrence using the 21-gene recurrence score in node-negative and node-positive postmenopausal patients with breast cancer treated with anastrozole or tamoxifen: A TransATAC study. J Clin Oncol. 2010;28:1829–1834. doi: 10.1200/JCO.2009.24.4798. [DOI] [PubMed] [Google Scholar]
- 21.Goldstein LJ, Gray R, Badve S, et al. Prognostic utility of the 21-gene assay in hormone receptor-positive operable breast cancer compared with classical clinicopathologic features. J Clin Oncol. 2008;26:4063–4071. doi: 10.1200/JCO.2007.14.4501. [DOI] [PMC free article] [PubMed] [Google Scholar]
- Mamounas EP, Tang G, Paik S, et al: Prognostic impact of the 21-gene recurrence score (RS) on disease-free and overall survival of node-positive, ER-positive breast cancer patients treated with adjuvant chemotherapy: Results from NSABP B-28. J Clin Oncol 30, 2012 (suppl 27; abstr 1) [Google Scholar]
- 23.Kim C, Tang G, Pogue-Geile KL, et al. Estrogen receptor (ESR1) mRNA expression and benefit from tamoxifen in the treatment and prevention of estrogen receptor-positive breast cancer. J Clin Oncol. 2011;29:4160–4167. doi: 10.1200/JCO.2010.32.9615. [DOI] [PMC free article] [PubMed] [Google Scholar]
- 24.Badve SS, Baehner FL, Gray RP, et al. Estrogen- and progesterone-receptor status in ECOG 2197: Comparison of immunohistochemistry by local and central laboratories and quantitative reverse transcription polymerase chain reaction by central laboratory. J Clin Oncol. 2008;26:2473–2481. doi: 10.1200/JCO.2007.13.6424. [DOI] [PubMed] [Google Scholar]
- 25.Fisher B, Dignam J, Bryant J, et al. Five versus more than five years of tamoxifen for lymph node-negative breast cancer: Updated findings from the National Surgical Adjuvant Breast and Bowel Project B-14 randomized trial. J Natl Cancer Inst. 2001;93:684–690. doi: 10.1093/jnci/93.9.684. [DOI] [PubMed] [Google Scholar]
- 26.Fisher B, Costantino J, Redmond C, et al. A randomized clinical trial evaluating tamoxifen in the treatment of patients with node-negative breast cancer who have estrogen-receptor-positive tumors. N Engl J Med. 1989;320:479–484. doi: 10.1056/NEJM198902233200802. [DOI] [PubMed] [Google Scholar]
- 27.Mamounas EP, Bryant J, Lembersky B, et al. Paclitaxel after doxorubicin plus cyclophosphamide as adjuvant chemotherapy for node-positive breast cancer: Results from NSABP B-28. J Clin Oncol. 2005;23:3686–3696. doi: 10.1200/JCO.2005.10.517. [DOI] [PubMed] [Google Scholar]
- 28.Cronin M, Sangli C, Liu ML, et al. Analytical validation of the Oncotype DX genomic diagnostic test for recurrence prognosis and therapeutic response prediction in node-negative, estrogen receptor-positive breast cancer. Clin Chem. 2007;53:1084–1091. doi: 10.1373/clinchem.2006.076497. [DOI] [PubMed] [Google Scholar]
- 29.Dowsett M, Sestak I, Lopez-Knowles E, et al. Comparison of PAM50 risk of recurrence score with oncotype DX and IHC4 for predicting risk of distant recurrence after endocrine therapy. J Clin Oncol. 2013;31:2783–2790. doi: 10.1200/JCO.2012.46.1558. [DOI] [PubMed] [Google Scholar]
- 30.Dubsky P, Brase JC, Jakesz R, et al. The EndoPredict score provides prognostic information on late distant metastases in ER+/HER2- breast cancer patients. Br J Cancer. 2013;109:2959–2964. doi: 10.1038/bjc.2013.671. [DOI] [PMC free article] [PubMed] [Google Scholar]
- 31.Filipits M, Nielsen TO, Rudas M, et al. The PAM50 risk-of-recurrence score predicts risk for late distant recurrence after endocrine therapy in postmenopausal women with endocrine-responsive early breast cancer. Clin Cancer Res. 2014;20:1298–1305. doi: 10.1158/1078-0432.CCR-13-1845. [DOI] [PubMed] [Google Scholar]
- 32.Sgroi DC, Carney E, Zarrella E, et al. Prediction of late disease recurrence and extended adjuvant letrozole benefit by the HOXB13/IL17BR biomarker. J Natl Cancer Inst. 2013;105:1036–1042. doi: 10.1093/jnci/djt146. [DOI] [PMC free article] [PubMed] [Google Scholar]
- 33.Turnbull AK, Arthur LM, Renshaw L, et al. Accurate prediction and validation of response to endocrine therapy in breast cancer. J Clin Oncol. 2015;33:2270–2278. doi: 10.1200/JCO.2014.57.8963. [DOI] [PubMed] [Google Scholar]
Associated Data
This section collects any data citations, data availability statements, or supplementary materials included in this article.
Supplementary Materials
Protocol
