How did extinct giant birds and pterosaurs fly? A comprehensive modeling approach to evaluate soaring performance (original) (raw)
Abstract
The largest extinct volant birds (Pelagornis sandersi and Argentavis magnificens) and pterosaurs (Pteranodon and Quetzalcoatlus) are thought to have used wind-dependent soaring flight, similar to modern large birds. There are 2 types of soaring: thermal soaring, used by condors and frigatebirds, which involves the use of updrafts to ascend and then glide horizontally; and dynamic soaring, used by albatrosses, which involves the use of wind speed differences with height above the sea surface. Previous studies have suggested that P. sandersi used dynamic soaring, while A. magnificens and Quetzalcoatlus used thermal soaring. For Pteranodon, there is debate over whether they used dynamic or thermal soaring. However, the performance and wind speed requirements of dynamic and thermal soaring for these species have not yet been quantified comprehensively. We quantified these values using aerodynamic models and compared them with that of extant birds. For dynamic soaring, we quantified maximum travel speeds and maximum upwind speeds. For thermal soaring, we quantified the animal's sinking speed circling at a given radius and how far it could glide losing a given height. Our results confirmed those from previous studies that A. magnificens and Pteranodon used thermal soaring. Conversely, the results for P. sandersi and Quetzalcoatlus were contrary to those from previous studies. P. sandersi used thermal soaring, and Quetzalcoatlus had a poor ability both in dynamic and thermal soaring. Our results demonstrate the need for comprehensive assessments of performance and required wind conditions when estimating soaring styles of extinct flying species.
Keywords: birds, pterosaurs, wind, dynamic soaring, thermal soaring
Significance Statement.
Quetzalcoatlus (10 m wingspan), one of the largest pterosaurs, was thought to have flown over land using updrafts like condors and eagles. Conversely, Pelagornis sandersi (7 m wingspan), one of the largest extinct volant birds, was thought to have flown using dynamic soaring like albatrosses, using differences in wind speed with height above the sea surface. In this study, we used aerodynamic models to comprehensively quantify soaring performances and wind requirements of these extinct species and compared them with extant soaring birds. We found that _Quetzalcoatlu_s was less suited to flying in updrafts than the extant birds, and P. sandersi was better suited to flying in updrafts above the sea, similar to frigatebirds, rather than using albatross-like dynamic soaring.
Introduction
Flying animals have evolved a wide range of body sizes. Among them, there have been exceptionally large species of birds and pterosaurs (Fig. 1). Among the many extinct giant bird species (1–7), Pelagornis sandersi (from the late Oligocene, approximately 25–28 million years ago [Ma]) and Argentavis magnificens (from the upper Miocene, approximately 6 Ma) are the largest volant birds. Their estimated wingspans reached 6–7 m (1–4), twice as large as that of the wandering albatross [_Diomedea exulans_], the extant bird with the longest wingspan (Table 1). Several large species of pterosaurs appeared in the Cretaceous period. Pteranodon, arguably the most famous pterosaur, is estimated to have had a wingspan of 6–7 m (Table 1) (8, 9). The azhdarchids are one of the most successful Cretaceous pterosaur groups and include several large species with wingspans of approximately 9–11 m (Table 1) (10–13). Although their huge sizes have been led debate about whether they were flightless (14–16), Quetzalcoatlus northorpi, an azhdarchid species, is often regarded as one of the largest flying animals in history (16).
Fig. 1.

A size comparison and soaring styles of extinct giant birds (P. sandersi and A. magnificens), pterosaurs (Pteranodon and Quetzalcoatlus), the largest extant dynamic soaring bird (wandering albatross), the largest extant thermal soaring terrestrial bird (California condor), a large extant thermal soaring seabird (magnificent frigatebird), and the heaviest extant volant bird (kori bustard). The icons indicate dynamic soarer, thermal soarer, and poor soarer, and summarize the main results of this study. The pink arrows indicate the transition from a previous expectation or hypothesis to the knowledge updated in this study.
Table 1.
Morphological values of examined species.
| Species | Mass [kg] | Wingspan [m] | Wing area [m2] | Aspect ratio | Wing loading [N/m2] | Ref | |
|---|---|---|---|---|---|---|---|
| Extinct animals | Pelagornis sandersi | 21.8 and 40.1 | 6.06, 6.13, 6.40, and 7.38 | 2.45–4.19 | 13.0, 14.0, and 15.0 | 51.0–87.4a and 93.9–161b | (1) |
| Argentavis magnificens | 70.0 | 7.00 | 8.11 | 6.04 | 84.7 | (4) | |
| Pteranodon | 36.7 | 5.96 | 1.99 | 17.9 | 181 | (9) | |
| 18.6 | 5.34 | 2.26 | 12.6 | 80.7 | (15) | ||
| Quetzalcoatlus | 259 | 9.64 | 11.4 | 8.18 | 224 | (9) | |
| Dynamic soaring birds | wandering albatross | 8.64 | 3.05 | 0.606 | 15.4 | 140 | (17)c |
| black-browed albatross | 3.55 | 2.25 | 0.376 | 13.4 | 87.5 | (18)c | |
| white-chinned petrel | 1.37 | 1.40 | 0.169 | 11.6 | 79.5 | (19) | |
| Thermal soaring birds | magnificent frigatebird | 1.52 | 2.29 | 0.408 | 12.8 | 36.5 | (20) |
| California condor | 9.50 | 2.74 | 1.32 | 5.70 | 70.6 | (4) | |
| brown pelican | 2.65 | 2.10 | 0.450 | 9.80 | 57.8 | (20) | |
| black vulture | 1.82 | 1.38 | 0.327 | 5.82 | 54.6 | (20) | |
| white stork | 3.40 | 2.18 | 0.540 | 7.42 | 61.8 | (4) | |
| Non-soaring bird | kori bustard | 11.9 | 2.47 | 1.06 | 5.76 | 110 | (21)d |
| Motor glider | Schleicher ASK 14 | 340 | 14.3 | 12.6 | 16.2 | 265 | (22) |
How and how well these giant animals were able to fly has fascinated researchers across disciplines for over a century (23). This is because the question is not only interesting as a biophysical question in its own right, but also because it contributes to unraveling a wide range of issues such as the lifestyle of these species, their role in paleoecosystems, and the drivers of morphological evolution, diversification, and extinction of giant species over geological time (6, 16, 24–26). Their huge size must have significantly affected their flight because, with increasing size, the power required to fly increases faster than the power muscles can produce via the flapping of wings (27–29). Hence, this physical constraint has resulted in 2 debated arguments about the flight of extinct giants. The first debate is about whether and how they were able to take off (4, 14, 30, 31). The second debate concerns their soaring flight style. Due to the high costs of flapping that stems from their large body size, large extant birds prefer to fly utilizing wind energy or convection, that is, they prefer to soar (14, 32). Hence, it is presumed that extinct large animals also employed soaring flight as their primary mode of transportation (1, 4, 16). However, the kind of soaring flight style they employed is debated (1, 4, 16, 33, 34). The present study focuses on this second debate.
There are 2 main soaring flight styles among extant birds: dynamic soaring and thermal (and slope) soaring (21). In dynamic soaring, birds extract flight energy from wind shear—the vertical gradient in horizontal wind speed over the ocean (Fig. 2A–B). Extant seabirds (e.g. albatrosses, shearwaters, and petrels) employ this soaring style and can routinely travel hundreds of kilometers per day over the sea. In thermal soaring, birds first fly circling in warm rising-air columns (thermals). They climb to a substantial height and then glide off in the desired direction while losing their height (Fig. 2C–E). By repeating this up–down process, birds travel over vast distances. Various terrestrial bird species (e.g. vultures, eagles, and storks) and seabirds (e.g. frigatebirds and pelicans) employ thermal soaring (20). Terrestrial birds that utilize thermal soaring are also able to use the upward wind deflected by a mountain or hillside instead of the thermal for their ascent (32); this is termed “slope soaring.” Another form of slope soaring called wave-slope soaring uses the upward wind generated by waves (35). Wave-slope soaring is thought to be used by both thermal soaring seabirds (pelicans) and dynamic soaring seabirds (albatrosses) (35), but since no bird exclusively uses wave-slope soaring, we did not include it in the main soaring styles here.
Fig. 2.
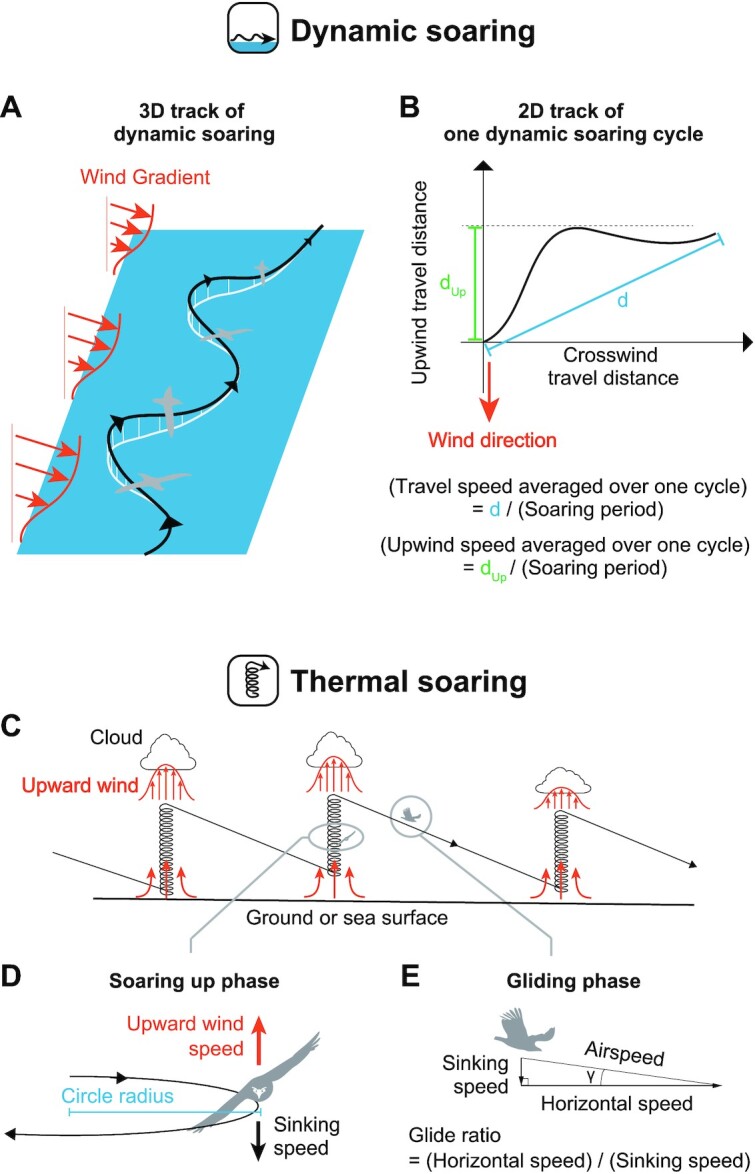
Schematics of dynamic soaring and thermal soaring. (A) Example of a 3D track of dynamic soaring. Dynamic soaring species repeat an up and down process with a shallow S-shaped trajectory at the sea surface. By utilizing wind gradients, a species can fly without flapping. (B) Example of a 2D dynamic soaring trajectory of 1 soaring cycle. The travel speed averaged over 1 cycle is defined as the travel distance in 1 cycle (d) divided by the soaring period, and the upwind speed averaged over 1 cycle is defined as the upwind travel distance in 1 cycle (dUp) divided by the soaring period. (C) Schematic of a thermal soaring cycle. (D) In the soaring up phase, a species soars in a steady circle. When there is upward wind that is greater than a species’ sinking speed, the species can ascend in the thermal. The upward wind is stronger in the center of a thermal; therefore, achieving a small circle radius is advantageous for thermal soaring. (E) In the gliding phase, a species glides in a straight line. The rate of horizontal speed to the sinking speed is equal to the rate of horizontal distance traveled to the height lost.
Previous studies estimated that P. sandersi was a dynamic soarer (1), and A. magnificens and Quetzalcoatlus were thermal soarers (4, 16). Pteranodon was estimated to be a dynamic soarer (16), but subsequent studies have indicated that it was a thermal soarer (34, 36). See Quantification of soaring styles in previous studies in Materials and Methods for details about previous studies on this topic.
To estimate the potential soaring styles of these extinct animals, it is necessary to quantify their soaring performance, e.g. potential speed and efficiency of soaring, as well as the required wind speed to sustain soaring flight. Valuable indicators of dynamic soaring performance are the maximum travel speed and the maximum upwind speed averaged over 1 dynamic soaring cycle (Fig. 2B) (37–39). Additionally, it is necessary to evaluate the minimum horizontal wind speed required for sustainable dynamic soaring (40). Thermal (and slope) soaring performance is well-quantified by 2 indicators: the glide ratio, i.e. the ratio of the distance the animal traverses to the height the bird loses to cover that distance in the gliding phase (Fig. 2E), and the sinking speed of the animal circling in a given radius during the upward soaring phase (Fig. 2D). This sinking speed during circling corresponds to the upward wind speed required to ascend in a thermal. Because thermals have a stronger updraft in the center (Fig. 2C), the animal needs to achieve not only low sinking speed but also a narrow circle radius to efficiently ascend using a thermal. For slope soaring, the minimum value of sinking speed (sinking speed at infinite radius) would be an appropriate metric for performance, as the circle radius is less restrictive in slope soaring.
However, the soaring performances and required wind conditions have not been comprehensively evaluated for P. sandersi, A. magnificens, Pteranodon, and Quetzalcoatlus (summarized in Table 2). A total of 3 knowledge gaps are highlighted in Table 2: (1) the dynamic soaring performance and the minimum required wind speed have never been evaluated; (2) the thermal soaring performance in the soaring up phase and the required updraft wind speed have not been evaluated for P. sandersi, Pteranodon, and _Quetzalcoatlu_s; and (3) despite recent studies showing that the body masses of Pteranodon and Quetzalcoatlus were approximately 3 times heavier than previously expected (9, 14, 15), and that pterosaurs’ wings had a higher profile drag than that of birds (34), the soaring performances of these new heavy body masses and higher drags have rarely been evaluated.
Table 2.
Summary of previous studies. Previous studies that quantified the soaring performances and required wind conditions of P. sandersi, A. magnificens, Pteranodon, and Quetzalcoatlus with recent heavy body mass estimates.
| Dynamic soaring | Thermal soaring | |||||
|---|---|---|---|---|---|---|
| Species | Predicted soaring style | Wind condition | Performance | Wind condition | Performance (Gliding) | Performance (Soaring up) |
| Pelagornis sandersi | Dynamic soaring (1) | — | Glide polar (1) | — | Glide polar (1) | — |
| Argentavis magnificens | Thermal soaring (4) | — | — | Circling envelope (4) | Glide polar (4) | Circling envelope (4) |
| Pteranodon | Thermal soaring (34) Dynamic soaring (16)† | — | — | — | Glide polar (34) | — |
| Quetzalcoatlus | Thermal soaring (16)† | — | — | — | — | — |
In this study, we aimed to address these knowledge gaps and identify the potential soaring styles of these extinct giant birds and pterosaurs. To this end, we used physical models and recent morphology estimates to quantify the performance and wind conditions required for dynamic and thermal soaring in these extinct animals, and compared them with those of extant soaring birds. See Models in Materials and Methods for details about the employed models and parameter values.
Another aim of this study is to provide a framework for the objective evaluation of the soaring performance of extinct animals using models based on physical principles that all animals adhere to and serve as a stepping stone for invoking further research on this topic. Therefore, the assumptions and simplifications in our model, as well as our results and their implications, are important outcomes for future research and are explored in depth in the Discussion section.
Results
Dynamic soaring
We quantified the dynamic soaring performance (Fig. 2B) and required wind speeds using a physical model and a numerical optimization method. This method has been developed in the engineering field and provides a framework to quantify dynamic soaring performances and required wind conditions for gliders and birds (37, 40, 43, 44). However, despite its effectiveness, the only animal to which this technique has been applied is the wandering albatross (40, 44); it has never been applied to extinct giant flyers. We applied this framework to the 4 giant extinct species and 3 extant dynamic soaring bird species with various sizes ranging from 1 to 9 kg (i.e. the white-chinned petrel [_Procellaria aequinoctialis_], the black-browed albatross [_Thalassarche melanophris_], and the wandering albatross). As the exact shape of the wind gradient remains poorly understood, we conducted the calculation under 7 different wind conditions (Fig. 3A–C) (40, 44). In addition, we added an important modification to the previous models: the animal's wings do not touch the sea surface during their flight (Fig. 3D; and see Eq. 17 and its description in Materials and Methods for details).
Fig. 3.
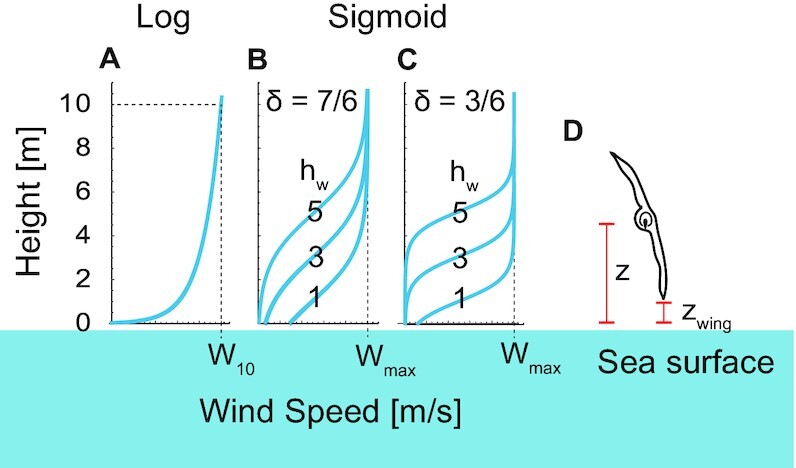
Wind shear models explored in this study. (A) Logarithmic wind gradient model. The wind speed at height 10 m was defined as _W_10. (B) Sigmoidal wind shear model with a wind shear thickness of 7 m (δ = 7/6) and a shear height (_h_w) of 1, 3, or 5 m. (C) Sigmoidal wind shear model with a wind shear thickness of 3 m (δ = 3/6) and a shear height of 1, 3, or 5 m. The maximum wind speed of the sigmoidal model is represented as Wmax. (D) Schematic of a soaring bird. Its height from the sea surface is represented as z and the height of the wingtip is represented as zwing. We constrained the models so that the wing tip did not touch the sea surface, i.e. _z_wing ≥ 0.
Our computation results indicate that A. magnificens, Pteranodon, and Quetzalcoatlus showed lower dynamic soaring performances and higher required wind speeds for dynamic soaring than the extant dynamic soaring species under all wind conditions tested in this study (Fig. 4; Figures S1 and S2, Supplementary Material). Therefore, these species could not have employed dynamic soaring.
Fig. 4.

Minimum required wind speeds and dynamic soaring performances of extinct and extant animals. (A) Results of the logarithmic wind model. (B) Results of the sigmoidal wind model with a wind shear thickness of 7 m (δ = 7/6) and wind shear height (_h_w) of 3 m. The first row shows the minimum required wind speed for sustainable dynamic soaring. The second row shows the maximum travel speed averaged over 1 soaring cycle, in response to wind speed. The third row shows the maximum upwind speed averaged over 1 soaring cycle, in response to wind speed.
For P. sandersi, the results were highly dependent on body mass. With heavy body mass estimates (40.1 kg), P. sandersi required higher wind speeds than extant dynamic soaring species, irrespective of the wind conditions. The performance was superior to extant species for some morphology estimates when the shear height was far from the sea surface (sigmoidal wind condition with _h_w = 5 m), but inferior when the wind speed change was located close to the sea surface (logarithmic model and sigmoidal wind condition with _h_w = 1 and 3 m). In particular, their upwind speed was inferior to that of extant species, resulting in an inefficient flight at their upwind destination and, consequently, limiting their travel direction. When lower body mass estimates were used (21.8 kg), P. sandersi required lower wind speeds, but its performance was distinctively lower than that of extant species. Hence, P. sandersi required harsh wind conditions for dynamic soaring when a 40.1 kg body mass was assumed, and it was poor at dynamic soaring when a 21.8 kg body mass was assumed.
The performances of all species varied with the value of _h_w, and the variation was especially distinct for large species in contrast to that of white-chinned petrels (Fig. 4; Figures S1 and S2, Supplementary Material). This variation was due to wingtip boundary conditions (Fig. 3D and Eq. 17). Animals can attain more energy when passing through large wind speed gradients, but when large gradient changes are close to the sea level, large animals are unable to use the wind speed gradient efficiently because their wings limit the altitude available to them. Although the long, thin wings that reduce drag in extant dynamic soaring birds are suited for dynamic soaring (21, 45), our detailed dynamic models have shown that excessively long wings can also inhibit efficient dynamic soaring.
Thermal soaring
The thermal soaring performances and the required upward wind speeds (Fig. 2D and E) were quantified using the established framework, i.e. glide polars and circling envelopes. A glide polar is a graphical plot of the sinking speed vs. horizontal speed when a bird glides in a straight line (21). We can determine the maximum glide ratio and the associated travel speed of flyers by identifying the line that passes through the origin and tangents of the glide polar plot. The inverse of the line slope and the speed at the tangent point correspond to the maximum glide ratio and the associated horizontal speed, respectively. The circling envelope is a graphical plot of the sinking speed (i.e. equivalent to the required upward wind speed for ascent in a thermal) vs. the radius of a turn when a bird glides in a steady circle (21, 20).
We quantified the thermal soaring performances and the required upward wind speeds for the 4 extinct species, 5 extant thermal soaring species (the magnificent frigatebird [_Fregata magnificens_], the black vulture [_Coragyps atratus_], the brown pelican [_Pelecanus occidentalis_], the white stork [_Ciconia ciconia_], and the California condor [_Gymnogyps californianus_]), and the kori bustard (Ardeotis kori), the heaviest extant volant bird that does not soar. The performances reported in a previous study of the Schleicher ASK-14, a motor glider with a 14 m wingspan similar to that of Quetzalcoatlus, are also presented for comparison (22).
All extinct species showed high gliding performances with maximum glide ratios ranging from 10 to 17 (Fig. 5A), which are comparative to those of extant species.
Fig. 5.
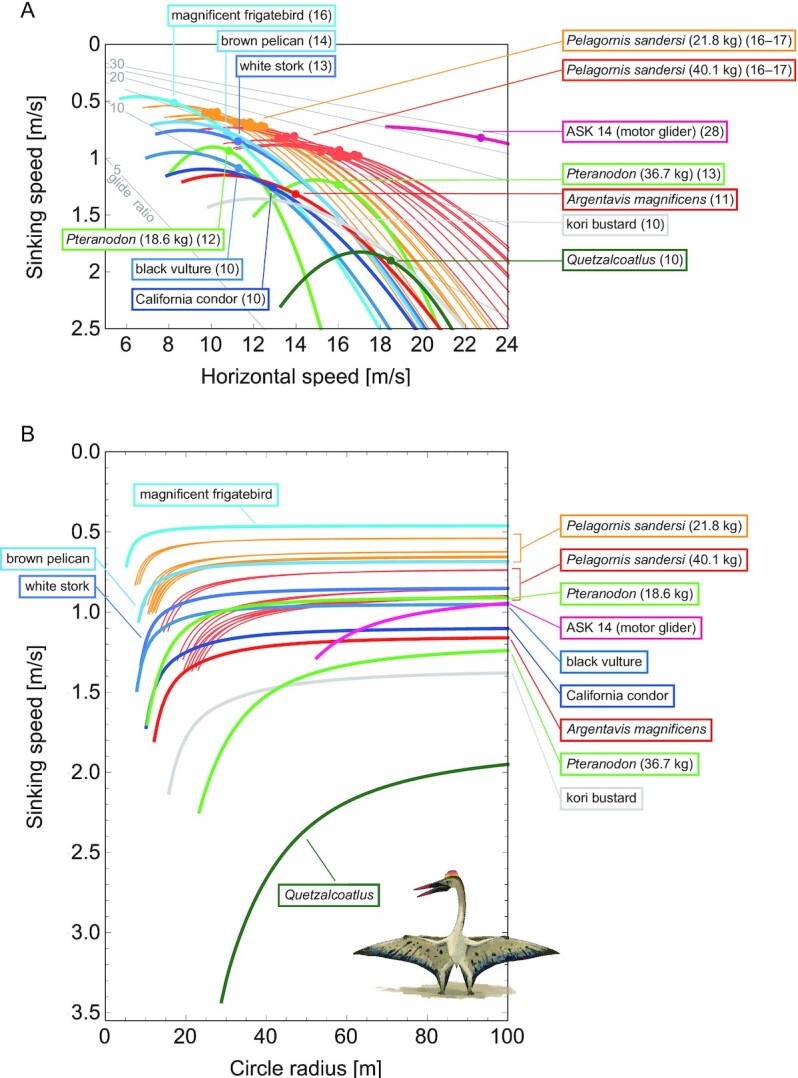
Glide polars (A) and circling envelopes (B) of extinct species, extant thermal soaring species, and the kori bustard, the heaviest rarely flying bird. In (A), the maximum glide ratios of each species are shown on the right side of species names. Points represent the horizontal speed and sinking speed at the maximum glide ratio of each species. Gray lines represent glide ratios (5, 10, 15, 20, 25, and 30). (B) Shows circling envelopes defined as the minimum sinking speed against the circle radius. The left end of the curve is for a bank angle of 40°. The smaller the bank angle, the larger the circle radius. A linear wingspan reduction is assumed for birds and a fixed wingspan is assumed for pterosaurs. The lift coefficient of circling envelope ( ) is the maximum lift coefficient (1.8 for birds and 2.0 for pterosaurs).
With respect to the soaring up phase, all of the extinct giant flyers, except for Quetzalcoatlus, had performances equivalent to or better than the extant soaring species (Fig. 5B). As shown previously (4), the circling up performance of A. magnificens was comparable to that of the California condor, one of the largest living thermal soarers. The performance of Pteranodon was comparable to that of living thermal soarers; however, it was rather low when the higher body mass estimate (36.7 kg) was employed. The thermal soaring ability of P. sandersi when a light mass was assumed (21.9 kg) was outstanding. It outperformed several extant thermal soaring species in soaring up ability, and was even comparable to the magnificent frigatebirds, the champion of thermal soaring among extant species. Even with a heavier body mass estimate (40.1 kg), P. sandersi still outperformed or was comparable to several other species.
Among the 4 extinct giant animals investigated in this study, the soaring up performance of Quetzalcoatlus was exceptionally low. It required the strongest upward wind speed and the widest circle radius. Its performance was even lower than that of the kori bustard, one of the heaviest volant extant bird species, which spends most of its time on land and only fly in emergencies, such as when under predation risk.
Figure 5 also demonstrates how gliders and animals differ with regards to what they prioritize in thermal soaring. A low sinking speed and a narrow circle radius are advantageous during the ascent phase of thermal soaring, whereas a high glide ratio and flight speed are advantageous during the glide phase, the benefits of which are not simultaneously satisfied. Natural selection has favored bird species that prioritize performance in the ascent phase; thermal soaring species have a smaller wing loading relative to their size than other species (45). This aids in achieving a slower sinking speed and tighter circle radius, as they must use weak updrafts at low altitudes after landing on the ground for foraging and/or flying in poor updraft conditions due to unexpected weather changes. Conversely, since the development of gliders in 1911, their designers have changed their performance priorities (46). In the early stages of glider development, the ability to climb in weak updrafts was prioritized, as is the case in birds, with gliders having large wing areas, low aspect ratios, and low wing loadings. Subsequently, performance in the glide phase was increasingly prioritized, leading to the development of gliders with high aspect ratio wings and high wing loading to achieve a high glide ratio and fast flight speed. In addition, as the high aspect ratio reduced the induced drag, this change was also advantageous in reducing the sinking speed. This change was possible through a combination of the discovery of flight strategies that use strong thermals at high altitudes, and the development of new high-strength materials, such as carbon-reinforced plastic, that allowed elongated wings to withstand high-speed flights (46). The performance of the motor glider (ASK 14) in Fig. 5 indicates that while its high flight speed results in a larger circle radius than that of animals, its maximum glide ratio is nearly 30, far superior to that of birds and pterosaurs. Some modern sailplanes (such as Eta) have glide ratios of up to 70 and aspect ratios up to 50 (47). Therefore, the distinct difference in performance between the glider and animals (Fig. 5) indicates the difference in “selection pressure” and constraints on morphology (i.e. materials available for the wing) between them.
Discussion
Although several previous studies have investigated the soaring performance of extinct species, there have been several evaluation gaps. In the present study, we filled these gaps using physical models of soaring birds. We computed and compared the dynamic and thermal soaring performances and the required wind conditions for soaring of 4 extinct giant flyers with those of extant dynamic and thermal soaring species, which enabled us to examine the soaring style of extinct giants from multiple perspectives. Our results indicate that A. magnificens was a thermal soarer, confirming a previous study (4). For Pteranodon, there were 2 previous competing claims: dynamic soarer (16) and thermal soarer (34). Our results supported that they were thermal soarers. For Quetzalcoatlus and P. sandersi, our results were in contrast to previous studies. Our results indicate that Quetzalcoatlus could not efficiently perform dynamic nor thermal soaring. In addition, although P. sandersi was considered a dynamic soaring species in a previous study (1), our results suggest that it was a thermal soaring bird. We discuss our results in detail for Pteranodon, Quetzalcoatlus, and P. sandersi, and then describe future issues that need to be addressed for a better understanding of the soaring styles of extinct giant species.
Pteranodon
There have been conflicting estimates of the soaring style of Pteranodon. It was claimed that they used thermal soaring based on quantitative evaluations of glide polars obtained from wind tunnel experiments using reconstructed wings of pterosaurs (34) and of the strength of the pterosaur's wing membranes using a physical model (36). In contrast, it was claimed that they used dynamic soaring based on a comparison of morphology between birds, bats, and pterosaurs with a principal component analysis (PCA), which showed that Pteranodon and albatrosses were located in similar regions of the principal components space (16).
However, it should be noted that the comparative PCA method employed in the latter study does not provide quantitative soaring performances, as cautioned by the proposer of the original method (41) (this issue will be discussed in detail in the next section, “_Quetzalcoatlus_”). Hence, there has been no direct evaluation of the dynamic soaring performance of Pteranodon. Our results fill this knowledge gap and show that Pteranodon was not good at dynamic soaring and had a thermal soaring ability comparable to that of extant species, as has already been shown (34).
Based on these points, and as many Pteranodon have been found from deposits in the center of the Western Interior Seaway (48), we suggest that they travelled over oceans by thermal soaring like frigatebirds.
Quetzalcoatlus
There has been a heated debate about the flight capability of Quetzalcoatlus. The focal issue has been whether or not Quetzalcoatlus could take off. Researchers are divided between the opinion that it was too heavy to take off (14,15) and the opinion that it was able to take off by using quadrupedal launching, like some bats (16, 30) (but also see the recent discussion on the launching of Quetzalcoatlus (49)). In addition, detailed observations of fossils are also presented as evidence that the giant azhdarchids, including Quetzalcoatlus, were capable of flight; for example, a huge deltopectoral crest on their humeri, which would have anchored muscles for flapping flight (50).
Although there is some debate as to whether or not giant pterosaurs could have taken off, it has been widely accepted that if they were able to take off their primary mode of travel would have been thermal soaring rather than flapping flight (16). Witton and Habib reported that the flapping flight of Quetzalcoatlus required anaerobic movement and was difficult to sustain for a long period; therefore, it must have relied on wind energy for long-distance travel (16). Based on a comparison of morphology between birds, bats, and pterosaurs with a PCA, these authors also concluded that Quetzalcoatlus used thermal soaring (9, 16).
Our results revealed that Quetzalcoatlus had a poor performance to ascend using thermal or deflected upward wind. It required a larger circle radius and stronger updraft than the extant thermal soaring species, and even than the kori bustard that does not soar and spent most of their time on land. This suggests that the wind conditions under which Quetzalcoatlus could conduct sustainable thermal soaring were limited. The ability to climb in weak updrafts at low altitudes is particularly important for sustainable thermal soaring. At high altitudes, strong thermals can create updrafts of 5 m/s or more, and thus the sink rate of approximately 2 m/s of Quetzalcoatlus would have been sufficient to exploit such strong updrafts. However, it should be noted that thermals are generally weaker and narrower at low altitudes (51). Therefore, every time an animal starts to climb a thermal, they are obliged to soar in the poor thermal conditions at low altitudes. For example, the largest existing thermal soaring species can only climb at low speeds at low altitudes because of the weaker updrafts of thermals and the bird's high sink rate involved in reducing the circle radius to accommodate the narrower thermal width (51). Hence, the poorer thermal soaring ability of Quetzalcoatlus than that of extant species would have greatly reduced the number of thermals they could have climbed, which would have made it difficult for them to stay aloft long enough to find a strong thermal.
The poor thermal and slope soaring performance of Quetzalcoatlus was due to the large wing loading associated with the large body size. As shown in Materials and Methods, the circle radius was proportional to the wing loading (Eq. 21), and the minimum sinking speed during straight glide was proportional to the wing loading to the power of one-half, when the effect of the wing length adjustment and the lift coefficient dependence of the profile drag coefficient were negligible (Eq. 20). Since the wing loading increases with body mass, a giant Quetzalcoatlus required thermals with a wider radius and stronger updraft for thermal and slope soaring.
The wing loading also explains why the results of the present study are not consistent with the claims of previous studies that Quetzalcoatlus was adapted to thermal soaring (9, 16). In the previous study, soaring ability was assessed from 2 variables related to wing loading and aspect ratio with PCA (second and third principal components obtained by PCA on the logarithms of body weight, wing area, and wingspan; see (41, 42) for details of the method and data). Note that these variables are not exactly equal to wing loading and aspect ratio. In particular, the size-dependence has been removed from the principal component related to wing loading. However, thermal soaring performance is inevitably size-dependent and, therefore, using performance and wind requirements calculated from morphology based on the laws of physics (as conducted in this study and (26, 45)) are more accurate.
Interestingly, a recent research on Quetzalcoatlus suggested that their wing loading is even higher than previously estimated (49). The authors suggested narrower pterodactyloid wings, which are little or not attached to the hind limbs, while many previous studies adopted the wings that are attached to the hind limbs and have a broad, bat-like shape (16, 36, 52). Although no specific morphological estimates are provided in the study (49), if their argument is correct, Quetzalcoatlus would have had a smaller wing area, and thus even greater wing loading than previously estimated, resulting in less thermal soaring capability than that estimated in our study.
Anatomical studies of the azhdarchid pterosaurs have reported that their skeletal structure shows adaptations to terrestrial walking and suggested that they were terrestrial foragers (52, 53). Furthermore, a recent phylogenetic analysis showed that the azhdarchoid pterosaurs differed from other pterosaurs, in that they had evolved in a manner that increased the cost of transport for flapping flight and the sinking speed of gliding (26). Taking into account the adaptations for walking (52, 53), the humeri feature indicating flapping flight capability (50) but not sustainable flapping flight (16), the phylogenetic tendency of decreasing flight efficiency (26), and the low thermal soaring ability shown here, we suggest that the flight styles of Quetzalcoatlus and other similar-sized azhdarchid _s_pecies were similar to those of the bustard or ground hornbill that are short-range flyer and spend most of their time on land. Several previous studies overstated the flight ability of large azhdarchid pterosaurs such that they had a “capacity for nonstop flights exceeding 10,000 miles” (54) and an “unprecedented capacity for trans-continental flight" (Fig. 8 of (55)). However, our results indicate that these claims seem highly unlikely.
Pelagornis sandersi
As P. sandersi was found close to the coast, this species is thought to have lived an oceanic existence by soaring over the sea (1). Previously, it has been reported that P. sandersi was a dynamic soarer like the albatross, rather than a thermal soarer like frigatebirds (1). However, we argue that this species is highly adapted for thermal soaring. The conclusion of the previous study was based on the glide polars of P. sandersi, which were more similar to those of the wandering albatrosses than those of frigatebirds; glide performance was the only criterion used to evaluate its soaring style. In this study, we quantified other performances and the required wind conditions, which enabled us to evaluate the soaring style of P. sandersi from multiple perspectives.
Our results indicated that the dynamic soaring performance of P. sandersi was generally inferior to that of extant dynamic soaring species, although there were substantial variations depending on wind conditions and morphology estimates. One of the factors contributing to the poor dynamic soaring ability of this species was an inability to efficiently exploit the wind speed gradient due to long wings limiting the height above sea level at which the bird could fly. This effect could not be assessed using the glide polars alone.
Conversely, the thermal soaring ability of P. sandersi was outstanding, regardless of the morphology estimates used. The thermal soaring ability of an animal is largely dependent on its wing loading, as previously discussed. Therefore, the reason why P. sandersi showed such a high performance is because of its low wing loading despite its huge size. Considering that P. sandersi was found close to the coast, this species is expected to have been well-adapted to capture weak updrafts above the sea by using thermal soaring, and that it was able to stay aloft for a long period of time with limited flapping and traveled long distances, similar to frigatebirds (56).
Future issues
In this section, we discuss some of the simplifications used in this study and issues that we believe need to be addressed in the future. Below, we explore 3 issues with modeling flight: flight stability, wind environments, and discrepancy between model predictions and actual dynamic soaring speeds.
The first issue is flight stability. In this study, a steady wind environment was assumed, but actual wind environments fluctuate. In such a fluctuating real-world environment, stability is an important factor that determines the success or failure of flight (57–59). To simplify our calculations, we did not address stability, but it is important to examine the flight stability of these extinct and extant birds using more detailed morphological information in the future.
The second issue is that the actual wind environment experienced by both extinct and extant animals is still largely unknown.
For dynamic soaring, the specific form of the wind speed gradient experienced by birds is unknown—for example, whether there is a logarithmic or sigmoidal gust in the shadows of waves (44, 60). For this reason, we evaluated performance under various wind conditions (Fig. 3). For thermal soaring, it is also unknown how much updraft animals experience at a given circle radius or the distance between thermals. Recent advances in tracking technology have made it possible to record details of the motion of birds in dynamic and thermal soaring (51, 61–64). These data will provide information of the real wind environment experienced by soaring animals (64–68).
It is also important to consider the paleoenvironmental aspects of the wind environment at the time of the extinct species' inhabitation. For example, we showed that Quetzalcoatlus had a lower thermal soaring capacity than the extinct species. More detailed paleoclimatic estimates may help us to understand whether the species experienced a quite extreme wind environment to enable them to use thermal soaring as its primary mode of transport, even with their poor soaring up ability. As another example, we showed that Pteranodon and Pelagornis sandershi were oceanic thermal soarers like frigatebirds. Frigatebirds are distributed in trade wind zones with abundant updrafts (20,56); however, Pteranodon and Pelagornis had a wider distribution (1,53). These mismatches between extant and extinct oceanic thermal soaring species could reflect the difference in the climatic environment between the modern era and the era of the extinct giants.
Third, it should be noted that in our model of dynamic soaring, the maximum travel speed the animal could achieve was very high. Depending on the shape of the wind speed gradient assumed in our model, the animals reached maximum travel speeds of over 100 km/h even at realistic wind speeds of 5–10 m/s (Fig. 4), however, the average speeds reported using GPS for albatrosses and shearwaters were about 30–55 km/h (67, 69) (although, at wind speeds of around 20 m/s, an albatross was reported to travel at speeds of over 110 km/h for 9 hours (70)). There are 2 potential reasons for the discrepancy between this model and reality.
The first reason is that the actual shape of the wind speed gradient is likely to be more gradual than that assumed in the present study. It can be seen from our results in a sigmoidal wind gradient (Figures S1 and S2, Supplementary Material) that the gentler the wind speed variation (i.e. the larger the δ), the slower the maximum travel speed.
The second reason is that the upper limit of the bank angle change speed has not been considered. In dynamic soaring, there is a risk of wing failure due to the dynamic load on wings, which is higher than the static load during stable gliding as in thermal soaring. The risk of wing failure can be quantified by the ratio of the bending moment on the wing bones induced by lift to the stress that the bones can withstand. This ratio is called the “factor of safety” or “safety factor” (71–73). Animals should avoid situations with a low safety factor, limiting their bank angle change speed, and hence their flight speed. Few studies have quantified the safety factors of flying animals (72, 74), especially for extinct species, in part due to the need for detailed 3D geometrical data of bones and wings. However, Palmer's doctoral thesis (75) provides a plausible approach. Palmer quantified the safety factor along the wingspan of Pteranodon by applying the beam theory and vortex lattice method to the Pteranodon wing spar structural model. The computed safety factor was 2.5 at the first wing phalanx when Witton's mass estimates (9) were employed. Palmer concluded that this value is very low for a natural structure subjected to dynamic loading (73), suggesting that the dynamic load demand of dynamic soaring cannot be sustained by a Pteranodon wing. Applying Palmer's framework to other species would make for intriguing future research.
In view of the above 2 points, the dynamic soaring performance and the required wind conditions obtained from the present numerical calculation should not be taken literally by the values themselves. However, since all species were evaluated under the same assumptions, the relative values are meaningful indicators for the purpose of estimating soaring style by interspecies comparison, as was done in this study. A more refined analysis incorporating constraints on body rolling speed will be an interesting challenge in the future. For this purpose, actual measurements of bank angles in dynamic soaring birds and assessment of the wing bone structure and the lift force distributions along the wingspan in extant and extinct species will provide important information.
Understanding the soaring performance of extinct animals is an interdisciplinary issue. It is, therefore, essential to have a place for objective discussion between researchers with different backgrounds to bring their knowledge together, but such a platform seems to have been lacking in the past. In our approach, i.e. the physical model and the framework for comprehensively evaluating soaring performance, we have tried to clarify what assumptions were needed regarding the mechanics and the morphology of the animals. On the basis of our theoretical framework, it should, therefore, be easy for experts from various disciplines, including paleontologists, paleoclimatologists, engineers, and ornithologists, to examine the validity of the assumptions, examine new information, such as updated morphological data, and improve the model. We hope that our theoretical framework presented in this study will inspire researchers from various disciplines to work together to understand the soaring performance of extinct animals.
Materials and Methods
Quantification of soaring styles in previous studies
This section reviews previous studies on the soaring performance of extinct giant animals. In particular, we focus on which indices were quantitatively evaluated for each species.
Pelagornis sandersi
P. sandersi is predicted to be a dynamic soarer rather than a thermal soarer as its glide polar (and glide ratio that can be derived from its glide polar) is more similar to those of living dynamic soarers than those of living thermal soarers (1). However, this means the understanding of this species’ soaring style has been based on just 1 metric, that is, its glide ratio (Table 2). Hence, evaluating other metrics of this species could provide a more accurate estimate of the soaring style of this species. A previous study cautiously calculated the glide polars of P. sandersi for 24 combinations of estimates (Table 1) to deal with morphological uncertainty. Hence, we also employed these estimates in this study.
Argentavis magnificens
A. magnificens is expected to be a thermal soarer. A previous study reported that the thermal soaring performance and required wind conditions of this species were comparable to living thermal soaring species based on glide polars and circling envelopes (4). This result is consistent with the fact that an Argentavis specimen was found on the foothills and Pampas of Argentina, far from coastlines (4).
Pteranodon and Quetzalcoatlus
Although assessments of the soaring abilities of Pteranodon and Quetzalcoatlus have been a long-standing issue, there is still lack of a comprehensive understanding of their soaring style due to several uncertainties in the estimates of their morphology, especially because of the significant changes in weight estimates around 2010. Previously, it was estimated that Pteranodon had a wingspan of around 7 m and a body mass of 16 kg, while Quetzalcoatlus had a wingspan of around 11 m and a body mass of 50–70 kg. Based on these estimates, previous studies argued that they were adapted to thermal soaring (76, 77) and others argued that they could also employ dynamic soaring (33). Around 2010, however, several studies with different approaches suggested that pterosaurs were much heavier than previously expected (9, 14, 15) (Table 1). For example, Witton estimated that Pteranodon was 36.7 kg with a 6.0 m wingspan, and Quetzalcoatlus was 259 kg with a 9.6 m wingspan (9). Henderson estimated that Pteranodon was 18.6 kg with a 5.3 m wingspan, and Quetzalcoatlus was 544 kg with a 11.2 m wingspan (15). Witton and Habib argued that Pteranodon was a dynamic soarer and Quetzalcoatlus was a thermal soarer by comparing their morphology with those of extant soaring animals using PCA (9, 16, 41). Conversely, a recent study quantified the cost of transport and sinking speeds during gliding in pterosaur species and showed that azhdarchoid pterosaurs, including Quetzalcoatlus, had lower flight efficiency than the other pterosaurs (26). Despite these studies, the performance and wind requirements of dynamic and thermal soaring in these species have not been comprehensively quantified.
Furthermore, pterosaurs have a wing morphology that is completely different from that of birds and bats. Some studies reported that the wings of pterosaurs would have been associated with high-profile drag (34, 78). Palmer experimentally measured profile drag in a wind tunnel experiment using reconstructed pterosaur wings, and determined glide polars of _Pteranodon_-sized pterosaurs with various body mass estimates including the most recent heavy estimates (34). Palmer concluded that Pteranodon had the comparative thermal soaring ability to that of extant thermal soaring species, and that they adopted a slow flight speed. This conclusion was further reinforced by a subsequent work, which quantitatively showed that the pterosaur's wing membranes were not suited to fast flight (36).
In our analysis, we used the latest body mass estimates and drag coefficient estimates. For the drag coefficient, we used Palmer's experimental results (34). For body mass, there is still variation even among recent studies (9, 15). Therefore, for Pteranodon, we employed the 2 estimates by Henderson (15) and Witton (9). For Quetzalcoatlus, we only employed Witton's estimate (9), since Witton and Habib (16) pointed out a problem with applying Henderson's estimation method to giant azhdarchid pterosaurs.
Models
The dynamics of soaring animals are described using the equations of motion (EOM). We first describe the EOM and parameters therein. We then describe the calculation procedure for dynamic soaring and thermal soaring, respectively.
Aerodynamic forces and parameters
We regard an animal as a point of mass. We employ the frame of reference  (44). Then, the dynamics of the animal's 3D position
  and ground velocity
  are represented by the following EOMs:
 |
(1) |
|---|
and
 |
(2) |
|---|
When an animal is soaring, 3 forces—gravitation (mg), lift force (L), and drag force (D)—act on it. Gravitation mg is a product of the constant of gravitation (g) and mass of the bird (m kg), and its direction is toward the ground. The direction of the lift force**L** is dorsal and perpendicular to the air velocity,  , where
  represents the wind velocity. Drag force D is against the air velocity. For the analysis of dynamic soaring, we represent these EOMs in a different way by transforming the ground velocity to pitch
  , yaw
, yaw  , bank angle
  , and airspeed V (
 ). The yaw angle
  is the angle between
  and the projection of
  to the ij-plane, and the pitch angle
  is the angle between
  and the ij-plane and is positive nose down. We assumed that wind blow is along the _y_-axis and wind only depends on the altitude of the animal, i.e.
  . Under this formulation the EOMs area represented by the following equations (44):
 |
(3) |
|---|
 |
(4) |
|---|
 |
(5) |
|---|
 |
(6) |
|---|
 |
(7) |
|---|
and
 |
(8) |
|---|
where W(z) represents the wind gradient. A specific form is provided in the latter subsection. L represents the strength of the lift force, and D represents that of the drag force. The aerodynamic theory asserts that these values are
 |
(9) |
|---|
and
 |
(10) |
|---|
Here, _C_L represents the lift coefficient, _S_W represents the wing area, and ρ represents the air density and was set to ρ = 1.23 kg/m3 (26). This is the International Standard Atmosphere value for sea level at 15°C expressed as 3 significant digits (1). We employed this value because, based on a geochemical model of the carbon/sulfur cycle (79, 80), 20–23% of the air volume during the era of pterosaurs and giant extinct birds (approximately 70–6 Ma) was oxygen, which is almost the same as today (21%). We also tested the sensitivity of soaring performance to air density (See Air density dependence of soaring performance).
The drag is composed of 3 terms. The first term is the profile drag that stems from friction on the wing. _C_Dpro is the profile drag coefficient. The Flight software developed for evaluating bird flight performance employs 0.014 as the default value for the _CD_pro (21). This value is often used for birds (1) and even for pterosaurs (16). However, theory predicts that the profile drag coefficient varies with the lift coefficient following
 |
(11) |
|---|
and experimental results support this prediction (34, 81–83). Hence, for birds, we employed _C_Dpro,min = 0.019, _k_pro = 0.030, and _C_L,Dpro,min = 0.77, estimated from a jackdaw gliding in a wind tunnel (82). For pterosaurs, we obtained values from a wind tunnel experiment with reconstructed pterosaur wings (34). In the study (34), the reconstructed pterosaur wing span was approximately 6 m; however, we assumed that the result would not vary significantly with the size of Quetzalcoatlus. We quantified the position of data points in Fig. 3(b) of (34) using WebPlotdgitzer and fitted (Eq. 11) to the data points (see Figure S3, Supplementary Material). In (34), results of 2 types of wing sections are shown: faired wings and unfaired wings. For faired wings, we obtained _C_Dpro,min = 0.050, _k_pro = 0.11, and _C_L,Dpro,min = 1.0 and, for unfaired wings, _C_Dpro,min = 0.077, _k_pro = 0.065, and _C_L,Dpro,min = 0.89. Faired wings entail higher soaring efficiency compared to unfaired wings. For simplicity, we only show the results of faired wings in this study.
The second term is the parasite drag stemming from friction on the body, where the CDpar is the parasite drag coefficient, and _S_B is the body frontal area. We used the following recently recommended formula:
 |
(12) |
|---|
on the practical basis that neither _C_Dpar nor _S_B is exactly known (45).
The third term is the induced drag that stems from the lift force. Ra represents the aspect ratio (_R_a = _b_2/_S_W, where b is the wingspan). The k is the induced drag factor; we set k to 1.1, as in previous studies (1, 16, 21). The lift coefficient has a maximum value; for birds, we set _C_L to  1.8 (21). As the aerodynamic properties of pterosaurs can differ from those of birds, and the wind tunnel experiment indicated that _C_L could reach more than 2.0 (34), we set the pterosaurs’ lift coefficient to
  2.0.
2.0.
The remaining parameters in the EOMs are body mass (m), wingspan (b), and wing area (_S_w). For these morphological parameters of extant birds, we used values reported in previous studies (shown in Table 1).
The EOMs include variables that soaring animals can control, that is, bank angle  (t) and lift coefficient _C_L. Although these variables are time-dependent, for simplicity, we assumed that the animals keep their lift coefficients at a constant value. Hence, using a time series for bank angle, a constant value of _C_L, and values of parameters, the dynamics of the soaring animals were determined with EOM.
Quantification of the dynamic soaring performance and the minimum required wind speed
Wind gradient models
We explored 2 types of wind gradients. The first was the logarithmic model represented as
[Logarithmic wind gradient model]
 |
(13) |
|---|
This function is defined at z > _h_min. We set _h_min to 0.03 [m], following a previous study (40). _W_10 is the wind speed at height z = 10 m. This model is deemed to be a good model of the average wind field in the first 20 m above the sea surface, assuming a flat sea surface, and has been a popular approach in dynamic soaring modeling. However, recent studies argued that the real sea surface is not flat, and wind separations in ocean waves may occur more often than expected (60). To describe wind-separation-like wind profiles, a sigmoidal model has been proposed (44, 84). We also employed the sigmoidal wind model with a minor change, represented as
[Sigmoidal wind gradient model]
 |
(14) |
|---|
The _h_w determines the height of wind separation, as shown in Fig. 3. In this study, we set _h_w to 1, 3, and 5. The  is the thickness parameter. The wind speed changes with height (
 m). In a previous study, the wind shear thickness was speculated as approximately 1.5–7 m. Here, we set
  to 3/6 with a steep wind change, and 7/6 with a gentler change (Fig. 3).
Formulation to numerical optimization
The numerical computation of dynamic soaring performance and minimum wind speed boiled down to the restricted optimization problem (85). That is, a mathematical problem to find the values of (i) a certain variable Y that maximizes (ii) an objective function f(Y), satisfying (iii) equalities h(Y) = 0 and (iv) inequalities g(Y) ≤ 0. In the following, we describe the variables, object functions, equalities, and inequalities for dynamic soaring.
Variables
The dynamics of dynamic soaring animals are described by the 3D position (x(t), y(t), z(t)), pitch angle  , yaw angle
  , airspeed V(t), bank angle
  , lift coefficient _C_L, and the period of 1 dynamic soaring cycle
  . Among these variables, 3D position, pitch, yaw, bank, and airspeed are functions of time t (
 ). Optimization problems that include functions as variables are difficult to be directly solved. Therefore, we employed a collocation approach (43, 44). The collocation approach discretizes the variables in time, such as X(t) (
 ) to variables Xi = X((_i_-1)N/
 ) (i = 1, N), and converts the EOM to the equalities between those discretized variables. Hereafter, we use _X_1:N = {_X_1, _X_2, . . ., XN}. In this study, we set the number of discretization points to N = 51 in order to perform computations with reasonable accuracy within a reasonable amount of time. Accordingly, the variables of this optimization problem are position
  , pitch angle
 , yaw angle
  , airspeed
  , bank angle
  , lift coefficient _C_L, and a period of 1 soaring cycle
  . In addition, when computing the minimum wind speed required for sustainable dynamic soaring, _W_10 (log model) or _W_max (sigmoid model) were also treated as variables. Hence, the total number of variables were 7 × 51 + 2 (+1 [when computing the minimum wind speed]) = 359 (or 360).
Object function
First, we computed (1) the minimum wind speed required for sustainable dynamic soaring for each wind gradient model. As the objective function to minimize, we set _W_10 for the logarithmic model and _W_max for the sigmoidal model. Then, we computed (2) the maximum travel speed averaged over 1 dynamic soaring cycle by maximizing the object function to  . Finally, we computed (3) the maximum upwind speed averaged over 1 dynamic soaring cycle by maximizing the object function
  . With respect to the maximum travel speed and maximum windward speed, we computed these values for different wind speeds, that is, from the minimum required wind speed of the species to the highest minimum required wind speed among the examined species (i.e. Quetzalcoatlus) + 2 m/s. In this wind speed range, the maximum travel speed reached an unrealistically high value and/or the optimization calculation did not converge for some species. Thus, we stopped the computation of the maximum travel speed at the wind speed where the maximum travel speed exceeded 40 m/s (144 km/h).
Equalities
The first equalities to be fulfilled for dynamic soaring animals are given in Eqs. 3–8. The collocation approach converts the EOM into the equalities between the variables listed in the above section. As the number of original EOM was 6 and the number of discretization was 51, the EOM were converted into 6 × 51 = 306 equalities (see (43, 44) for the specific representations of these equalities).
The second type of equalities to be fulfilled were periodic boundary conditions of dynamic soaring: at the beginning and end of 1 dynamic soaring cycle, the state of the animal (i.e. pitch, yaw, airspeed, bank, and height) is the same, represented as
 |
(15) |
|---|
Inequalities
First, we assumed that there was a maximum limit of physical load on the animal. This is because dynamic soaring entails dynamic maneuvering, which results in a corresponding acceleration. We employed the approach of a previous study (40) that restricted the load factor (L/mg) to less than 3,
 |
(16) |
|---|
The second inequality was an important modification of the previous models. The height of the animal's wingtip above the sea surface (_z_wing) was calculated and represented as
 |
(17) |
|---|
Previous studies discarded the existence of the sea surface (44) or restricted birds to only flying higher than a given height (1.5 m) from the sea surface (40). However, the height an animal can fly depends on the wing length and the bank angle (e.g. with a shorter wing length and a lower bank angle, an animal can fly at a lower height). When dynamic soaring birds fly, they adjust their wingtips close to, but avoid touching, the sea surface (Fig. 3D). Dynamic soaring animals can exploit more flight energy when they pass through stronger wind speed gradients. As the wind speed difference is strong close to the sea surface, how close to the sea surface an animal can fly is crucial for dynamic soaring animals. Accordingly, long wings may restrict the minimum height at which the animal can fly and disturb efficient dynamic soaring. Hence, considering the effect of wings is crucial for evaluating dynamic soaring performances.
Third, we assumed that the height of the animal was higher than 0.5 m, that is
 |
(18) |
|---|
The optimization problem described here is a restricted nonlinear optimization problem. We used the SQP method to solve the problem with the “fmincon” function in MATLAB®萔 Ver R2019a.
Quantification of the thermal soaring performance and the required upward wind speed
For the computation of glide polars and circling envelopes, we followed a similar procedure to the Flight software, as described in (21), but modified some parameters and settings. Below, we outline the procedure and parameters employed in this study.
First, to compute the glide polars and circling envelopes, we needed to set rules regarding how gliding animals adjust their wingspan with respect to their airspeed. To achieve this, we used 2 wingspan adjustments: linear wingspan reduction and fixed wingspan (21). Although a fixed wingspan resulted in a better performance than linear wingspan reduction, we found no substantial differences in the results (see Fig. 5; Figures S4–S6 and Table S1, Supplementary Material). Hence, for birds, Fig. 5 shows the results of adopting linear wingspan reduction, which is Flight's default setting based on measurement of a jackdaw gliding in a wind tunnel (86). The default settings of Flight assume that wingspan, wing area, and thus aspect ratio linearly decreases with factor β = (_B_stop- V/VS)/(_B_stop- 1). Therefore, we replaced _b, S_W, and _R_a with _βb, βS_W, and _βR_a, respectively. In this equation, VS is the stall speed, the airspeed of the animal at the highest lift coefficient (i.e.  )); and _B_stop is a constant that determines the degree of wing reduction. We set _B_stop to 5, the default value in Flight. For pterosaurs, we show in Fig. 5 the results of a fixed wingspan. This is because, to the best of our knowledge, no study has yet shown a clear mechanism, whereby a membrane wing can be reduced in span and area without slacking the membrane. For reference, we also show results of the linear wingspan reduction, where _B_stop was set to 6, in Figures S4–S6 (Supplementary Material) and Table S1 (Supplementary Material). This is a value employed in a previous study (16), although no quantitative evidence for this value was provided therein.
Then, the glide polars were derived from the EOM, setting bank angle to 0, assuming that the pitch angle was small enough ( ) and considering the gliding animal was at kinematical equilibrium (
 ,
,  ). Sinking speed was represented as a function of airspeed V (21),
 |
(19) |
|---|
Note that we used Eq. 12 (_C_Dpar_S_B = 0.01_S_w; in this equation, _S_W is not replaced with _βS_W) to derive the above equation. Eqs. 11, 19, and the equilibrium relation,  , result in the following equation that gives a glide polar:
 |
(20) |
|---|
The horizontal speed is  . Thus, the maximum glide ratio is the maximum value of
  .
.
Next, we examined the circling envelope. We considered a situation where an animal is gliding on a circular track of radius r with a bank angle of  and the lift coefficient
  . The circle radius and the sinking speed in that situation (_V_Sink,Circle) is given by the airspeed V(
 ) and the sinking speed _V_Sink(
 ) when the animal is gliding along a straight track with a lift coefficient
  as below (87).
 |
(21) |
|---|
and
 |
(22) |
|---|
where  , and
, and  is obtained by substituting
  into Eq. 20.
There are 2 types of what we refer to as a "circling envelope” (21, 22, 88, 89). The circling envelope, proposed by Pennycuick (22), is an upper performance limit that an animal can achieve in the ascending phase of thermal soaring. The circling envelope was defined as a function that gives, for a circle radius r, a minimum sinking speed that an animal can achieve when gliding in a circle. Specifically, this is expressed as
 |
(23) |
|---|
At the limit where  (i.e.
(i.e.  , this represents straight gliding flight with minimum sinking speed. The
  on the circling envelope varies with radius, and in the small radius region, it reaches to the maximum lift coefficient. This means that the animal is flying at a stall speed. Note that r should be larger than
  , which is the limit of
  and
and  . This minimum value is referred to as the limiting radius, i.e. the animal cannot achieve a circle radius smaller than this.
Furthermore, what Pennycuick newly called a circling envelope was a plot of Eqs. 21 and 22 as parametric equations with  as the mediating variable, assuming
  to be constant (21). As for
  , the lift coefficient minimizing the sinking speed during a straight glide was employed (21) (although there is a study that employed the maximum lift coefficient (90)). In this definition, at the limit where
  , as in the former circling envelope, the animal is gliding in a straight line with a minimum sinking speed, but the limiting radius for
  is greater than the former. This is because the latter circling envelope assumes that the animal does not change its lift coefficient regardless of the circle radius. In other words, the former circling envelope shows an upper limit of the animal's capabilities, whereas the latter implicitly assumes that the animal is circling with some margin of safety that avoids the risk of stalling.
In recent years, the latter has often been used to determine the circling envelope (21, 51, 90). However, as the wings of pterosaurs are expected to have been able to achieve a higher maximum lift coefficient than that of birds (34), pterosaurs might have had a greater advantage than birds in increasing the lift coefficient when circling with a narrow radius. Therefore, to account for these differences, we evaluated both circling envelope definitions in this study. The 2 circling envelopes differed in the small circle radius, but there was no significant change in the relative performance relationship between the species. See Fig. 5 and Figure S5 (Supplementary Material) for results of the former and Figure S6 (Supplementary Material) for the latter results. The limiting radius, minimum sinking speed in straight gliding, maximum glide ratio, and horizontal speed at maximum glide ratio are shown in Table S1 (Supplementary Material) for the 2 wing reduction methods and 2 circling envelope definition. For ASK 14, the measured glide polar (  ) and the circling envelope of the former definition setting maximum lift coefficient to 1.3, reported in a previous study (22), are presented.
Air density dependence of soaring performance
To test the sensitivity to the air density, we also evaluated the soaring performance in high air density environments that pterosaurs and giant birds would have never experienced, i.e. at an air density of 1.2 times the current level (1.48 kg/m3). This air density corresponds to the value that would be obtained if the oxygen concentration increased to 30% and the amount of other components were equal to those in the present day (91). This air density is also expected to be higher than that during the eras of pterosaurs and giant extinct birds, as the concentration of oxygen reached 30%, approximately 300 Ma (Permian period), and had already decreased to a value comparable to modern day air in the eras of giant pterosaurs and giant extinct birds (70–6 Ma) (80).
We evaluated the dynamic soaring performances of P. sandersi and Pteranodon under this higher air density (see Figure S7, Supplementary Material) with wind gradient shown in Fig. 3. Although the higher air density resulted in a slightly lower minimum wind speed required for dynamic soaring, the qualitative results were similar to those obtained with the modern day air density (see Figure S7, Supplementary Material). We also evaluated the thermal soaring performance of Quetzalcoatlus under the higher air density (see Figure S8, Supplementary Material). Despite the high air density, the thermal soaring capability of Quetzalcoatlus remained low. Overall, our results were robust to air density uncertainty.
Supplementary Material
pgac023_Supplemental_File
ACKNOWLEDGEMENTS
General: the authors thank Chihiro Kinoshita for illustrating Fig. 1; Shin-ichi Fujiwara, Sophia Friesen, and Michael Le Page for reading the draft or preprint of this paper and for providing valuable comments; Hiroshi Niino for providing valuable comments on the effect of air density on wind gradient; Hodaka Kawahata, Ayako Abe-Ouchi, Ryu Uemura, and Kenichiro Sugitani for providing valuable information about the paleo atmospheric environment; Masaru Naruoka, Yurika Sugihara, and Yudai Okada for providing valuable information about the glider flight; and 3 anonymous reviewers for their valuable comments.
Notes
Competing Interest: The authors declare no competing interest.
Contributor Information
Yusuke Goto, Centre d'Etudes Biologiques de Chizé, CNRS, 79360 Villiers En Bois, France; Graduate School of Environmental Studies, Nagoya University, Furo, Chikusa, Nagoya 464-8601, Japan.
Ken Yoda, Graduate School of Environmental Studies, Nagoya University, Furo, Chikusa, Nagoya 464-8601, Japan.
Henri Weimerskirch, Centre d'Etudes Biologiques de Chizé, CNRS, 79360 Villiers En Bois, France.
Katsufumi Sato, Atmosphere and Ocean Research Institute, The University of Tokyo, Kashiwanoha, Kashiwa, Chiba, 277-8564, Japan.
Funding
This study was financially supported by the Grants-in-Aid for Scientific Research from the Japan Society for the Promotion of Science (16H06541, 16H01769, and 21H05294), and the JST CREST (grant number JPMJCR1685, Japan). The authors also received financial support from the JSPS as part of an Overseas Research Fellowship program.
Authors' Contributions
Y.G., K.Y., H.W., and K.S. designed the study; Y.G. conducted the computation; and all the authors participated in the writing of the manuscript (Y.G. wrote the first draft).
Data Availability
All data needed to evaluate the conclusions in the paper are present in the paper and the Supplementary Materials.
References
- 1.Ksepka DT. 2014. Flight performance of the largest volant bird. Proc Natl Acad Sci. 111(29):10624–10629. [DOI] [PMC free article] [PubMed] [Google Scholar]
- 2.Campbell KE Jr, Tonni EP. 1981. Preliminary observations on the paleobiology and evolution of teratorns (Aves: Teratornithidae). J Vertebr Paleontol. 1(3–4):265–272. [Google Scholar]
- 3.Campbell KE Jr, Tonni EP. 1983. Size and locomotion in teratorns (Aves: Teratornithidae). Auk. 100(2):390–403. [Google Scholar]
- 4.Chatterjee S, Templin RJ, Campbell KE. 2007. The aerodynamics of Argentavis, the world's largest flying bird from the Miocene of Argentina. Proc Natl Acad Sci. 104(30):12398–12403. [DOI] [PMC free article] [PubMed] [Google Scholar]
- 5.Louchart A, Haile-Selassie Y, Vignaud P, Likius A, Brunet M. 2008. Fossil birds from the late Miocene of Chad and Ethiopia and zoogeographical implications. Oryctos. 7(147):e167. [Google Scholar]
- 6.Kloess PA, Poust AW, Stidham TA. 2020. Earliest fossils of giant-sized bony-toothed birds (Aves: Pelagornithidae) from the Eocene of Seymour Island, Antarctica. Sci Rep. 10:18286. [DOI] [PMC free article] [PubMed] [Google Scholar]
- 7.Degrange FJ, Tambussi CP, Taglioretti ML, Scaglia FA. 2021. Phylogenetic affinities and morphology of the Pliocene cathartiform Dryornis pampeanus Moreno & Mercerat. Pap Palaeontol. 1–16. [Google Scholar]
- 8.Bennett CS. 2001. The osteology and functional morphology of the late cretaceous pterosaur pteranodon. Stuttgart: Schweizerbart. [Google Scholar]
- 9.Witton MP. 2008. A new approach to determining pterosaur body mass and its implications for pterosaur flight. Zitteliana. B28:143–158. [Google Scholar]
- 10.Frey E, Martill DM. 1996. A reappraisal of Arambourgiania (Pterosauria, Pterodactyloidea): one of the world's largest flying animals. Neues Jahrbuch für Geologie und Paläontologie - Abhandlungen . 199:221–247. [Google Scholar]
- 11.Buffetaut E, Grigorescu D, Csiki Z. 2003. Giant azhdarchid pterosaurs from the terminal Cretaceous of Transylvania (western Romania). Geol Soc Lond Spec Publ. 217(1):91–104. [Google Scholar]
- 12.Hone DWE, Habib MB, Therrien F. 2019. Cryodrakon boreas, gen. et sp. nov., a late cretaceous Canadian azhdarchid pterosaur. J Vertebr Paleontol. 39(3):e1649681. [Google Scholar]
- 13.Vremir M, Dyke G, Csiki-Sava Z, Grigorescu D, Buffetaut E. 2018. Partial mandible of a giant pterosaur from the uppermost Cretaceous (Maastrichtian) of the Hațeg Basin, Romania. Lethaia. 51(4):493–503. [Google Scholar]
- 14.Sato K, et al. . 2009. Scaling of soaring seabirds and implications for flight abilities of giant pterosaurs. PLoS ONE. 4(4):e5400. [DOI] [PMC free article] [PubMed] [Google Scholar]
- 15.Henderson DM. 2010. Pterosaur body mass estimates from three-dimensional mathematical slicing. J Vertebr Paleontol. 30(3):768–785. [Google Scholar]
- 16.Witton MP, Habib MB. 2010. On the size and flight diversity of giant pterosaurs, the use of birds as pterosaur analogues and comments on pterosaur flightlessness. PLoS ONE. 5(11):e13982. [DOI] [PMC free article] [PubMed] [Google Scholar]
- 17.Shaffer SA, Weimerskirch H, Costa DP. 2001. Functional significance of sexual dimorphism in wandering albatrosses, Diomedea exulans. Funct Ecol. 15(2):203–210. [Google Scholar]
- 18.Phillips RA, Silk JRD, Phalan B, Catry P, Croxall JP. 2004. Seasonal sexual segregation in two Thalassarche albatross species: competitive exclusion, reproductive role specialization or foraging niche divergence?. Proc R Soc Lond B Biol Sci. 271(1545):1283–1291. [DOI] [PMC free article] [PubMed] [Google Scholar]
- 19.Pennycuick CJ. 1987. Flight of auks (Alcidae) and other northern seabirds compared with southern Procellariiformes: ornithodolite observations. J Exp Biol. 128(1):335–347. [Google Scholar]
- 20.Pennycuick CJ. 1983. Thermal soaring compared in three dissimilar tropical bird species, Fregata magnificens, Pelecanus occidentals and Coragyps atratus. J Exp Biol. 102(1):307–325. [Google Scholar]
- 21.Pennycuick CJ. 2008. Modelling the flying bird. Amsterdam: Elsevier. [Google Scholar]
- 22.Pennycuick CJ. 1971. Gliding flight of the white-backed vulture Gyps africanus. J Exp Biol. 55(1):13–38. [Google Scholar]
- 23.Hankin EH, Watson DMS. 1914. On the flight of pterodactyls. Aeronaut J. 18(72):324–335. [Google Scholar]
- 24.Mayr G, De Pietri VL, Love L, Mannering A, Scofield RP. 2021. Oldest, smallest and phylogenetically most basal pelagornithid, from the early Paleocene of New Zealand, sheds light on the evolutionary history of the largest flying birds. Pap Palaeontol. 7(1):217–233. [Google Scholar]
- 25.Benson RBJ, Frigot RA, Goswami A, Andres B, Butler RJ. 2014. Competition and constraint drove Cope's rule in the evolution of giant flying reptiles. Nat Commun. 5(1):1–8. [DOI] [PMC free article] [PubMed] [Google Scholar]
- 26.Venditti C, Baker J, Benton MJ, Meade A, Humphries S. 2020. 150 million years of sustained increase in pterosaur flight efficiency. Nature. 587:83–86. [DOI] [PubMed] [Google Scholar]
- 27.Pennycuick CJ. 1968. Power requirements for horizontal flight in the pigeon Columba livia. J Exp Biol. 49(3):527–555. [Google Scholar]
- 28.Ellington CP. 1991. Limitations on animal flight performance. J Exp Biol. 160(1):71–91. [Google Scholar]
- 29.Liu T. 2006. Comparative scaling of flapping-and fixed-wing flyers. AIAA J. 44(1):24–33. [Google Scholar]
- 30.Habib MB. 2008. Comparative evidence for quadrupedal launch in pterosaurs. Zitteliana. B29:159–166. [Google Scholar]
- 31.Cannell AER. 2020. Too big to fly? An engineering evaluation of the fossil biology of the giant birds of the Miocene in relation to their flight limitations, constraining the minimum air pressure at about 1.3 bar. Anim Biol. 70:251–270. [Google Scholar]
- 32.Williams HJ, et al. . 2020. Physical limits of flight performance in the heaviest soaring bird. Proc Natl Acad Sci. 117(30):17884–17890. [DOI] [PMC free article] [PubMed] [Google Scholar]
- 33.Chatterjee S, Templin RJ. 2004. Posture, locomotion, and paleoecology of pterosaurs. Boulder (CO): Geological Society of America. [Google Scholar]
- 34.Palmer C. 2011. Flight in slow motion: aerodynamics of the pterosaur wing. Proc R Soc B Biol Sci. 278(1713):1881–1885. [DOI] [PMC free article] [PubMed] [Google Scholar]
- 35.Stokes IA, Lucas AJ. 2021. Wave-slope soaring of the brown pelican. Move Ecol. 9(1):1–13. [DOI] [PMC free article] [PubMed] [Google Scholar]
- 36.Palmer C. 2018. Inferring the properties of the pterosaur wing membrane. Geol Soc Lond Spec Publ. 455(1):57–68. [Google Scholar]
- 37.Sachs GP. 2019. Maximum travel speed performance of albatrosses and UAVs using dynamic soaring. Proceedings of the 2019 AIAA Science and Technology Forum and Exposition (SciTech). San Diego (CA). p. 568. [Google Scholar]
- 38.Richardson PL. 2015. Upwind dynamic soaring of albatrosses and UAVs. Prog Oceanogr. 130:146–156. [Google Scholar]
- 39.Sachs G. 2016. In-flight measurement of upwind dynamic soaring in albatrosses. Prog Oceanogr. 142:47–57. [Google Scholar]
- 40.Sachs G. 2005. Minimum shear wind strength required for dynamic soaring of albatrosses. Ibis. 147(1):1–10. [Google Scholar]
- 41.Rayner JM V. 1988. Form and function in avian flightIn: Current ornithology. Berlin, Heidelberg: Springer, pp 1–66. [Google Scholar]
- 42.Norberg UM, Rayner JMV. 1987. Ecological morphology and flight in bats (Mammalia; Chiroptera): wing adaptations, flight performance, foraging strategy and echolocation. Philos Trans R Soc Lond B Biol Sci. 316(1179):335–427. [Google Scholar]
- 43.Zhao YJ. 2004. Optimal patterns of glider dynamic soaring. Optim Cont App Methods. 25(2):67–89. [Google Scholar]
- 44.Bousquet GD, Triantafyllou MS, Slotine J-JE. 2017. Optimal dynamic soaring consists of successive shallow arcs. J R Soc Interface. 14(135):20170496. [DOI] [PMC free article] [PubMed] [Google Scholar]
- 45.Taylor GK, Thomas ALR. 2014. Evolutionary biomechanics: selection, phylogeny, and constraint. In: Oxford series in ecology and evolution. Oxford: Oxford University Press. [Google Scholar]
- 46.Maughmer M. 2003. The evolution of sailplane wing design. Proceedings of the AIAA International Air and Space Symposium and Exposition: The Next 100 Years. Dayton (OH). 2777. [Google Scholar]
- 47.Thomas F. 2003. 100 years of sailplane design and beyond. Tech Soar. 27(3–4):61–74. [Google Scholar]
- 48.Witton MP. 2013. Pterosaurs: natural history, evolution, anatomy. Princeton (NJ): Princeton University Press. [Google Scholar]
- 49.Padian K, Cunningham JR, Langston JRW, Conway J. 2021. Functional morphology of Quetzalcoatlus Lawson 1975 (Pterodactyloidea: Azhdarchoidea). J Vertebr Paleontol. 41(sup1):218–251. [Google Scholar]
- 50.Bennett SC. 2003. Morphological evolution of the pectoral girdle of pterosaurs: myology and function. Geol Soc Lond Spec Publ. 217(1):191–215. [Google Scholar]
- 51.Williams HJ, et al. . 2018. Vultures respond to challenges of near-ground thermal soaring by varying bank angle. J Exp Biol. 221(23). [DOI] [PubMed] [Google Scholar]
- 52.Witton MP, Naish D. 2008. A reappraisal of azhdarchid pterosaur functional morphology and paleoecology. PLoS ONE. 3(5):e2271. [DOI] [PMC free article] [PubMed] [Google Scholar]
- 53.Witton MP, Naish D. 2013. Azhdarchid pterosaurs: water-trawling pelican mimics or “terrestrial stalkers”?. Acta Palaeontol Pol. 60(3):651–660. [Google Scholar]
- 54.Habib MB. 2010. 10,000 miles: maximum range and soaring efficiency of azhdarchid pterosaurs. J Vertebr Paleontol. 30(sup2):99A. [ 10.1080/02724634.2010.10411819] [DOI] [Google Scholar]
- 55.Naish D, Witton MP, Martin-Silverstone E. 2021. Powered flight in hatchling pterosaurs: evidence from wing form and bone strength. Sci Rep. 11:13130. [DOI] [PMC free article] [PubMed] [Google Scholar]
- 56.Weimerskirch H, Bishop C, Jeanniard-du-Dot T, Prudor A, Sachs G. 2016. Frigate birds track atmospheric conditions over months-long transoceanic flights. Science. 353(6294):74–78. [DOI] [PubMed] [Google Scholar]
- 57.Palmer C, Dyke G. 2012. Constraints on the wing morphology of pterosaurs. Proc R Soc B Biol Sci. 279(1731):1218–1224. [DOI] [PMC free article] [PubMed] [Google Scholar]
- 58.Sachs G, Weimerskirch H. 2018. Flight of frigatebirds inside clouds–energy gain, stability and control. J Theor Biol. 448:9–16. [DOI] [PubMed] [Google Scholar]
- 59.Swaminathan B, Mohan R. 2018. On the stability of dynamic soaring orbits of UAVs. Proceedings of the 2018 Atmospheric Flight Mechanics Conference. Atlanta (GA). p. 2832. [Google Scholar]
- 60.Buckley MP, Veron F. 2016. Structure of the airflow above surface waves. J Phys Oceanogr. 46(5):1377–1397. [Google Scholar]
- 61.Sachs G, Traugott J, Nesterova AP, Bonadonna F. 2013. Experimental verification of dynamic soaring in albatrosses. J Exp Biol. 216(22):4222–4232. [DOI] [PubMed] [Google Scholar]
- 62.Harel R, Horvitz N, Nathan R. 2016. Adult vultures outperform juveniles in challenging thermal soaring conditions. Sci Rep. 6:27865. [DOI] [PMC free article] [PubMed] [Google Scholar]
- 63.Sherub S, Bohrer G, Wikelski M, Weinzierl R. 2016. Behavioural adaptations to flight into thin air. Biol Lett. 12(10):20160432. [DOI] [PMC free article] [PubMed] [Google Scholar]
- 64.Shimatani IK, Yoda K, Katsumata N, Sato K. 2012. Toward the quantification of a conceptual framework for movement ecology using circular statistical modeling. PLoS ONE. 7(11):e50309. [DOI] [PMC free article] [PubMed] [Google Scholar]
- 65.Treep J, et al. . 2015. Using high resolution GPS tracking data of bird flight for meteorological observations. Bull Am Meteorol Soc. 97:951–961. [Google Scholar]
- 66.Weinzierl R, et al. . 2016. Wind estimation based on thermal soaring of birds. Ecol Evol. 6(24):8706–8718. [DOI] [PMC free article] [PubMed] [Google Scholar]
- 67.Yonehara Y, et al. . 2016. Flight paths of seabirds soaring over the ocean surface enable measurement of fine-scale wind speed and direction. Proc Natl Acad Sci. 113:9039–9044. [DOI] [PMC free article] [PubMed] [Google Scholar]
- 68.Goto Y, Yoda K, Sato K. 2017. Asymmetry hidden in birds’ tracks reveals wind, heading, and orientation ability over the ocean. Sci Adv. 3(9):e1700097. [DOI] [PMC free article] [PubMed] [Google Scholar]
- 69.Péron C, et al. . 2010. Seasonal variation in oceanographic habitat and behaviour of white-chinned petrels Procellaria aequinoctialis from Kerguelen Island. Mar Ecol Prog Ser. 416:267–284. [Google Scholar]
- 70.Catry P, Phillips RA, Croxall JP. 2004. Sustained fast travel by a gray-headed albatross (Thalassarche chrysostoma) riding an Antarctic storm. The Auk. 121(4):1208–1213. [Google Scholar]
- 71.Alexander RM. 1981. Factors of safety in the structure of animals. Sci Prog. 67:109–130. [PubMed] [Google Scholar]
- 72.Kirkpatrick SJ. 1994. Scale effects on the stresses and safety factors in the wing bones of birds and bats. J Exp Biol. 190(1):195–215. [DOI] [PubMed] [Google Scholar]
- 73.Palmer C, Dyke GJ. 2010. Moving on from Kirkpatrick: estimating ‘safety factors’ for flying vertebrates. J Exp Biol. 213(12):2174. [DOI] [PubMed] [Google Scholar]
- 74.Biewener AA, Dial KP. 1995. In vivo strain in the humerus of pigeons (Columba livia) during flight. J Morphol. 225(1):61–75. [Google Scholar]
- 75.Palmer C. 2015. Flexible fliers: the flight of pterosaurs. unpublished PhD thesis. Bristol: University of Bristol. [last accessed 2022 April 2]. http://flightsoffancy.me//pterowing/phd/. [Google Scholar]
- 76.Bramwell CD, Whitfield GR. 1974. Biomechanics of pteranodon. Philos Trans R Soc Lond B Biol Sci. 267(890):503–581. [Google Scholar]
- 77.Brower JC. 1983. The aerodynamics of Pteranodon and Nyctosaurus, two large pterosaurs from the Upper Cretaceous of Kansas. J Vertebr Paleontol. 3(2):84–124. [Google Scholar]
- 78.Wilkinson MT, Unwin DM, Ellington CP. 2006. High lift function of the pteroid bone and forewing of pterosaurs. Proc R Soc B Biol Sci. 273(1582):119–126. [DOI] [PMC free article] [PubMed] [Google Scholar]
- 79.Berner RA. 2006. GEOCARBSULF: a combined model for Phanerozoic atmospheric O2 and CO2. Geochim Cosmochim Acta. 70(23):5653–5664. [Google Scholar]
- 80.Berner RA. 2009. Phanerozoic atmospheric oxygen: new results using the GEOCARBSULF model. Am J Sci. 309(7):603–606. [Google Scholar]
- 81.Tucker VA. 1987. Gliding birds: the effect of variable wing span. J Exp Biol. 133(1):33–58. [Google Scholar]
- 82.KleinHeerenbrink M, Warfvinge K, Hedenström A. 2016. Wake analysis of aerodynamic components for the glide envelope of a jackdaw (Corvus monedula). J Exp Biol. 219(10):1572–1581. [DOI] [PubMed] [Google Scholar]
- 83.Carruthers AC, Walker SM, Thomas ALR, Taylor GK. 2010. Aerodynamics of aerofoil sections measured on a free-flying bird. Proc Inst Mech Eng Part G J Aerosp Eng. 224(8):855–864. [Google Scholar]
- 84.Bird JJ, Langelaan JW, Montella C, Spletzer J, Grenestedt JL. 2014. Closing the loop in dynamic soaring. Proceedings of the AIAA Guidance, Navigation, and Control Conference. Portland (OR). p. 263. [Google Scholar]
- 85.Nocedal J, Wright S. 2006. Numerical optimization. Berlin, Heidelberg: Springer Science & Business Media. [Google Scholar]
- 86.Rosén M, Hedenstrom A. 2001. Gliding flight in a jackdaw: a wind tunnel study. J Exp Biol. 204(6):1153–1166. [DOI] [PubMed] [Google Scholar]
- 87.Haubenhofer M. 1964. Die Mechanik Des Kurvenfluges. Braunschweig: OSTIV Publ 7. [Google Scholar]
- 88.Norberg UM. 2012. Vertebrate flight: mechanics, physiology, morphology, ecology and evolution. Berlin, Heidelberg: Springer Science & Business Media. [Google Scholar]
- 89.Lindhe-Norberg UM, Brooke AP, Trewhella WJ. 2000. Soaring and non-soaring bats of the family Pteropodidae (flying foxes, Pteropus spp.): wing morphology and flight performance. J Exp Biol. 203(3):651–664. [DOI] [PubMed] [Google Scholar]
- 90.Serrano FJ, Chiappe LM. 2017. Aerodynamic modelling of a cretaceous bird reveals thermal soaring capabilities during early avian evolution. J R Soc Interface. 14(132):20170182. [DOI] [PMC free article] [PubMed] [Google Scholar]
- 91.Poulsen CJ, Tabor C, White JD. 2015. Long-term climate forcing by atmospheric oxygen concentrations. Science. 348(6240):1238–1241. [DOI] [PubMed] [Google Scholar]
Associated Data
This section collects any data citations, data availability statements, or supplementary materials included in this article.
Supplementary Materials
pgac023_Supplemental_File
Data Availability Statement
All data needed to evaluate the conclusions in the paper are present in the paper and the Supplementary Materials.