Regulation of fatty acid homeostasis in cells: novel role of leptin - PubMed (original) (raw)
Regulation of fatty acid homeostasis in cells: novel role of leptin
R H Unger et al. Proc Natl Acad Sci U S A. 1999.
Abstract
It is proposed that an important function of leptin is to confine the storage of triglycerides (TG) to the adipocytes, while limiting TG storage in nonadipocytes, thus protecting them from lipotoxicity. The fact that TG content in nonadipocytes normally remains within a narrow range, while that of adipocytes varies enormously with food intake, is consistent with a system of TG homeostasis in normal nonadipocytes. The facts that when leptin receptors are dysfunctional, TG content in nonadipocytes such as islets can increase 100-fold, and that constitutively expressed ectopic hyperleptinemia depletes TG, suggest that leptin controls the homeostatic system for intracellular TG. The fact that the function and viability of nonadipocytes is compromised when their TG content rises above or falls below the normal range suggests that normal homeostasis of their intracellular TG is critical for optimal function and to prevent lipoapoptosis. Thus far, lipotoxic diabetes of fa/fa Zucker diabetic fatty rats is the only proven lipodegenerative disease, but the possibility of lipotoxic disease of skeletal and/or cardiac muscle may require investigation, as does the possible influence of the intracellular TG content on autoimmune and neoplastic processes.
Figures
Figure 1
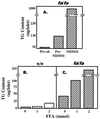
TG content of islets. (A) TG content of islets isolated from obese ZDF (fa/fa) at age of 4 weeks (preobese), 8 weeks (obese, prediabetic, Pre-NIDDM), and 12 weeks (obese, diabetic, NIDDM). (B) TG content of islets isolated from normal lean ZDF (+/+) rats and cultured in 0, 1, or 2 mM FA. (C) TG content of islets isolated from age-matched obese prediabetic ZDF (fa/fa) rats and cultured in 0, 1, or 2 mM FA.
Figure 2
Insulin and GLUT-2 immunostaining in islets of nondiabetic and diabetic ZDF rats. (A and B) Consecutive sections of a nondiabetic female rat islet. The intense cytoplasmic insulin immunofluorescence is seen in the densely packed insulin cells in the islet’s center (A). GLUT-2 staining elicits a delicate immunofluorescent rim at the periphery of insulin cells (B). (Bar = 20 μm.) (C and D) Consecutive sections of a diabetic male rat islet. Insulin-immunofluorescent cells are in reduced numbers as compared with A and appear in cords separated by tracks of connective tissue (C). The GLUT-2 antibody elicits no staining at the periphery of insulin cells (D). (Bar = 20 μm.)
Figure 3
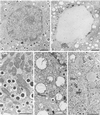
Nuclear and cytoplasmic lesions in insulin-secreting cells of diabetic ZDF rats. (A) Low-power electron micrograph of a control insulin cell. This equatorial section shows the nucleus, the nucleolus, and the peripheral zone of heterochromatin on the inner side of the nuclear envelope; the section also shows a large area of cytoplasm containing a population of dense core secretory granules, a few mitochondria, and various membrane profiles belonging to the endoplasmic reticulum and Golgi apparatus compartments. (Bar = 2 μm.) (B) Low-power electron micrograph of an insulin cell in a diabetic ZDF rat. In this plane of section comparable to that in A, the nucleus appears markedly altered with a near complete disappearance of the euchromatin region replaced by a finely granular clear substance. Clumped chromatin masses indicative of classical apoptotic reaction also are observed in rare cells. The cytoplasm is markedly depleted in secretory granules and a large number of vacuoles represent the remnants of damaged mitochondria (see D). (Bar = 2 μm.) (C) Medium-power electron micrograph showing the typical morphology of the secretory granules, mitochondria, and endoplasmic reticulum compartments in a control insulin cell. (Bar = 1 μm.) (D) Field of an insulin cell in a diabetic ZDF rat showing a marked dilatation of the mitochondria and widespread rupture of the cristae. The RE-Golgi compartments appear relatively unaffected. (Bar = 1 μm.) Mitochondrial damage was quantitated. In the older (10–12 wk) and more hyperglycemic diabetic ZDF rats, the number of altered mitochondria was on average 98% of the total mitochondria present (three rats, three islets per rat, eight cells per islet, 1,475 mitochondria evaluated). One rat in the diabetic ZDF population (8 wk, moderately hyperglycemic), was completely “unreactive” with respect to mitochondrial damage (two islets, 555 mitochondria evaluated). In the control rat population, whether older or younger, the percentage of altered mitochondria was never above 4% (six rats, three islets per rat, eight cells per islet, 4,515 mitochondria evaluated). (E) Field of an insulin cell in a ZDF rat showing a cytoplasmic region with two altered mitochondrial profiles, but with several lipid droplets and glycogen deposits. On random sections lipid droplets were rare. When serially sectioned, several β cells that did not show lipid inclusion on one section contained lipid on the next consecutive sections. (Bar = 1 μm.)
Figure 4
(A) Depiction of the putative homeostatic system in normal nonadipocytes (islets). FA stimulate PPARα, acyl CoA oxidase (ACO), and carnitine palmitoyl transferase 1 (CPT-1) expression, increasing their oxidation and minimizing TG formation. (B) In nonadipocytes (islets) of leptin-resistant ZDF (fa/fa) rats, this homeostatic system is nonfunctional. PPARα is low and expression of PPARγ and the lipogenic enzymes, acetyl CoA carboxylase (ACC), and FA synthetase (FAS) is increased, leading to TG accumulation (10). PPRE, PPAR response element.
Figure 5
Effect of overexpression of wild-type OB-Rb or β-galactosidase cDNA in islets of obese, diabetic (fa/fa) ZDF rats on (A) leptin signaling, phosphorylated STAT-3; (B) lipid metabolism, PPARa mRNA and TG content; (C) β-cell function, GLUT-2 protein, glucokinase (GK) protein, and glucose-stimulated insulin secretion (GSIS); (D) β-cell viability, serine-palmitoyl transferase (SPT) mRNA, inducible NO synthetase (iNOS) mRNA, Bcl-2 mRNA, and DNA fragmentation. See text for further description. Values for OB-Rb-overexpressing islets are expressed as % of β-galactosidase-overexpressing controls.
Figure 6
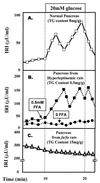
Effect of TG content of islets on β-cell function. (A) Insulin secretory response to glucose in perfused pancreata of normal rats. (B) Insulin response to glucose in pancreata from fat-depleted hyperleptinemic rats perfused with or without FA in the perfusate. (C) Insulin response to glucose of fat-laden pancreata from obese, diabetic (fa/fa) ZDF rats. IRI, immunoreactive insulin.
Figure 7
(A) Comparison of ceramide formation in islets from normal lean (+/+) ZDF rats or obese, prediabetic (fa/fa) ZDF rats cultured in 1 mM FA. (B) Comparison of [3H]ceramide formation from [3H]palmitate in islets of +/+ and fa/fa rats cultured in the presence or absence of fumonisin-B1 (FB1), an inhibitor of de novo ceramide synthesis. (C) NO formation in islets from obese, prediabetic (fa/fa) ZDF rats cultured in 0 or 1 mM FA. (D) The effect of an acyl CoA synthetase inhibitor, triacsin-C, and of the inhibitor of the inducible NO synthetase, aminoguanidine (AG) on DNA laddering induced by 1 mM FA. DNA laddering is an index of apophosis.
Figure 8
The proposed pathway of lipoapoptosis and loci of intervention.
Similar articles
- Lipotoxic diseases of nonadipose tissues in obesity.
Unger RH, Orci L. Unger RH, et al. Int J Obes Relat Metab Disord. 2000 Nov;24 Suppl 4:S28-32. doi: 10.1038/sj.ijo.0801498. Int J Obes Relat Metab Disord. 2000. PMID: 11126236 Review. - Liporegulation in diet-induced obesity. The antisteatotic role of hyperleptinemia.
Lee Y, Wang MY, Kakuma T, Wang ZW, Babcock E, McCorkle K, Higa M, Zhou YT, Unger RH. Lee Y, et al. J Biol Chem. 2001 Feb 23;276(8):5629-35. doi: 10.1074/jbc.M008553200. Epub 2000 Nov 28. J Biol Chem. 2001. PMID: 11096093 - Direct antidiabetic effect of leptin through triglyceride depletion of tissues.
Shimabukuro M, Koyama K, Chen G, Wang MY, Trieu F, Lee Y, Newgard CB, Unger RH. Shimabukuro M, et al. Proc Natl Acad Sci U S A. 1997 Apr 29;94(9):4637-41. doi: 10.1073/pnas.94.9.4637. Proc Natl Acad Sci U S A. 1997. PMID: 9114043 Free PMC article. - Induction by leptin of uncoupling protein-2 and enzymes of fatty acid oxidation.
Zhou YT, Shimabukuro M, Koyama K, Lee Y, Wang MY, Trieu F, Newgard CB, Unger RH. Zhou YT, et al. Proc Natl Acad Sci U S A. 1997 Jun 10;94(12):6386-90. doi: 10.1073/pnas.94.12.6386. Proc Natl Acad Sci U S A. 1997. PMID: 9177227 Free PMC article. - Diseases of liporegulation: new perspective on obesity and related disorders.
Unger RH, Orci L. Unger RH, et al. FASEB J. 2001 Feb;15(2):312-21. doi: 10.1096/fj.00-0590. FASEB J. 2001. PMID: 11156947 Review.
Cited by
- Leptin resistance does not induce hyperphagia in the rat.
Higuchi T, Mizuno A, Narita K, Ichimaru T, Murata T. Higuchi T, et al. J Physiol Sci. 2012 Jan;62(1):45-51. doi: 10.1007/s12576-011-0184-5. Epub 2011 Dec 6. J Physiol Sci. 2012. PMID: 22144345 Free PMC article. - AMP-activated protein kinase signaling in metabolic regulation.
Long YC, Zierath JR. Long YC, et al. J Clin Invest. 2006 Jul;116(7):1776-83. doi: 10.1172/JCI29044. J Clin Invest. 2006. PMID: 16823475 Free PMC article. Review. - The impacts of obesity on the cardiovascular and renal systems: cascade of events and therapeutic approaches.
Soltani Z, Washco V, Morse S, Reisin E. Soltani Z, et al. Curr Hypertens Rep. 2015 Feb;17(2):7. doi: 10.1007/s11906-014-0520-2. Curr Hypertens Rep. 2015. PMID: 25620635 Review. - Troglitazone prevents mitochondrial alterations, beta cell destruction, and diabetes in obese prediabetic rats.
Higa M, Zhou YT, Ravazzola M, Baetens D, Orci L, Unger RH. Higa M, et al. Proc Natl Acad Sci U S A. 1999 Sep 28;96(20):11513-8. doi: 10.1073/pnas.96.20.11513. Proc Natl Acad Sci U S A. 1999. PMID: 10500208 Free PMC article. - Leptin treatment confers clinical benefit at multiple stages of virally induced type 1 diabetes in BB rats.
Kruger AJ, Yang C, Lipson KL, Pino SC, Leif JH, Hogan CM, Whalen BJ, Guberski DL, Lee Y, Unger RH, Greiner DL, Rossini AA, Bortell R. Kruger AJ, et al. Autoimmunity. 2011 Mar;44(2):137-48. doi: 10.3109/08916934.2010.482116. Epub 2010 Aug 9. Autoimmunity. 2011. PMID: 20695765 Free PMC article.
References
- Zhang Y, Proenca R, Maffei M, Barone M, Leopold L, Friedman J M. Nature (London) 1994;372:425–432. - PubMed
- Coleman D L. Diabetologia. 1978;14:141–148. - PubMed
- Pelleymounter M A, Cullen M J, Baker M B, Hecht R, Winters D, Boone T, Collins F. Science. 1995;269:540–543. - PubMed
- Halaas J L, Gajiwala K S, Maffei M, Cohen S L, Chait B T, Rabinowitz D, Lallone R L, Burley S K, Friedman J M. Science. 1995;269:543–546. - PubMed
- Campfield L A, Smith F J, Guisez Y, Devos R, Burn P. Science. 1995;269:546–549. - PubMed
Publication types
MeSH terms
Substances
LinkOut - more resources
Full Text Sources
Other Literature Sources
Medical
Miscellaneous


