GLUT8 is a glucose transporter responsible for insulin-stimulated glucose uptake in the blastocyst - PubMed (original) (raw)
GLUT8 is a glucose transporter responsible for insulin-stimulated glucose uptake in the blastocyst
M O Carayannopoulos et al. Proc Natl Acad Sci U S A. 2000.
Abstract
Mammalian preimplantation blastocysts exhibit insulin-stimulated glucose uptake despite the absence of the only known insulin-regulated transporter, GLUT4. We describe a previously unidentified member of the mammalian facilitative GLUT superfamily that exhibits approximately 20-25% identity with other murine facilitative GLUTs. Insulin induces a change in the intracellular localization of this protein, which translates into increased glucose uptake into the blastocyst, a process that is inhibited by antisense oligoprobes. Presence of this transporter may be necessary for successful blastocyst development, fuel metabolism, and subsequent implantation. Moreover, the existence of an alternative transporter may explain examples in other tissues of insulin-regulated glucose transport in the absence of GLUT4.
Figures
Figure 1
GLUT8 sequence analysis. Protein alignment of mouse GLUT8 with murine GLUT1–4. The alignment was made with
megalign
in the
dnastar
program with the clustal method. Gray shading indicates positions that are identical in all transporters; open boxes identify residues shared by four of five transporters. The approximate positions of the transmembrane regions are denoted by a bar and the abbreviation TM.
Figure 2
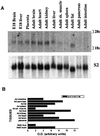
GLUT8 expression is detected in most tissue RNA. (A) Northern blot of total RNA from adult and fetal mouse tissue (15 μg) with a GLUT8 cDNA probe prepared as described in_Methods_. GLUT8 is present as a 2.1-kilobase band. E18, embryonic day 18. (B) Quantitation of RNA. The same blot was stripped and rehybridized to a mouse ribosomal protein S2 cDNA fragment that served as an internal control. The OD of each mRNA band was assessed with a Molecular Dynamics PhosphorImager and
imagequant
software (Molecular Dynamics) and was expressed as a percentage of the corresponding S2 message.
Figure 3
GLUT8 detected in overexpression systems or endogenous mouse tissue. (A) Immunoprecipitation/immunoblot analysis of FLAG-GLUT8 overexpressed in COS-7 cells. Whole-cell lysates were made from COS-7 cells transfected either with vector only (Vector) or with a construct expressing GLUT8 tagged with the peptide tag FLAG (DYKDDDDK). All lysates were immunoprecipitated (IP) with anti-FLAGM2, and immunoblot (IB) analysis was performed with anti-FLAGM2, anti-GLUT8, and anti-GLUT8 + peptide. Immunoglobulin heavy chain (Ig HC) and immunoglobulin (Ig LC) are indicated by arrows. (B) GLUT8 protein is detected as an ≈37-kDa band in adult mouse brain (Br), heart (He), skeletal muscle (SkM), and blastocyst stage embryos (Blast). Each adult tissue lane contains 100 μg of protein. The blastocyst lane contain ≈279 blastocysts for a total of ≈7 μg of protein.
Figure 4
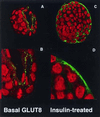
Confocal immunofluorescent labeling to localize GLUT8 protein expression in the blastocyst under basal and insulin-stimulated conditions. (A) Blastocyst under basal conditions stained with peptide-purified polyclonal antibody to the C terminus of GLUT8 (green) and propidium iodide (red) as a nuclear stain. This technique localizes the protein to the trophectoderm and primitive endoderm lining the blastocoel. (B) Higher magnification of the trophectoderm revealing GLUT8 in vesicle-like intracellular compartment. (C) Blastocyst under insulin-stimulated conditions stained with the same GLUT8 antibody. This technique demonstrates a general cellular redistribution of the protein with increased plasma membrane staining. (D) Higher magnification of the blastocyst cells revealing cytoplasmic and plasma membrane staining and less staining of the vesicle-like compartments.
Figure 5
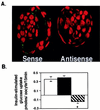
GLUT8 is responsible for insulin-stimulated glucose uptake in the mouse blastocyst. (A) Confocal immunofluorescent labeling with GLUT8 antibody to determine the effect of treatment on GLUT8 expression. Embryos cultured in GLUT8 antisense demonstrate little or no GLUT protein expression compared with those cultured in sense. More than 15 blastocysts were evaluated for each group. (B) Insulin-stimulated glucose transport measured as pmol per embryo per 15 min or change in basal vs. insulin-stimulated 2-deoxyglucose taken up by individual blastocysts cultured in control medium (open bar), medium with 5 μM GLUT8 sense (black bar), or medium with 5 μM GLUT8 antisense (striped bar). Each bar represents three experiments totaling approximately 45 blastocysts. *, P < 0.001 by ANOVA with Fisher's test.
Figure 6
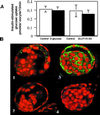
GLUT1 and GLUT3 are not responsible for the insulin-stimulated glucose uptake. (A) Insulin-stimulated glucose transport was not significantly different in embryos exposed to high glucose vs. control conditions despite the decrease in GLUT1 and GLUT3 protein. Similarly, decreasing GLUT1 and GLUT3 expression with antisense had no effect on insulin-stimulated glucose uptake as compared with controls. (B) Confocal immunofluorescent labeling with GLUT8 (B1) revealed no decrease in GLUT8 protein expression in embryos cultured under high glucose conditions (52 mM
d
-glucose); this effect is in contrast to labeling with GLUT1 (B2), which showed a significant decrease in expression on exposure to high glucose. GLUT3 demonstrated the same decrease in protein expression in response to high glucose (data not shown). Exposure to GLUT1 sense (B3) had no effect on GLUT1 protein expression, whereas exposure to GLUT1 antisense (B4) markedly decreased GLUT1 protein expression at the blastocyst stage. GLUT3 sense and antisense produced the same results.
Figure 7
GLUT8 transports 2-deoxyglucose in a Xenopus expression system. (A) Uptake of 2-deoxy-
d
-[3H]glucose (50 μM, 30 min at 22°C) was measured 3 days after injection of water (Sham) or 50 ng of GLUT8, GLUT1, or GLUT4 mRNA into stage V Xenopus oocytes. Each bar represents two experiments totaling at least 35 oocytes. *, P < 0.001 by ANOVA with Fisher's test as compared with sham. (B) Immunoblot (IB) analysis of total membranes from oocytes injected with sham, GLUT8 mRNA, GLUT1 mRNA, or GLUT4 mRNA.
Figure 8
The preimplantation mouse blastocyst. A schematic drawing of the differentiated mouse blastocyst. The inner cell mass (ICM) and trophectoderm are the two cell lineages formed at this stage. The trophectoderm epithelium serves as the interface between the blastocyst and the oviduct/uterine environment. The polar and mural trophectoderm are in direct contact with the ICM and blastocoel, respectively. The primitive endoderm, a polarized epithelial layer derived from the ICM, separates the ICM from the blastocoel.
Similar articles
- Two insulin-responsive glucose transporter isoforms and the insulin receptor are developmentally expressed in rabbit preimplantation embryos.
Navarrete Santos A, Tonack S, Kirstein M, Kietz S, Fischer B. Navarrete Santos A, et al. Reproduction. 2004 Nov;128(5):503-16. doi: 10.1530/rep.1.00203. Reproduction. 2004. PMID: 15509696 - Bovine glucose transporter GLUT8: cloning, expression, and developmental regulation in mammary gland.
Zhao FQ, Miller PJ, Wall EH, Zheng YC, Dong B, Neville MC, McFadden TB. Zhao FQ, et al. Biochim Biophys Acta. 2004 Oct 21;1680(2):103-13. doi: 10.1016/j.bbaexp.2004.09.001. Biochim Biophys Acta. 2004. PMID: 15488990 - Syntaxin 4 expression affects glucose transporter 8 translocation and embryo survival.
Wyman AH, Chi M, Riley J, Carayannopoulos MO, Yang C, Coker KJ, Pessin JE, Moley KH. Wyman AH, et al. Mol Endocrinol. 2003 Oct;17(10):2096-102. doi: 10.1210/me.2002-0240. Epub 2003 Jun 26. Mol Endocrinol. 2003. PMID: 12829803 - Intracellular organization of insulin signaling and GLUT4 translocation.
Watson RT, Pessin JE. Watson RT, et al. Recent Prog Horm Res. 2001;56:175-93. doi: 10.1210/rp.56.1.175. Recent Prog Horm Res. 2001. PMID: 11237212 Review. - GLUT4 activation: thoughts on possible mechanisms.
Michelle Furtado L, Poon V, Klip A. Michelle Furtado L, et al. Acta Physiol Scand. 2003 Aug;178(4):287-96. doi: 10.1046/j.1365-201X.2003.01160.x. Acta Physiol Scand. 2003. PMID: 12864733 Review.
Cited by
- The Impact of SLC2A8 RNA Interference on Glucose Uptake and the Transcriptome of Human Trophoblast Cells.
Lipka A, Paukszto Ł, Kennedy VC, Tanner AR, Majewska M, Anthony RV. Lipka A, et al. Cells. 2024 Feb 24;13(5):391. doi: 10.3390/cells13050391. Cells. 2024. PMID: 38474355 Free PMC article. - Lysosomal glucose sensing and glycophagy in metabolism.
Mancini MC, Noland RC, Collier JJ, Burke SJ, Stadler K, Heden TD. Mancini MC, et al. Trends Endocrinol Metab. 2023 Nov;34(11):764-777. doi: 10.1016/j.tem.2023.07.008. Epub 2023 Aug 24. Trends Endocrinol Metab. 2023. PMID: 37633800 Free PMC article. Review. - Drosophila melanogaster as a versatile model organism to study genetic epilepsies: An overview.
Fischer FP, Karge RA, Weber YG, Koch H, Wolking S, Voigt A. Fischer FP, et al. Front Mol Neurosci. 2023 Feb 16;16:1116000. doi: 10.3389/fnmol.2023.1116000. eCollection 2023. Front Mol Neurosci. 2023. PMID: 36873106 Free PMC article. Review. - MeCP2 Is an Epigenetic Factor That Links DNA Methylation with Brain Metabolism.
Vuu YM, Roberts CT, Rastegar M. Vuu YM, et al. Int J Mol Sci. 2023 Feb 20;24(4):4218. doi: 10.3390/ijms24044218. Int J Mol Sci. 2023. PMID: 36835623 Free PMC article. Review. - Importance of GLUT Transporters in Disease Diagnosis and Treatment.
Ismail A, Tanasova M. Ismail A, et al. Int J Mol Sci. 2022 Aug 4;23(15):8698. doi: 10.3390/ijms23158698. Int J Mol Sci. 2022. PMID: 35955833 Free PMC article. Review.
References
- Moley K H, Chi M M-Y, Mueckler M M. Am J Physiol. 1998;275:E38–E47. - PubMed
- Hogan A, Heyner S, Charron M J, Copeland N G, Gilbert D J, Jenkins M A, Thorens B, Schultz G A. Development (Cambridge, UK) 1991;113:363–372. - PubMed
- Aghayan M, Rao L V, Smith R M, Jarett L, Charron M J, Thorens B, Heyner S. Development (Cambridge, UK) 1992;115:305–312. - PubMed
- Moley K H, Chi M M-Y, Knudson C M, Korsmeyer S J, Mueckler M M. Nat Med. 1998;12:1421–1424. - PubMed
Publication types
MeSH terms
Substances
Grants and funding
- HD-25024/HD/NICHD NIH HHS/United States
- R01 HD025024/HD/NICHD NIH HHS/United States
- R01 DK038495/DK/NIDDK NIH HHS/United States
- R01 DK030579/DK/NIDDK NIH HHS/United States
- P60 DK30579/DK/NIDDK NIH HHS/United States
- T32 DK007296/DK/NIDDK NIH HHS/United States
- Wellcome Trust/United Kingdom
- R03 HD34693/HD/NICHD NIH HHS/United States
LinkOut - more resources
Full Text Sources
Other Literature Sources
Medical
Molecular Biology Databases


