A collection of breast cancer cell lines for the study of functionally distinct cancer subtypes - PubMed (original) (raw)
doi: 10.1016/j.ccr.2006.10.008.
Koei Chin, Jane Fridlyand, Jennifer Yeh, Frederick L Baehner, Tea Fevr, Laura Clark, Nora Bayani, Jean-Philippe Coppe, Frances Tong, Terry Speed, Paul T Spellman, Sandy DeVries, Anna Lapuk, Nick J Wang, Wen-Lin Kuo, Jackie L Stilwell, Daniel Pinkel, Donna G Albertson, Frederic M Waldman, Frank McCormick, Robert B Dickson, Michael D Johnson, Marc Lippman, Stephen Ethier, Adi Gazdar, Joe W Gray
Affiliations
- PMID: 17157791
- PMCID: PMC2730521
- DOI: 10.1016/j.ccr.2006.10.008
A collection of breast cancer cell lines for the study of functionally distinct cancer subtypes
Richard M Neve et al. Cancer Cell. 2006 Dec.
Abstract
Recent studies suggest that thousands of genes may contribute to breast cancer pathophysiologies when deregulated by genomic or epigenomic events. Here, we describe a model "system" to appraise the functional contributions of these genes to breast cancer subsets. In general, the recurrent genomic and transcriptional characteristics of 51 breast cancer cell lines mirror those of 145 primary breast tumors, although some significant differences are documented. The cell lines that comprise the system also exhibit the substantial genomic, transcriptional, and biological heterogeneity found in primary tumors. We show, using Trastuzumab (Herceptin) monotherapy as an example, that the system can be used to identify molecular features that predict or indicate response to targeted therapies or other physiological perturbations.
Figures
Figure 1. Comparison of array CGH analyses of human breast cancer cell lines and primary tumors
A and B: Frequencies of significant increases or decreases in genome copy number are plotted as a function of genome location for 51 cell lines (A) and 145 primary tumors (Fridlyand et al., 2006) (B). Positive values indicate frequencies of samples showing copy number increases [Log2(copy number) > 0.3], and negative values indicate frequencies of samples showing copy number decreases [Log2(copy number) < −0.3]. C and D: Differences (y axis) between frequencies of gains and losses across the genome for the cell lines versus the tumors are represented in C and D, respectively. Genome copy number aberration frequencies are plotted as a function of location position in the genome beginning at 1pter to the left and ending at Xqter to the right (chromosome locations are indicated by numbers above and below graphs). Vertical lines indicate chromosome boundaries. Vertical dotted lines indicate centromere locations.
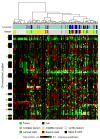
Figure 2. Unsupervised hierarchical clustering of genome aberrations in 51 breast cancer cell lines and 145 primary breast tumors
Clusters show results at 1952 BAC probes common between the tumor and cell line CGH arrays. Each row represents a BAC probe, and each column represents a cell line or tumor sample. Green indicates increased genome copy number, and red indicates decreased genome copy number. Yellow indicates high-level amplification. The bar to the left shows chromosome locations with chromosome 1pter to the top and 22qter to the bottom. The locations of the odd-numbered chromosomes (shaded black) are indicated. The upper color bar shows columns representing tumors or cell lines. The lower color bar indicates the genomic characteristics of the cell lines and tumors from this study and for the tumors as reported (Fridlyand et al., 2006). Color codes are indicated at the bottom of the figure.
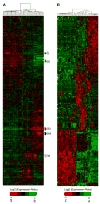
Figure 3. Gene expression profiles of 51 human breast cancer cell lines
A: Hierarchical cluster analysis of breast cancer cell lines with subclusters [(i) through (v)] indicated by colored bars at side. Genes were restricted to those showing significant variance across all samples, resulting in clustering of 1438 probe sets (see Experimental Procedures). B: Cell lines clustered by genes selected by PAM analysis representing the luminal, Basal A, and Basal B clusters. Clustering was performed as described in the Experimental Procedures. Each row represents a gene, and each column represents a cell line sample. As shown in the color bar, black represents no change, red represents upregulation, and green represents downregulation of gene expression.
Figure 4. Comparative analyses of aberration frequencies in basal and luminal primary tumors and cell lines
A–C: A and B show frequencies of genome copy number gains and losses in luminal and basal breast tumors, respectively (Fridlyand et al., 2006). C shows univariate statistical assessments of differences between the two tumor types. D–F: D and E show frequencies of genome copy number gains and losses in luminal and Basal B breast cancer cell lines, respectively. F shows univariate statistical assessments of differences between the two cell line types. p values of 0.05 and 0.01 are indicated as in C. All data are plotted beginning at chromosome 1pter to the left and ending at Xqter to the right. Vertical solid lines indicate chromosome boundaries. Vertical dashed lines indicate centromere locations. p values of 0.05 and 0.01 are indicated by dashed horizontal lines in C and F.
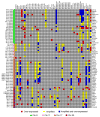
Figure 5. A functional model to investigate lead candidate therapeutic targets
Gene expression and copy number for the 66 candidate therapeutic genes in the 51 breast cancer cell lines. Genes were selected for their overexpression and association with outcome in human breast tumors (Chin et al., 2006). High gene expression (≥2-fold over mean gene expression for all the samples) is shown in red, and high-level amplification (≥0.9 Log2 ratio) is shown in yellow for each cell line. Genes that have high expression and gene copy number are shown in blue. Gene HUGO names are shown to the right, and the corresponding BAC clone ID and chromosome are shown to the left.
Figure 6. Relationship of transcriptional profiles to biological function
A: Morphology of cell lines grown in tissue culture on plastic. B: Invasive potential of 30 breast cancer cell lines as measured by modified Boyden chamber assays (see Experimental Procedures). Each data point represents the mean ± SD of three wells.
Figure 7. Indicators of therapeutic response to Trastuzumab in HER2-positive breast cancer cell lines
A: CGH profiles of nine breast cancer cell lines overexpressing HER2. B: Response of HER2-overexpressing cell lines to 48 hr treatment with 21 μg/ml Trastuzumab (Herceptin) as measured by BrdUrd incorporation (top panel) and relocalization of p27KIP1 (lower panel).
Comment in
- Integrated breast cancer genomics.
Edgren H, Kallioniemi O. Edgren H, et al. Cancer Cell. 2006 Dec;10(6):453-4. doi: 10.1016/j.ccr.2006.11.007. Cancer Cell. 2006. PMID: 17157784
Similar articles
- Comprehensive comparison of molecular portraits between cell lines and tumors in breast cancer.
Jiang G, Zhang S, Yazdanparast A, Li M, Pawar AV, Liu Y, Inavolu SM, Cheng L. Jiang G, et al. BMC Genomics. 2016 Aug 22;17 Suppl 7(Suppl 7):525. doi: 10.1186/s12864-016-2911-z. BMC Genomics. 2016. PMID: 27556158 Free PMC article. - Genomic and transcriptional aberrations linked to breast cancer pathophysiologies.
Chin K, DeVries S, Fridlyand J, Spellman PT, Roydasgupta R, Kuo WL, Lapuk A, Neve RM, Qian Z, Ryder T, Chen F, Feiler H, Tokuyasu T, Kingsley C, Dairkee S, Meng Z, Chew K, Pinkel D, Jain A, Ljung BM, Esserman L, Albertson DG, Waldman FM, Gray JW. Chin K, et al. Cancer Cell. 2006 Dec;10(6):529-41. doi: 10.1016/j.ccr.2006.10.009. Cancer Cell. 2006. PMID: 17157792 - Palmitate-induced ER stress increases trastuzumab sensitivity in HER2/neu-positive breast cancer cells.
Baumann J, Wong J, Sun Y, Conklin DS. Baumann J, et al. BMC Cancer. 2016 Jul 27;16:551. doi: 10.1186/s12885-016-2611-8. BMC Cancer. 2016. PMID: 27464732 Free PMC article. - Origins of breast cancer subtypes and therapeutic implications.
Sims AH, Howell A, Howell SJ, Clarke RB. Sims AH, et al. Nat Clin Pract Oncol. 2007 Sep;4(9):516-25. doi: 10.1038/ncponc0908. Nat Clin Pract Oncol. 2007. PMID: 17728710 Review. - Systems biology and genomics of breast cancer.
Perou CM, Børresen-Dale AL. Perou CM, et al. Cold Spring Harb Perspect Biol. 2011 Feb 1;3(2):a003293. doi: 10.1101/cshperspect.a003293. Cold Spring Harb Perspect Biol. 2011. PMID: 21047916 Free PMC article. Review.
Cited by
- Transcriptomic analysis of cellular senescence induced by ectopic expression of ATF6α in human breast cancer cells.
Kim JW, Bae SH, Moon Y, Kim EK, Kim Y, Park YG, Han MR, Sohn J. Kim JW, et al. PLoS One. 2024 Oct 28;19(10):e0309749. doi: 10.1371/journal.pone.0309749. eCollection 2024. PLoS One. 2024. PMID: 39466820 Free PMC article. - Alterations of EGFR, p53 and PTEN that mimic changes found in basal-like breast cancer promote transformation of human mammary epithelial cells.
Pires MM, Hopkins BD, Saal LH, Parsons RE. Pires MM, et al. Cancer Biol Ther. 2013 Mar;14(3):246-53. doi: 10.4161/cbt.23297. Epub 2013 Jan 4. Cancer Biol Ther. 2013. PMID: 23291982 Free PMC article. - Phenotypic and Molecular Characterization of MCF10DCIS and SUM Breast Cancer Cell Lines.
Barnabas N, Cohen D. Barnabas N, et al. Int J Breast Cancer. 2013;2013:872743. doi: 10.1155/2013/872743. Epub 2013 Jan 16. Int J Breast Cancer. 2013. PMID: 23401782 Free PMC article. - Tumor-derived exosomal circPSMA1 facilitates the tumorigenesis, metastasis, and migration in triple-negative breast cancer (TNBC) through miR-637/Akt1/β-catenin (cyclin D1) axis.
Yang SJ, Wang DD, Zhong SL, Chen WQ, Wang FL, Zhang J, Xu WX, Xu D, Zhang Q, Li J, Zhang HD, Hou JC, Mao L, Tang JH. Yang SJ, et al. Cell Death Dis. 2021 Apr 28;12(5):420. doi: 10.1038/s41419-021-03680-1. Cell Death Dis. 2021. PMID: 33911067 Free PMC article. - Lyn modulates Claudin-2 expression and is a therapeutic target for breast cancer liver metastasis.
Tabariès S, Annis MG, Hsu BE, Tam CE, Savage P, Park M, Siegel PM. Tabariès S, et al. Oncotarget. 2015 Apr 20;6(11):9476-87. doi: 10.18632/oncotarget.3269. Oncotarget. 2015. PMID: 25823815 Free PMC article.
References
- Abd El-Rehim DM, Pinder SE, Paish CE, Bell J, Blamey RW, Robertson JF, Nicholson RI, Ellis IO. Expression of luminal and basal cytokeratins in human breast carcinoma. J Pathol. 2004;203:661–671. - PubMed
- Albertson DG, Collins C, McCormick F, Gray JW. Chromosome aberrations in solid tumors. Nat Genet. 2003;34:369–376. - PubMed
- Alimandi M, Romano A, Curia MC, Muraro R, Fedi P, Aaronson SA, Di Fiore PP, Kraus MH. Cooperative signaling of ErbB3 and ErbB2 in neoplastic transformation and human mammary carcinomas. Oncogene. 1995;10:1813–1821. - PubMed
- Beck GR, Jr, Zerler B, Moran E. Gene array analysis of osteoblast differentiation. Cell Growth Differ. 2001;12:61–83. - PubMed
Publication types
MeSH terms
Substances
Grants and funding
- U54 CA112970-05/CA/NCI NIH HHS/United States
- U54 CA090788/CA/NCI NIH HHS/United States
- CA090788/CA/NCI NIH HHS/United States
- P50 CA058207/CA/NCI NIH HHS/United States
- CA112970/CA/NCI NIH HHS/United States
- U54 CA112970/CA/NCI NIH HHS/United States
- CA 58207/CA/NCI NIH HHS/United States
LinkOut - more resources
Full Text Sources
Other Literature Sources
Medical
Molecular Biology Databases
Research Materials


