Systems-level modeling of cancer-fibroblast interaction - PubMed (original) (raw)
Systems-level modeling of cancer-fibroblast interaction
Raymond C Wadlow et al. PLoS One. 2009.
Abstract
Cancer cells interact with surrounding stromal fibroblasts during tumorigenesis, but the complex molecular rules that govern these interactions remain poorly understood thus hindering the development of therapeutic strategies to target cancer stroma. We have taken a mathematical approach to begin defining these rules by performing the first large-scale quantitative analysis of fibroblast effects on cancer cell proliferation across more than four hundred heterotypic cell line pairings. Systems-level modeling of this complex dataset using singular value decomposition revealed that normal tissue fibroblasts variably express at least two functionally distinct activities, one which reflects transcriptional programs associated with activated mesenchymal cells, that act either coordinately or at cross-purposes to modulate cancer cell proliferation. These findings suggest that quantitative approaches may prove useful for identifying organizational principles that govern complex heterotypic cell-cell interactions in cancer and other contexts.
Conflict of interest statement
Competing Interests: The authors have declared that no competing interests exist.
Figures
Figure 1. Quantitative analysis of cancer-fibroblast cell line interactions.
A) Heat map representation of experimentally determined co-culture ratios for 432 cancer-fibroblast cell line interactions. Red refers to growth-stimulatory interactions and blue to growth-suppressive interactions. B) Interactions resulting in statistically significant growth stimulation of cancer cells (i.e. the lower bound of the 95% CI for the co-culture ratio is >1) are shown in red, and interactions resulting in statistically significant growth inhibition of cancer cells (i.e. the upper bound of the 95% CI for the co-culture ratio is <1) are shown in blue. The circle indicates the interaction between T47D and AG04351, and the square indicates the interaction between T47D and AG09877.
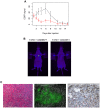
Figure 2. Cancer cell-fibroblast xenografts.
A) EGFP signal from injections of EGFP-expressing T47D cells with AG09877 fibroblasts (5 mice, blue curve) or AG04351 fibroblasts (4 mice, red curve). Error bars represent standard error of the mean. B) Representative pictures of mice xenografted with each admixture taken 3 days after injection, with white arrows pointing to injection sites. C) Photomicrographs of a T47D-AG09877 tumor. From left to right: hematoxylin and eosin staining, GFP fluorescence, and immunohistochemistry for cytokeratin.
Figure 3. Cancer cell proliferation in co-culture is determined by properties of both cancer cells and fibroblasts.
A) The growth response of cancer cell lines (circles) to fibroblasts (oblong shapes) is determined predominantly by the preprogrammed ability of cancer cells to proliferate in response to generic fibroblast signals (black arrows) shared in common across all fibroblast lines. Some cancer cell lines (green) are growth stimulated, while others (yellow) are unresponsive or growth-inhibited. B) Additional signals produced by subsets of fibroblasts (red arrows) add complexity by either further stimulating cancer cell proliferation (upper left panel) or compensating for the lack of response to generic signals (lower left panel). Although all signals in this schematic are defined as growth-stimulatory, they may also be growth-inhibitory thus adding further complexity.
Figure 4. Cross-validation model.
Median leave-one-out cross-validation error when the matrix of co-culture ratios is approximated by the sum of N component matrices.
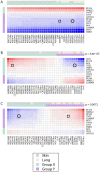
Figure 5. Mathematical modeling of cancer-fibroblast interaction.
A)–C) Decomposition of the co-culture matrix into 3 component matrices. When applicable, cancer and fibroblast cell lines are divided into two groups (X, green, and Y, purple) such that interactions within the same group make growth-stimulatory (i.e. positive) contributions to the estimated co-culture ratio and interactions between opposite groups make growth-inhibitory (i.e. negative) contributions to the estimated co-culture ratio. P values refer to tissue of origin segregation between X and Y groups. Circles indicate the interaction between T47D and AG04351, and squares indicate the interaction between T47D and AG09877. Red refers to growth-stimulatory interactions and blue to growth-suppressive interactions, with intensity corresponding to the strength of the effect and scaled independently within each matrix.
Figure 6. Enrichment of EMT genes in skin vs. lung fibroblasts.
Heat map (right) and enrichment plot (left) for the EMT gene set from GSEA analysis of skin vs. lung fibroblasts .
Similar articles
- Fibroblasts direct differentiation of human breast epithelial progenitors.
Morsing M, Kim J, Villadsen R, Goldhammer N, Jafari A, Kassem M, Petersen OW, Rønnov-Jessen L. Morsing M, et al. Breast Cancer Res. 2020 Sep 29;22(1):102. doi: 10.1186/s13058-020-01344-0. Breast Cancer Res. 2020. PMID: 32993755 Free PMC article. - Dicer reprograms stromal fibroblasts to a pro-inflammatory and tumor-promoting phenotype in ovarian cancer.
Yang Z, Jin P, Xu S, Zhang T, Yang X, Li X, Wei X, Sun C, Chen G, Ma D, Gao Q. Yang Z, et al. Cancer Lett. 2018 Feb 28;415:20-29. doi: 10.1016/j.canlet.2017.11.026. Epub 2017 Dec 1. Cancer Lett. 2018. PMID: 29199004 - Prostate cancer cells specifically reorganize epithelial cell-fibroblast communication through proteoglycan and junction pathways.
Suhovskih AV, Kashuba VI, Klein G, Grigorieva EV. Suhovskih AV, et al. Cell Adh Migr. 2017 Jan 2;11(1):39-53. doi: 10.1080/19336918.2016.1182292. Epub 2016 Apr 25. Cell Adh Migr. 2017. PMID: 27111714 Free PMC article. - Complexity in the tumour microenvironment: Cancer associated fibroblast gene expression patterns identify both common and unique features of tumour-stroma crosstalk across cancer types.
Gandellini P, Andriani F, Merlino G, D'Aiuto F, Roz L, Callari M. Gandellini P, et al. Semin Cancer Biol. 2015 Dec;35:96-106. doi: 10.1016/j.semcancer.2015.08.008. Epub 2015 Aug 28. Semin Cancer Biol. 2015. PMID: 26320408 Review. - Integration of quantitative methods and mathematical approaches for the modeling of cancer cell proliferation dynamics.
Cotner M, Meng S, Jost T, Gardner A, De Santiago C, Brock A. Cotner M, et al. Am J Physiol Cell Physiol. 2023 Feb 1;324(2):C247-C262. doi: 10.1152/ajpcell.00185.2022. Epub 2022 Dec 12. Am J Physiol Cell Physiol. 2023. PMID: 36503241 Free PMC article. Review.
Cited by
- The human airway epithelial basal cell transcriptome.
Hackett NR, Shaykhiev R, Walters MS, Wang R, Zwick RK, Ferris B, Witover B, Salit J, Crystal RG. Hackett NR, et al. PLoS One. 2011 May 4;6(5):e18378. doi: 10.1371/journal.pone.0018378. PLoS One. 2011. PMID: 21572528 Free PMC article. - Electric Cell-Substrate Impedance Sensing (ECIS) with Microelectrode Arrays for Investigation of Cancer Cell-Fibroblasts Interaction.
Tran TB, Baek C, Min J. Tran TB, et al. PLoS One. 2016 Apr 18;11(4):e0153813. doi: 10.1371/journal.pone.0153813. eCollection 2016. PLoS One. 2016. PMID: 27088611 Free PMC article. - Extensive rewiring of epithelial-stromal co-expression networks in breast cancer.
Oh EY, Christensen SM, Ghanta S, Jeong JC, Bucur O, Glass B, Montaser-Kouhsari L, Knoblauch NW, Bertos N, Saleh SM, Haibe-Kains B, Park M, Beck AH. Oh EY, et al. Genome Biol. 2015 Jun 19;16(1):128. doi: 10.1186/s13059-015-0675-4. Genome Biol. 2015. PMID: 26087699 Free PMC article. - Cadherin-23 mediates heterotypic cell-cell adhesion between breast cancer epithelial cells and fibroblasts.
Apostolopoulou M, Ligon L. Apostolopoulou M, et al. PLoS One. 2012;7(3):e33289. doi: 10.1371/journal.pone.0033289. Epub 2012 Mar 7. PLoS One. 2012. PMID: 22413011 Free PMC article. - Stromal dynamic reciprocity in cancer: intricacies of fibroblastic-ECM interactions.
Alexander J, Cukierman E. Alexander J, et al. Curr Opin Cell Biol. 2016 Oct;42:80-93. doi: 10.1016/j.ceb.2016.05.002. Epub 2016 May 20. Curr Opin Cell Biol. 2016. PMID: 27214794 Free PMC article. Review.
References
- Kalluri R, Zeisberg M. Fibroblasts in cancer. Nat Rev Cancer. 2006;6:392–401. - PubMed
- Beppu H, Mwizerwa ON, Beppu Y, Dattwyler MP, Lauwers GY, et al. Stromal inactivation of BMPRII leads to colorectal epithelial overgrowth and polyp formation. Oncogene. 2008;27:1063–1070. - PubMed
- Bhowmick NA, Chytil A, Plieth D, Gorska AE, Dumont N, et al. TGF-beta signaling in fibroblasts modulates the oncogenic potential of adjacent epithelia. Science. 2004;303:848–851. - PubMed
Publication types
MeSH terms
LinkOut - more resources
Full Text Sources
Molecular Biology Databases
Research Materials


